. 2025 Jul;58(7):991-1005.
doi: 10.1111/iej.14226. Epub 2025 Mar 19.

Activin a regulates vascular formation and stabilization in direct coculture of dental pulp stem cells and endothelial cells

Affiliations

Activin a regulates vascular formation and stabilization in direct coculture of dental pulp stem cells and endothelial cells

Jialin Zhong et al. Int Endod J. 2025 Jul.

Abstract

Aim: Establishing functional circulation on time is crucial to dental pulp tissue regeneration. Mesenchymal stem cells (MSCs) could act as mural cells to stabilize newly formed blood vessels, accelerating anastomosis. Our preliminary study found that direct coculture of dental pulp stem cells (DPSCs) and human umbilical vein endothelial cells (HUVECs) significantly enhanced Activin A secretion. This study aimed to disclose the dynamic patterns of Activin A expression and its regulation on vascular formation and stabilization.

Methodology: DPSCs and HUVECs were cocultured directly at a ratio of 1:1 for 3 and 6 days. Activin A and Follistatin expression were evaluated by qRT-PCR and ELISA. HUVECs were exposed to 100 ng/mL Activin A or the conditioned medium (CM) generated from DPSC monoculture and DPSC-HUVEC coculture, respectively. HUVEC proliferation, migration, tube formation and angiogenic sprouting were assessed. In parallel, membrane-bound vascular endothelial growth factor receptors (mVEGFR1 and mVEGFR2) and soluble VEGFR1 (sVEGFR1) were analysed at days 3 and 6.

Results: Activin A expression and secretion were elevated time-dependently during DPSC-HUVEC coculture. Follistatin expression decreased in DPSC-HUVEC coculture while the ratio of Activin A/Follinstain increased significantly. Activin A treatment did not promote DPSC towards smooth muscle cell (SMC)-specific differentiation, while Activin A and DPSC+HUVEC-CM suppressed HUVEC proliferation, migration, tube formation and sprouting. Activin A and DPSC+HUVEC-CM treatment markedly increased mVEGFR1 expression and sVEGFR1 secretion, suppressing HUVEC vascular formation. Activin A IgG partially reversed the effects of DPSC+HUVEC-CM on HUVECs by decreasing VEGFR1 expression and increasing vessel formation. Activin A pretreatment downregulated VEGF-triggered VEGFR2 phosphorylation of HUVECs. INHBA knockdown DPSCs disrupted the stabilization of the preformed HUVEC vascular tube network.

Conclusion: DPSC-HUVEC direct coculture upregulates Activin A secretion, interrupting VEGF receptors' balance in HUVECs to suppress HUVEC angiogenic sprouting and enhance vascular stabilization. These findings provide novel insights into the paracrine interactions on vascular stabilization of DPSC-HUVEC direct coculture.

Keywords: Activin A; angiogenesis; dental pulp stem cells; endothelial cells; vascular endothelial growth factor receptors; vascular stabilization.


Conflict of interest statement

The authors declare that they have no competing interests.

Figures
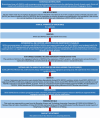
FIGURE 1
FIGURE 1
PRILE 2021 flowchart illustrating the steps involved in this study.
FIGURE 2
FIGURE 2
The expression and secretion of Activin A in dental pulp stem cells (DPSCs) monoculture, human umbilical vein endothelial cells (HUVECs) monoculture and DPSC+HUVEC cocultures. (a) ELISA analysis of Activin A in the supernatant of DPSC monoculture, HUVEC coculture and DPSC+HUVEC coculture at the indicated time points. (b) ELISA analysis of Follistatin in the supernatant of DPSC monoculture, HUVEC coculture and DPSC+HUVEC coculture at days 3 and 6. (c, d) Relative RNA expression of Activin A and Follistatin of DPSC monoculture, HUVEC monoculture and DPSC+HUVEC coculture at day 6. (e) ELISA analysis of the expression level of VEGF in the supernatant of DPSC monoculture and DPSC+HUVEC coculture. (f) The expression of VEGF in DPSC monoculture and DPSC+HUVEC coculture at days 1 and 6. (g) ELISA analysis of Activin A in the supernatant of DPSC monoculture and DPSC+HUVEC direct coculture and indirect coculture by Transwell inserts for 6 days. Data are represented as mean ± SD (n = 3), *p < 0.05, **p < 0.01, ***p < 0.001.
FIGURE 3
FIGURE 3
The angiogenic functions of HUVECs after treatment with Activin A. (a) HUVECs were cultured in 96‐well plates and stimulated with 100 ng/mL Activin A or 25 ng/mL VEGF for 72 h. Cell proliferation was determined by CCK‐8. (b) HUVEC migration was assessed by wound healing assay under Activin A or VEGF stimulation for 16 h. (c) The tube‐like structure formation on Matrigel assay. After 24 h of incubation, tube formation was photographed by a fluorescence microscope. Scale bar = 200 μm. The total tubule length and branching point number were analysed using ImageJ software. (d) Representative images of spheroids sprouting assay. Sprouting of HUVEC spheroids treated with Activin A or VEGF was determined by fluorescent microscopy. Quantification of cumulative sprout length per spheroid was conducted using ImageJ software. Scale bar = 100 μm. (e) Western blot analysis of vWF and CD31 in HUVECs after treatment with Activin A or VEGF for 6 days. (f) Relative RNA expression of vWF and CD31 in HUVECs after treatment with Activin A or VEGF for 6 days. Data are represented as mean ± SD (n = 3), *p < 0.05, **p < 0.01, ***p < 0.001.
FIGURE 4
FIGURE 4
The angiogenic functions of HUVECs after treatment with conditioned media (CM). (a) HUVECs were cultured in a coculture medium, CM of DPSC monoculture (D‐CM), CM of DPSC+HUVEC coculture (D+E‐CM) and D+E‐CM supplement with anti‐Activin A IgG for 72 h, respectively. HUVEC proliferation was determined by CCK‐8. (b) HUVEC migration was assessed by wound healing assay under D‐CM, D+E‐CM and D+E‐CM supplemented with anti‐Activin A IgG for 16 h. (c) Effect of different CM on tube formation in HUVECs. After 24 h of incubation with coculture medium, D‐CM, D+E‐CM or D+E‐CM supplement with anti‐Activin A IgG, respectively. The formation of tube‐like structure was photographed using fluorescent microscopy. Scale bar = 200 μm. The total tubule length and branching point number were analysed using ImageJ software. (d) Representative images of spheroids sprouting assay. Sprouting of HUVEC spheroids cultured with D‐CM, D+E‐CM and D+E‐CM supplement with anti‐Activin A IgG was determined by fluorescent microscopy. Quantification of cumulative sprout length per spheroid was conducted using ImageJ software. Scale bar = 100 μm. (e) Western blot analysis of vWF and CD31 in HUVECs after treatment with different CM for 6 days. (f) Relative RNA expression of vWF and CD31 in HUVECs after treatment with different CM for 6 days. Data are represented as mean ± SD (n = 3), *p < 0.05, **p < 0.01, ***p < 0.001.
FIGURE 5
FIGURE 5
The expression of VEGF receptors in DPSC‐HUVEC coculture and Activin A‐treated HUVECs. (a) The expression of soluble (s) and membrane‐bound (m) FLT‐1 in DPSC monoculture, HUVEC monoculture and DPSC+HUVEC coculture. (b) ELISA analysis of the expression of VEGFR1 in the supernatant of DPSC monoculture, HUVEC coculture and DPSC+HUVEC coculture at days 3 and 6. (c) Relative RNA expression of sFLT‐1 and mFLT‐1 in HUVECs after treatment with D‐CM, D+E‐CM and D+E‐CM supplemented with anti‐Activin A IgG for 48 h. (d) ELISA analysis of VEGFR1 in the supernatants of HUVECs after treatment with different CM. (e) ELISA analysis of VEGF in the supernatants of DPSC coculture with HUVEC transfected with siRNA targeting FLT‐1 or NC‐siRNA. (f) Relative RNA expression of sFLT‐1, mFLT‐1 and KDR in HUVECs after treatment with Activin A. (g) ELISA analysis of VEGFR1 in the supernatant of HUVECs after treatment with Activin A at the indicated time points. (h) Western blot analysis of VEGFR1 in HUVECs after treatment with Activin A for 3 and 6 days. (i) Western blot analysis of phosphorylated VEGFR2 in HUVECs after Activin A pretreatment for 48 h and then stimulated with VEGF for 15 min. Data are represented as mean ± SD (n = 3), *p < 0.05, **p < 0.01, ***p < 0.001.
FIGURE 6
FIGURE 6
The level of Activin A under various coculture conditions. (a) ELISA analysis of Activin A in the supernatant of DPSCs pre‐cultured with HUVECs and DPSC monoculture. (b) Relative RNA expression of Activin A in DPSCs isolated from D+E coculture and DPSC monoculture. (c) Western blot analysis of Activin A in DPSC monoculture, DPSCs isolated from D+E direct coculture (D+E(D)‐DPSC) and DPSCs isolated from D+E indirect (Transwell) coculture (D+E(T)‐DPSC). (d) ELISA analysis of Activin A in HUVECs cocultured with DPSC transfected with shRNA targeting INHBA (sh‐A) or NC (sh‐NC) for 6 days. (e) Relative RNA expression of Activin A in HUVECs cocultured with DPSC transfected with shRNA targeting INHBA or NC. (f) ELISA analysis of Activin A in the supernatant of cocultured DPSCs with 2% PFA‐fixed HUVECs, or reciprocally in the supernatant of cocultured HUVECs with 2% PFA‐fixed DPSCs. Data are represented as mean ± SD (n = 3), *p < 0.05, **p < 0.01, ***p < 0.001.
FIGURE 7
FIGURE 7
The stabilization of pre‐existing vessel‐like structures after addition of NC‐DPSC and Activin A knockdown DPSCs. (a) The addition of DPSCs (red fluorescence) at 24 h to the pre‐existing vessel‐like structures formed by HUVECs (green fluorescence). The stabilization of tube‐like structures was photographed using fluorescent microscopy. Scale bar = 200 μm. The branching point number, tube thickness and junctional area were analysed using ImageJ software. Data are represented as mean ± SD (n = 3), *p < 0.05, **p < 0.01, ***p < 0.001. (b) The proposed mechanisms of Activin A secretion in DPSC‐HUVEC coculture and its regulation of vascular formation and stabilization.

Similar articles

References

    1. Ben‐Shaul, S. , Landau, S. , Merdler, U. & Levenberg, S. (2019) Mature vessel networks in engineered tissue promote graft‐host anastomosis and prevent graft thrombosis. Proceedings of the National Academy of Sciences of the United States of America, 116(8), 2955–2960. - PMC - PubMed
    1. Betsholtz, C. (2018) Cell‐cell signaling in blood vessel development and function. EMBO Molecular Medicine, 10(3), e8610. - PMC - PubMed
    1. Bloise, E. , Ciarmela, P. , Dela Cruz, C. , Luisi, S. , Petraglia, F. & Reis, F.M. (2019) Activin a in mammalian physiology. Physiological Reviews, 99(1), 739–780. - PubMed
    1. Chen, X. , Aledia, A.S. , Ghajar, C.M. , Griffith, C.K. , Putnam, A.J. & Hughes, C.C. (2009) Prevascularization of a fibrin‐based tissue construct accelerates the formation of functional anastomosis with host vasculature. Tissue Engineering. Part A, 15(6), 1363–1371. - PMC - PubMed
    1. Cui, D. , Yu, S. , Zhou, X. , Liu, Y. , Gan, L. & Pan, Y. (2021) Roles of dental mesenchymal stem cells in the Management of Immature Necrotic Permanent Teeth. Frontiers in Cell and Developmental Biology, 9, 666186. - PMC - PubMed

Publication types