

Population genetic diversity of Schistosoma japonicum arises from the host switching in the life cycle
- PMID: 40106414
- PMCID: PMC11949366
- DOI: 10.1371/journal.pntd.0012931
Population genetic diversity of Schistosoma japonicum arises from the host switching in the life cycle
Abstract
Background: Schistosoma japonicum is a multi-host parasite, including asexual amplification in snail hosts and sexual reproduction in mammalian hosts. The genetic diversity of S. japonicum by host switching is less understood, which could help elucidate the genetic evolution of S. japonicum under host pressure and provide instruction for host sampling and the infection pattern to make S. japonicum infection models.
Methods: Different developmental stages of S. japonicum were collected and genotyped with 24 microsatellite loci, including 345 cercariae from naturally infected snails and 472 and 540 adult worms from artificially infected mice and rabbits, separately. The genetic distribution of S. japonicum within and among hosts by different sampling was assessed, and the genetic diversity and population structure were calculated at different population levels during host switching.
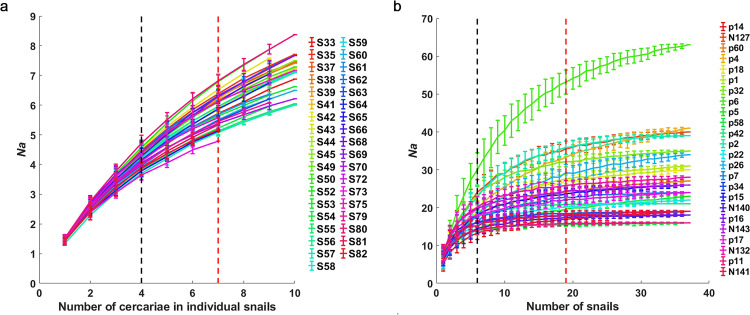
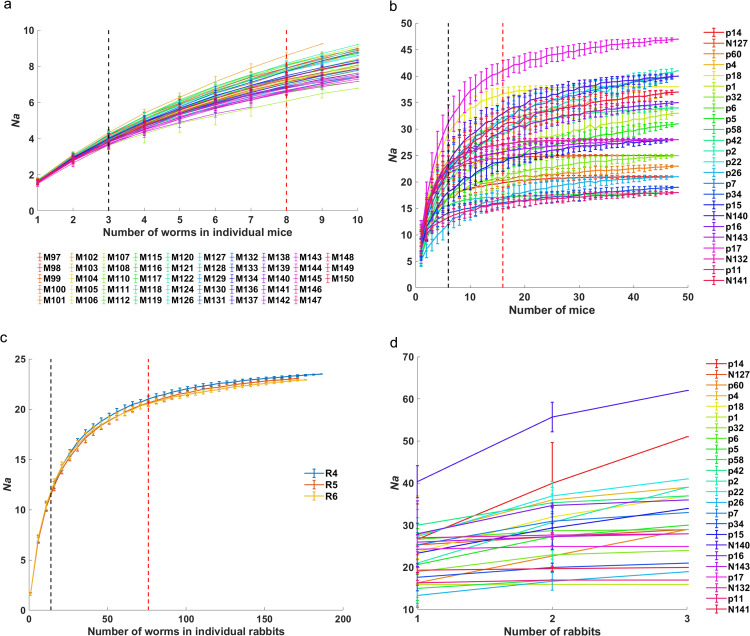
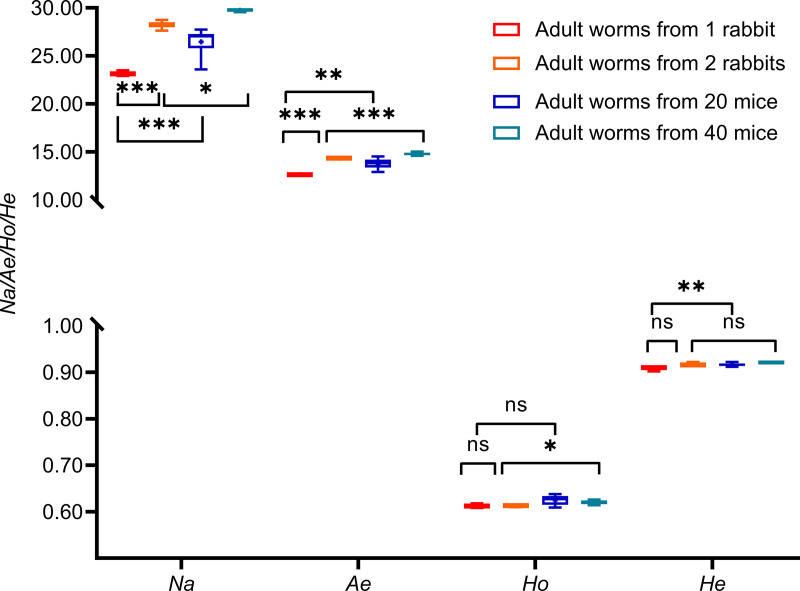
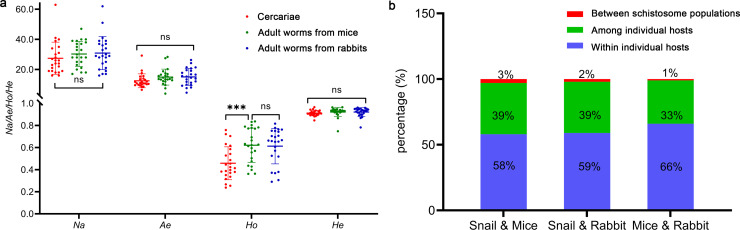
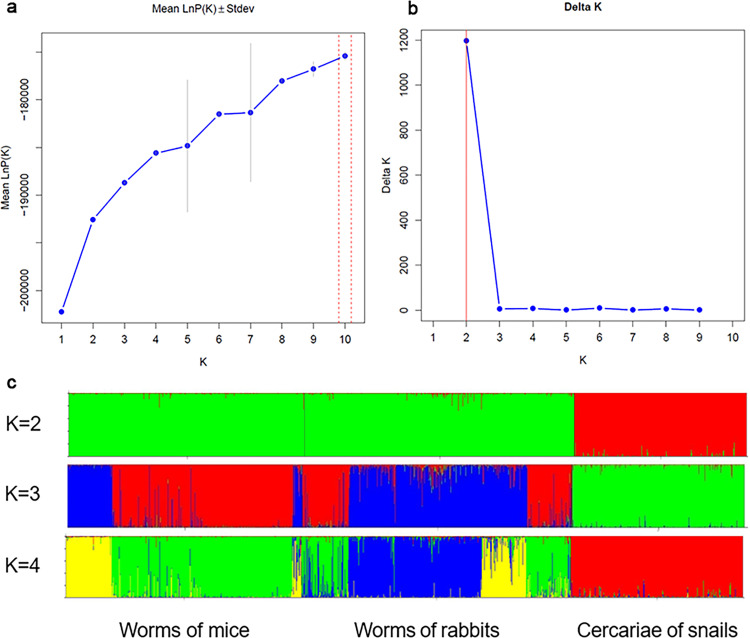
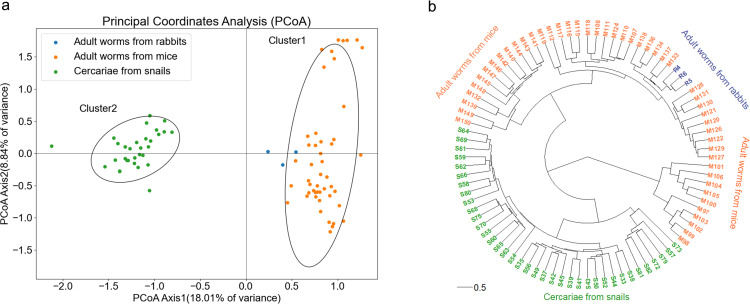
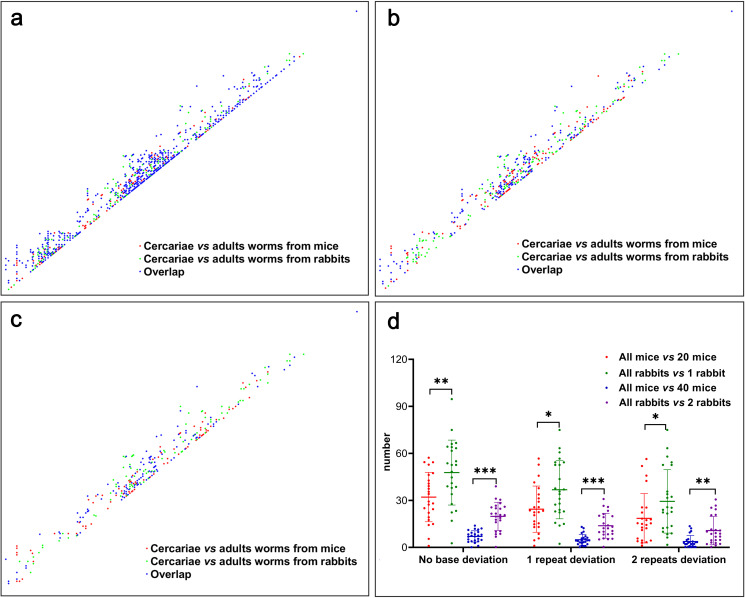
Results: Seven cercariae were the minimum sample size to retrieve 85% of alleles for S. japonicum in each snail, and meanwhile, sampling parasites from 19 snails could recover 85% of the total Na of S. japonicum in all snails in this study. After infection in mice and rabbits, 8 worms per mouse and 76 worms per rabbit were the minimum samplings to retrieve 90% of alleles from each corresponding definitive host. Further, 16 mice and 2 rabbits were the least sampling size to recover 85% of the total Na of S. japonicum in all mice and rabbits, respectively. Although no significant difference was shown for S. japonicum between mice and rabbits at the suprapopulation level, it is clear that the genetic diversity of worms from 20 (or 40) mice was significantly higher than that from 1 (or 2) rabbits, especially when the host sampling was not sufficiently enough. The differentiation of worms at the infrapopulation level among mice is less than among rabbits. In addition, genetic differentiation was shown between cercaria and adult worms, which was considered to relate to allele loss after host switching.
Conclusions: The population genetic diversity of S. japonicum differs in different developmental stages. Host species and sampling number significantly affect the distribution pattern of alleles and the genetic structure of S. japonicum at the suprapopulation level.
Copyright: © 2025 Long et al. This is an open access article distributed under the terms of the Creative Commons Attribution License, which permits unrestricted use, distribution, and reproduction in any medium, provided the original author and source are credited.
Conflict of interest statement
The authors have declared that no competing interests exist.
Figures
Similar articles
-
The genetic variation of different developmental stages of Schistosoma japonicum: do the distribution in snails and pairing preference benefit the transmission?Parasit Vectors. 2020 Jul 20;13(1):360. doi: 10.1186/s13071-020-04240-w. Parasit Vectors. 2020. PMID: 32690109 Free PMC article.
-
[Impact of the number of microsatellite markers on the analysis of population genetic diversity of Schistosoma japonicum].Zhongguo Xue Xi Chong Bing Fang Zhi Za Zhi. 2025 Jun 5;37(3):239-246. doi: 10.16250/j.32.1915.2025005. Zhongguo Xue Xi Chong Bing Fang Zhi Za Zhi. 2025. PMID: 40730521 Chinese.
-
An investigation into the potential effects of infrapopulation structure and other sources of sampling error, on population genetic studies of the transmission of Schistosoma japonicum (Trematoda: Digenea).Parasit Vectors. 2016 Mar 21;9:165. doi: 10.1186/s13071-016-1454-0. Parasit Vectors. 2016. PMID: 27000844 Free PMC article.
-
Population genetics of multi-host parasites--the case for molecular epidemiological studies of Schistosoma japonicum using larval stages from naturally infected hosts.Parasitology. 2005 Nov;131(Pt 5):617-26. doi: 10.1017/S0031182005008413. Parasitology. 2005. PMID: 16255820
-
Strain complex of Schistosoma japonicum in the mainland of China.Southeast Asian J Trop Med Public Health. 1994 Jun;25(2):232-42. Southeast Asian J Trop Med Public Health. 1994. PMID: 7855634 Review.
References
-
- WHO. Schistosomiasis. Geneva: World Health Organization; 2023. Available from: https://www.who.int/en/news-room/fact-sheets/detail/schistosomiasis
-
- Liang Y-S, Wang W, Li H-J, Shen X-H, Xu Y-L, Dai J-R. The South-to-North Water Diversion Project: effect of the water diversion pattern on transmission of Oncomelania hupensis, the intermediate host of Schistosoma japonicum in China. Parasit Vectors. 2012;5:52. doi: 10.1186/1756-3305-5-52 - DOI - PMC - PubMed
MeSH terms
LinkOut - more resources
Full Text Sources
Research Materials
