. 2025 Feb 25;122(8):e2416009122.
doi: 10.1073/pnas.2416009122. Epub 2025 Feb 18.

A limitation lifted: A conditional knockdown system reveals essential roles for Polo-like kinase and Aurora kinase 1 in Trypanosoma cruzi cell division

Affiliations

A limitation lifted: A conditional knockdown system reveals essential roles for Polo-like kinase and Aurora kinase 1 in Trypanosoma cruzi cell division

Justin Wiedeman et al. Proc Natl Acad Sci U S A. .

Abstract

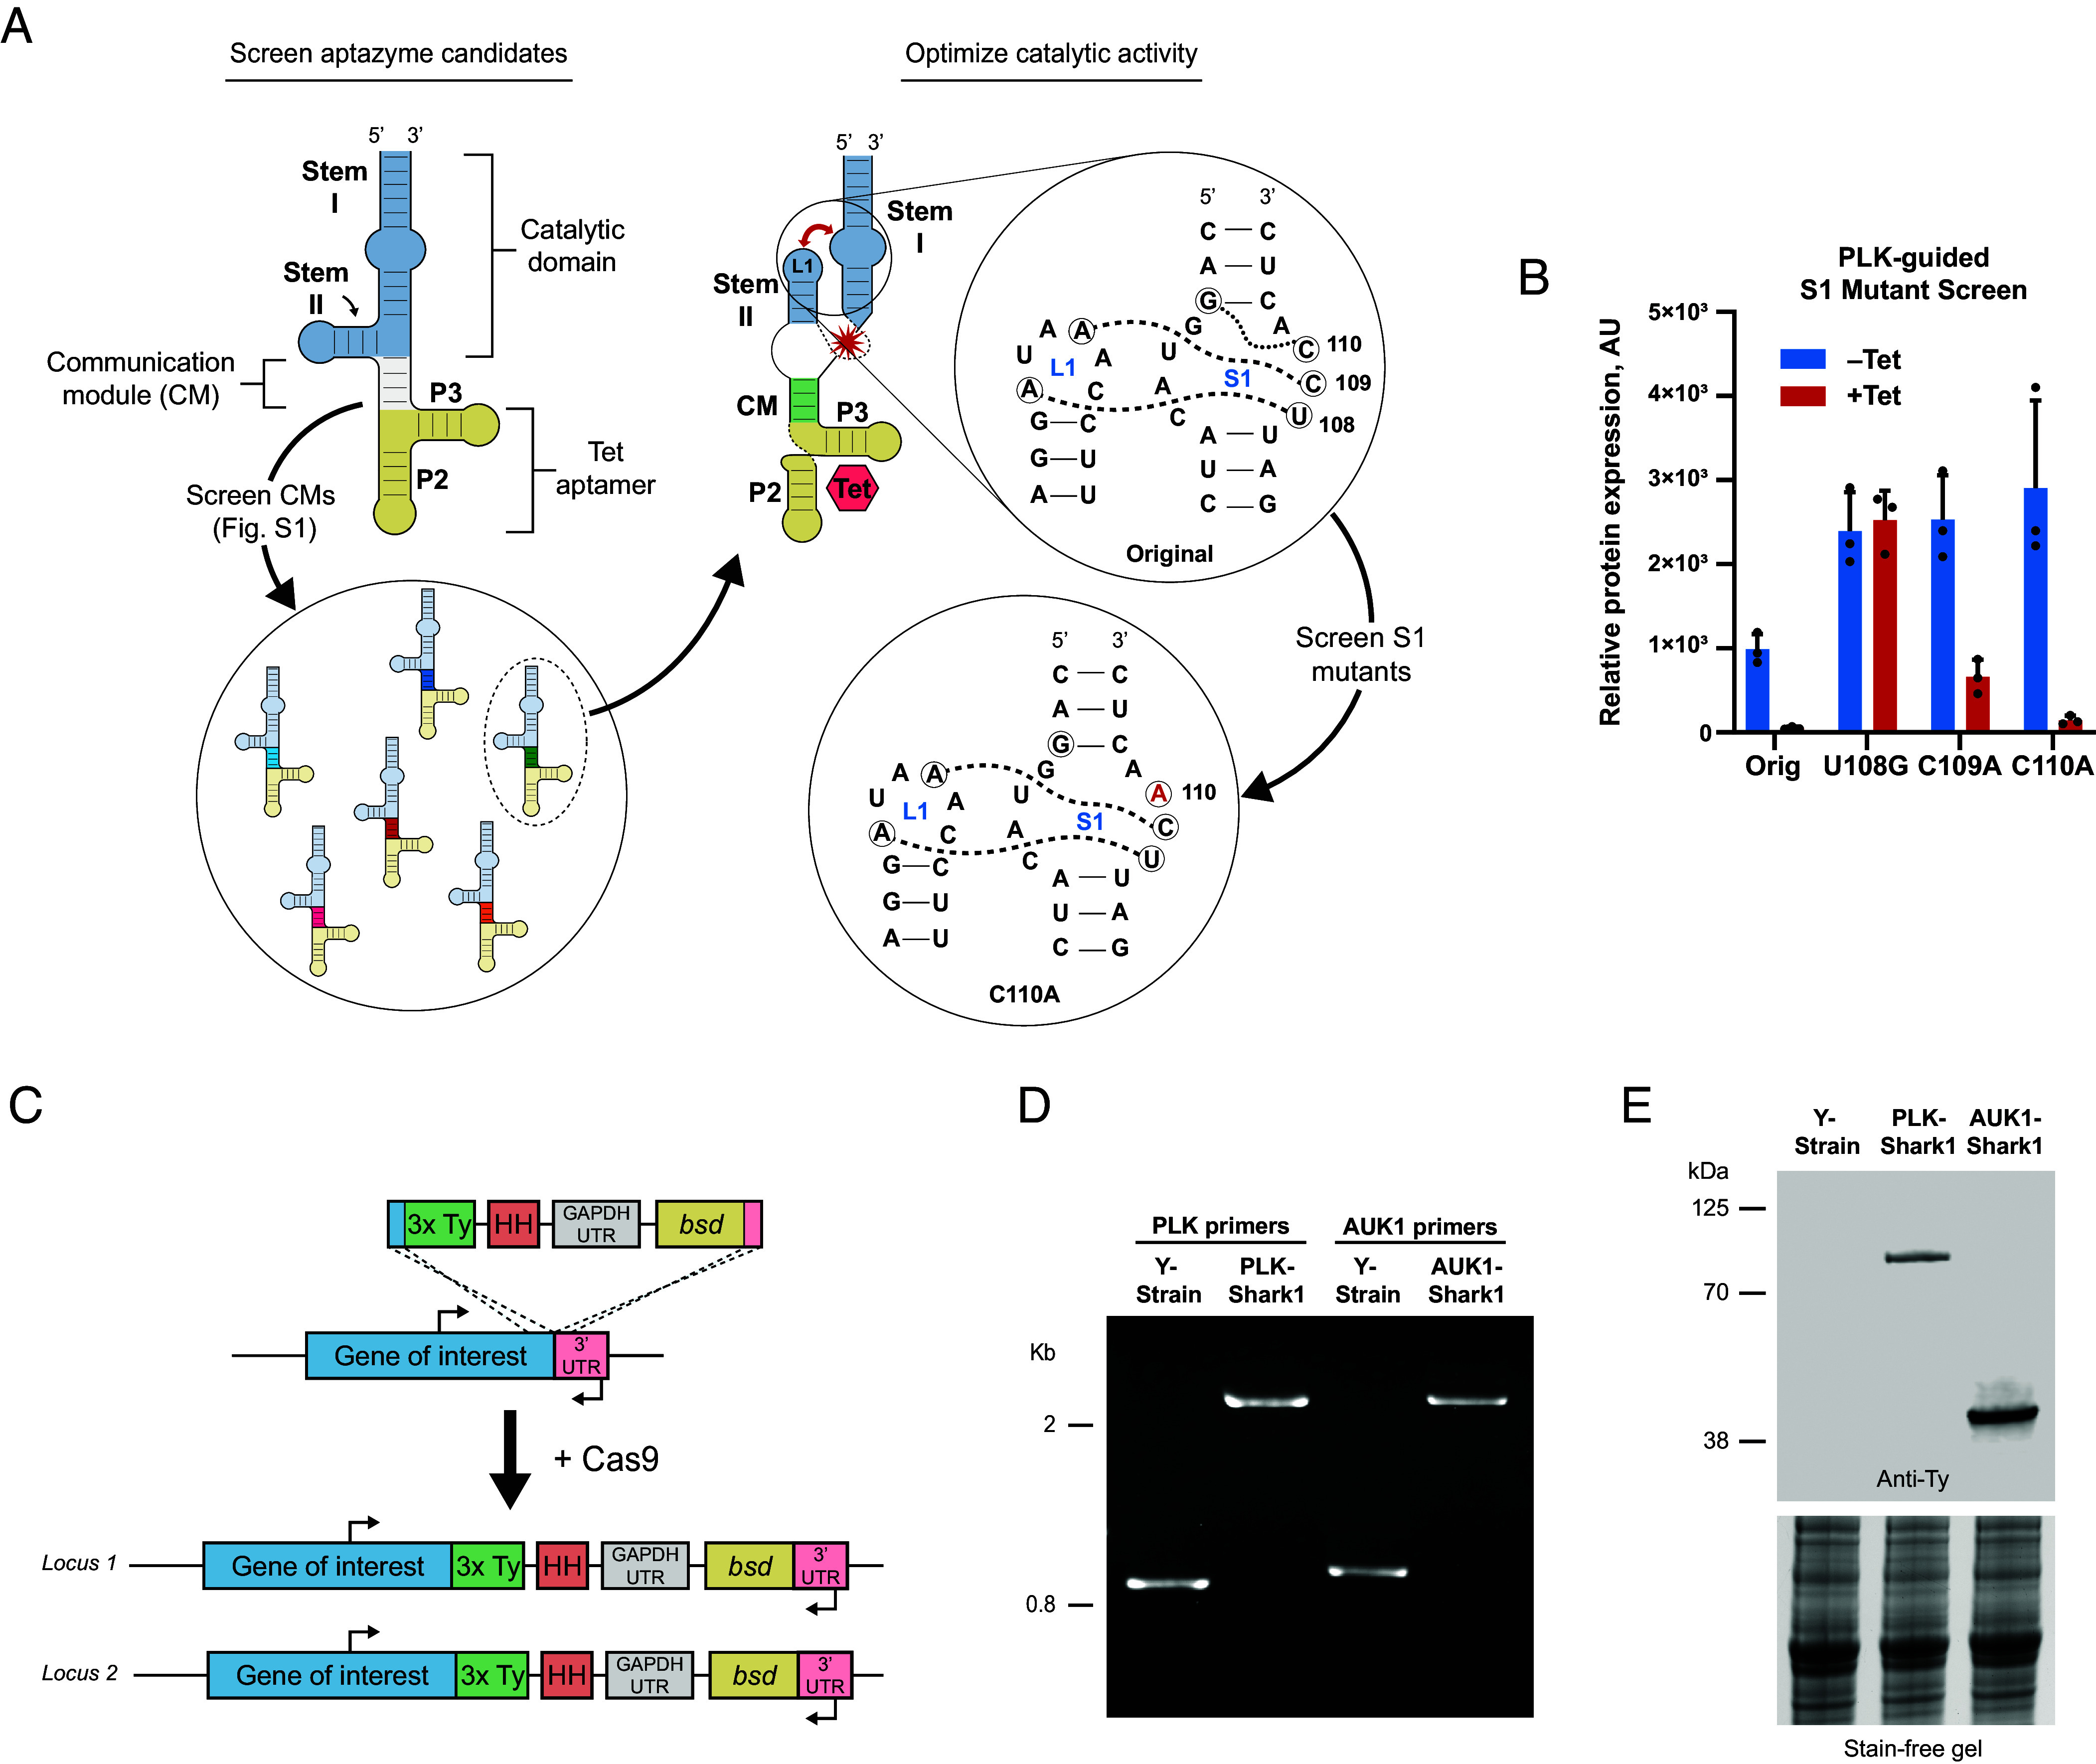
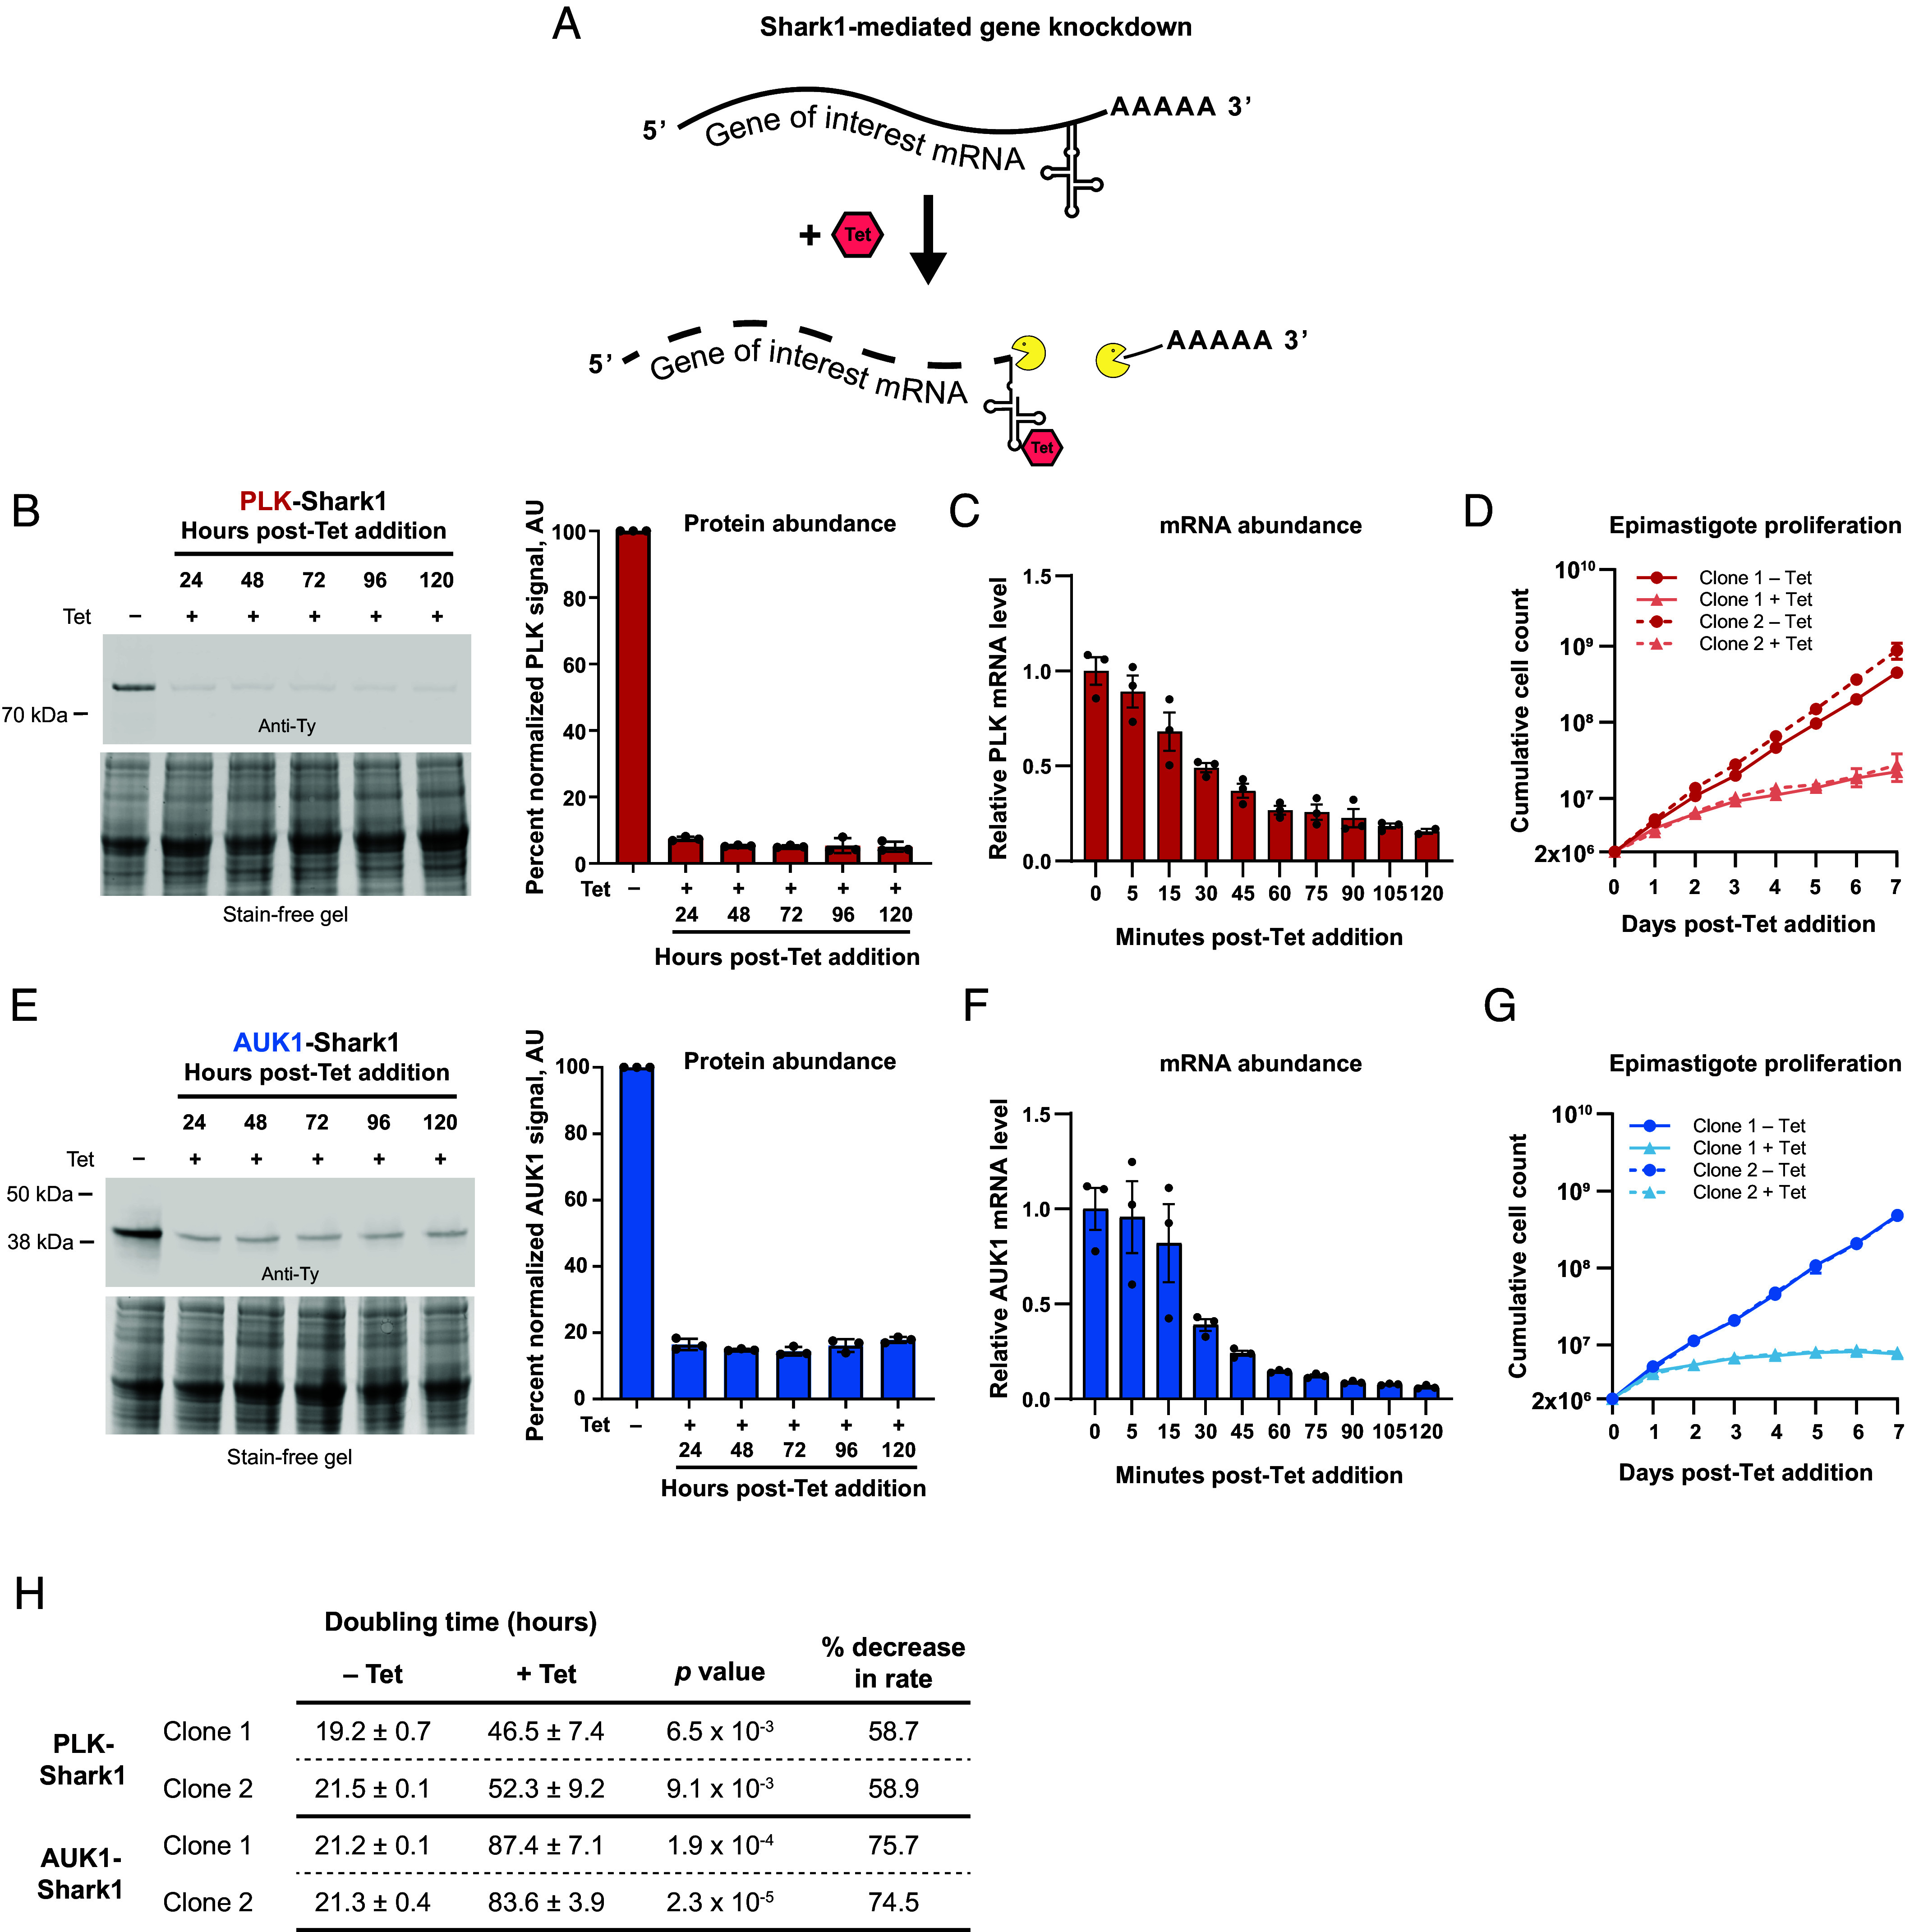
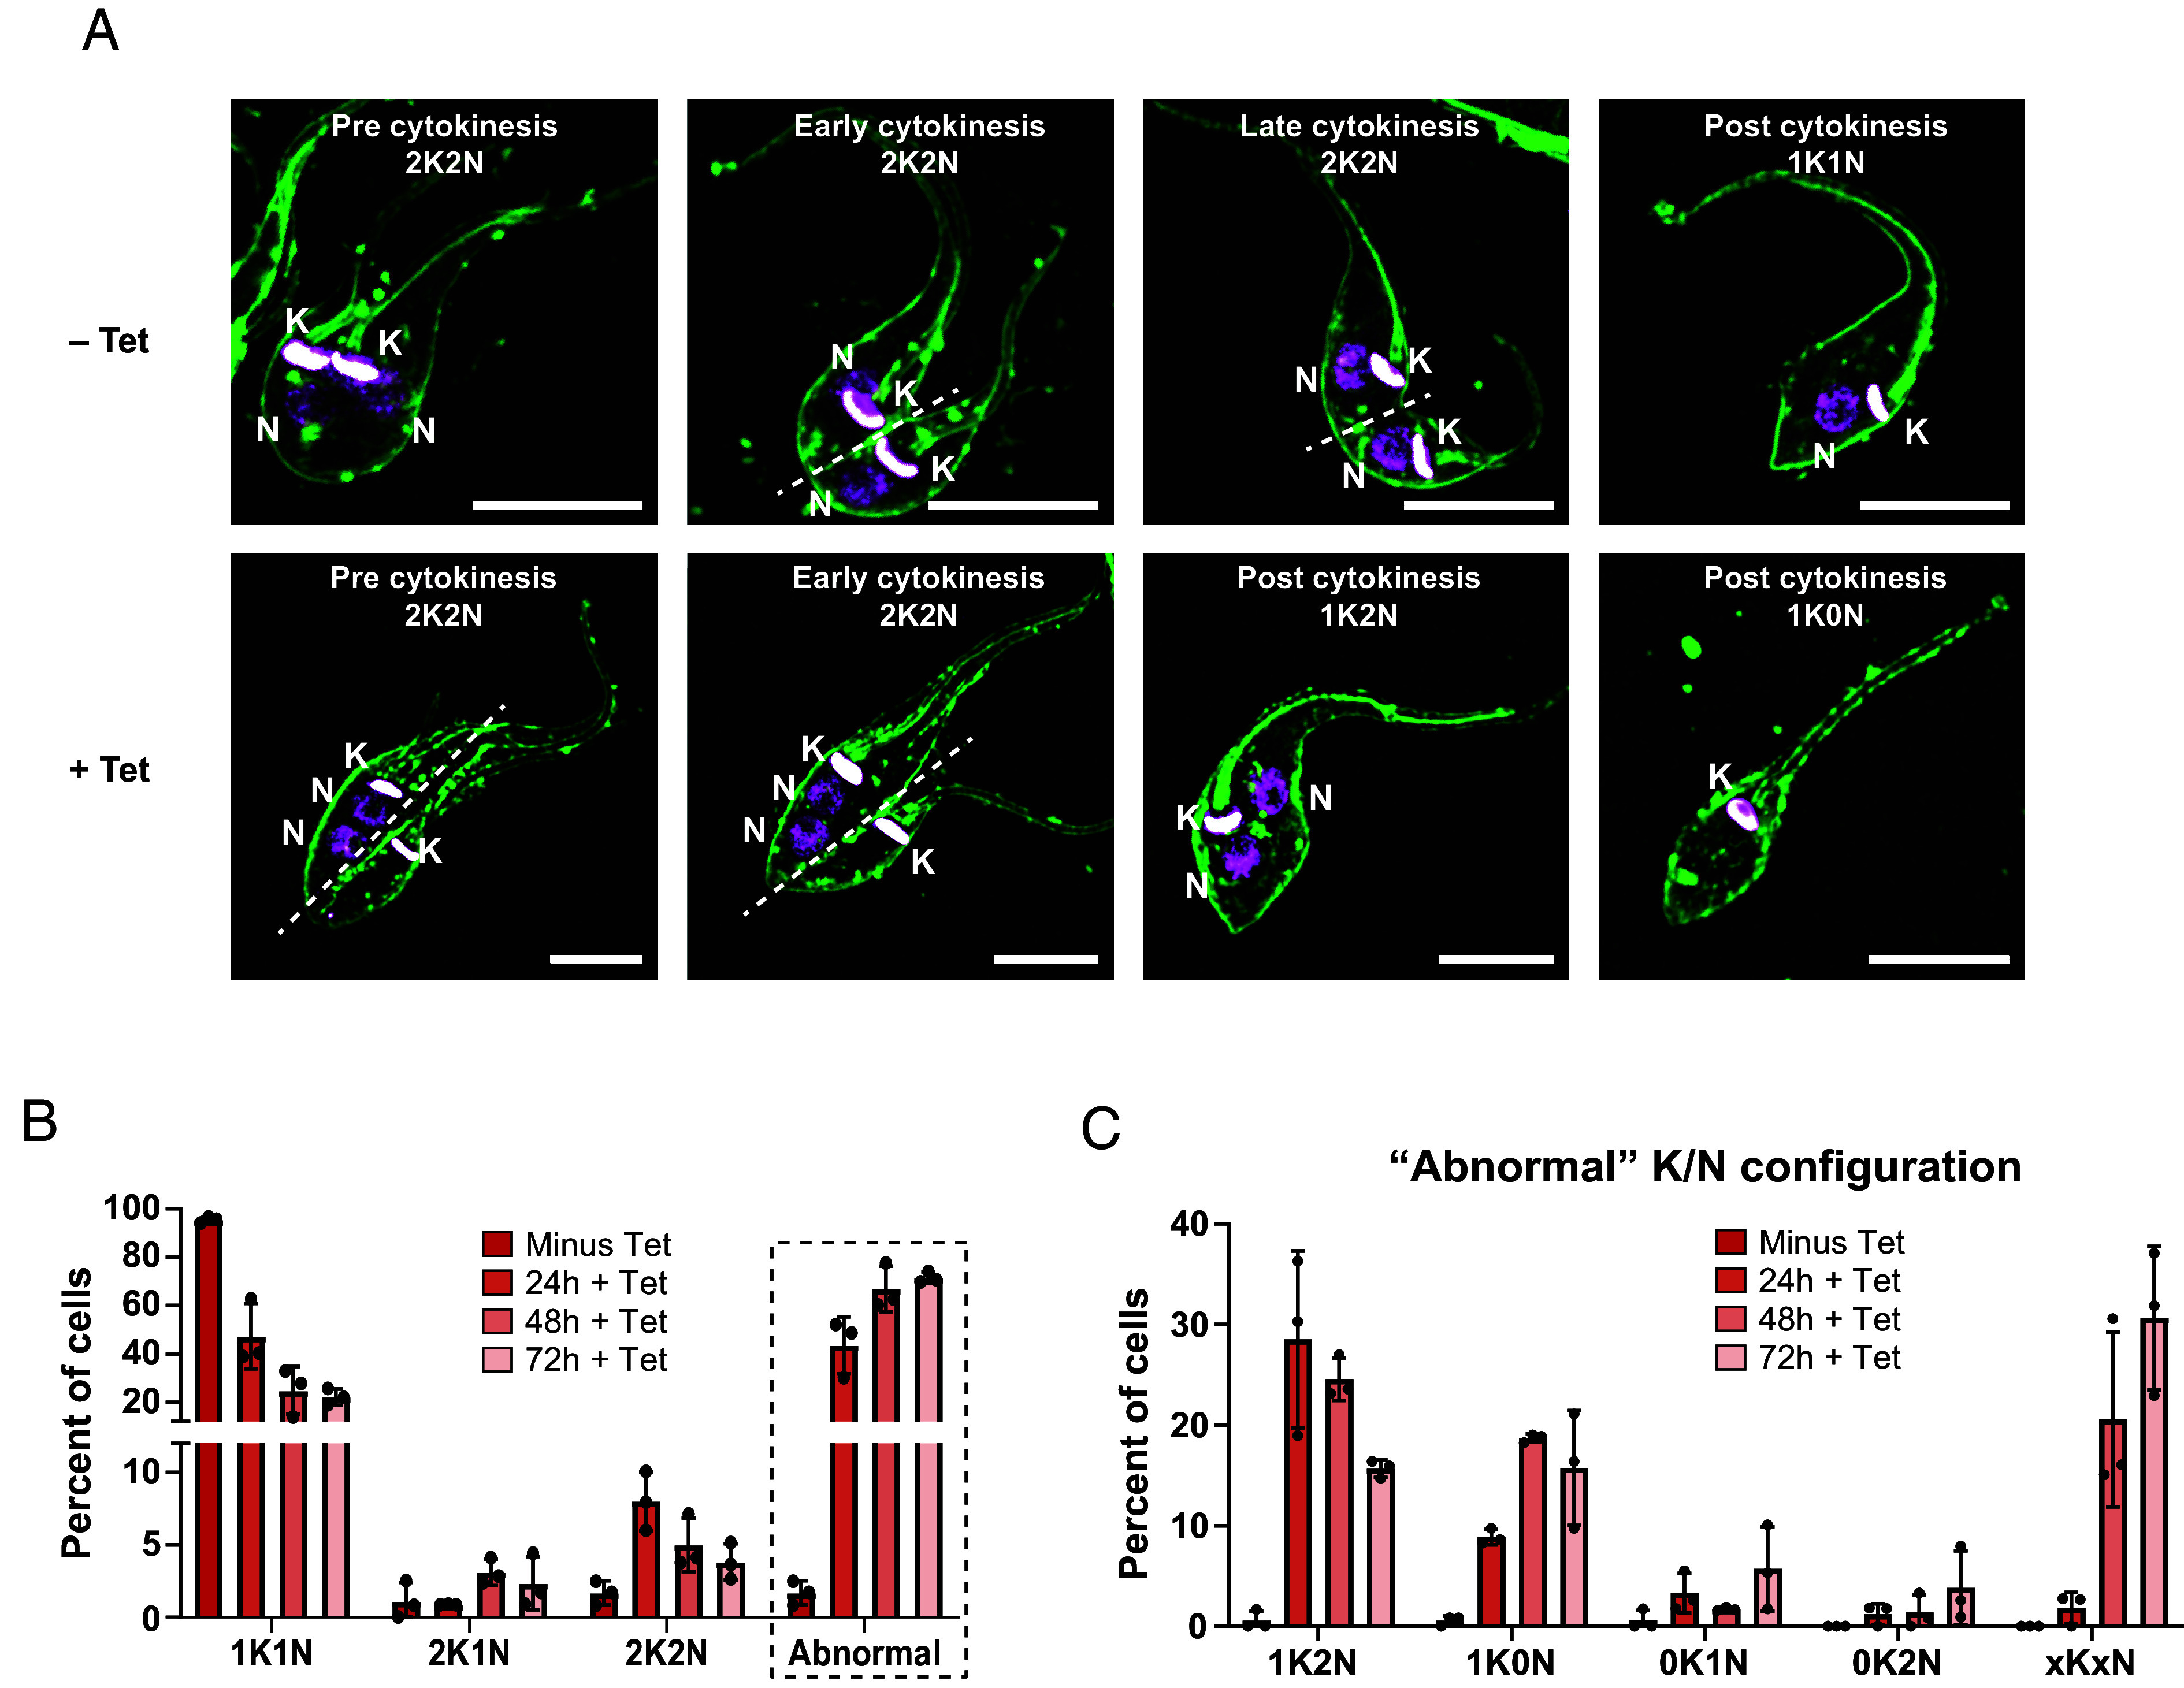
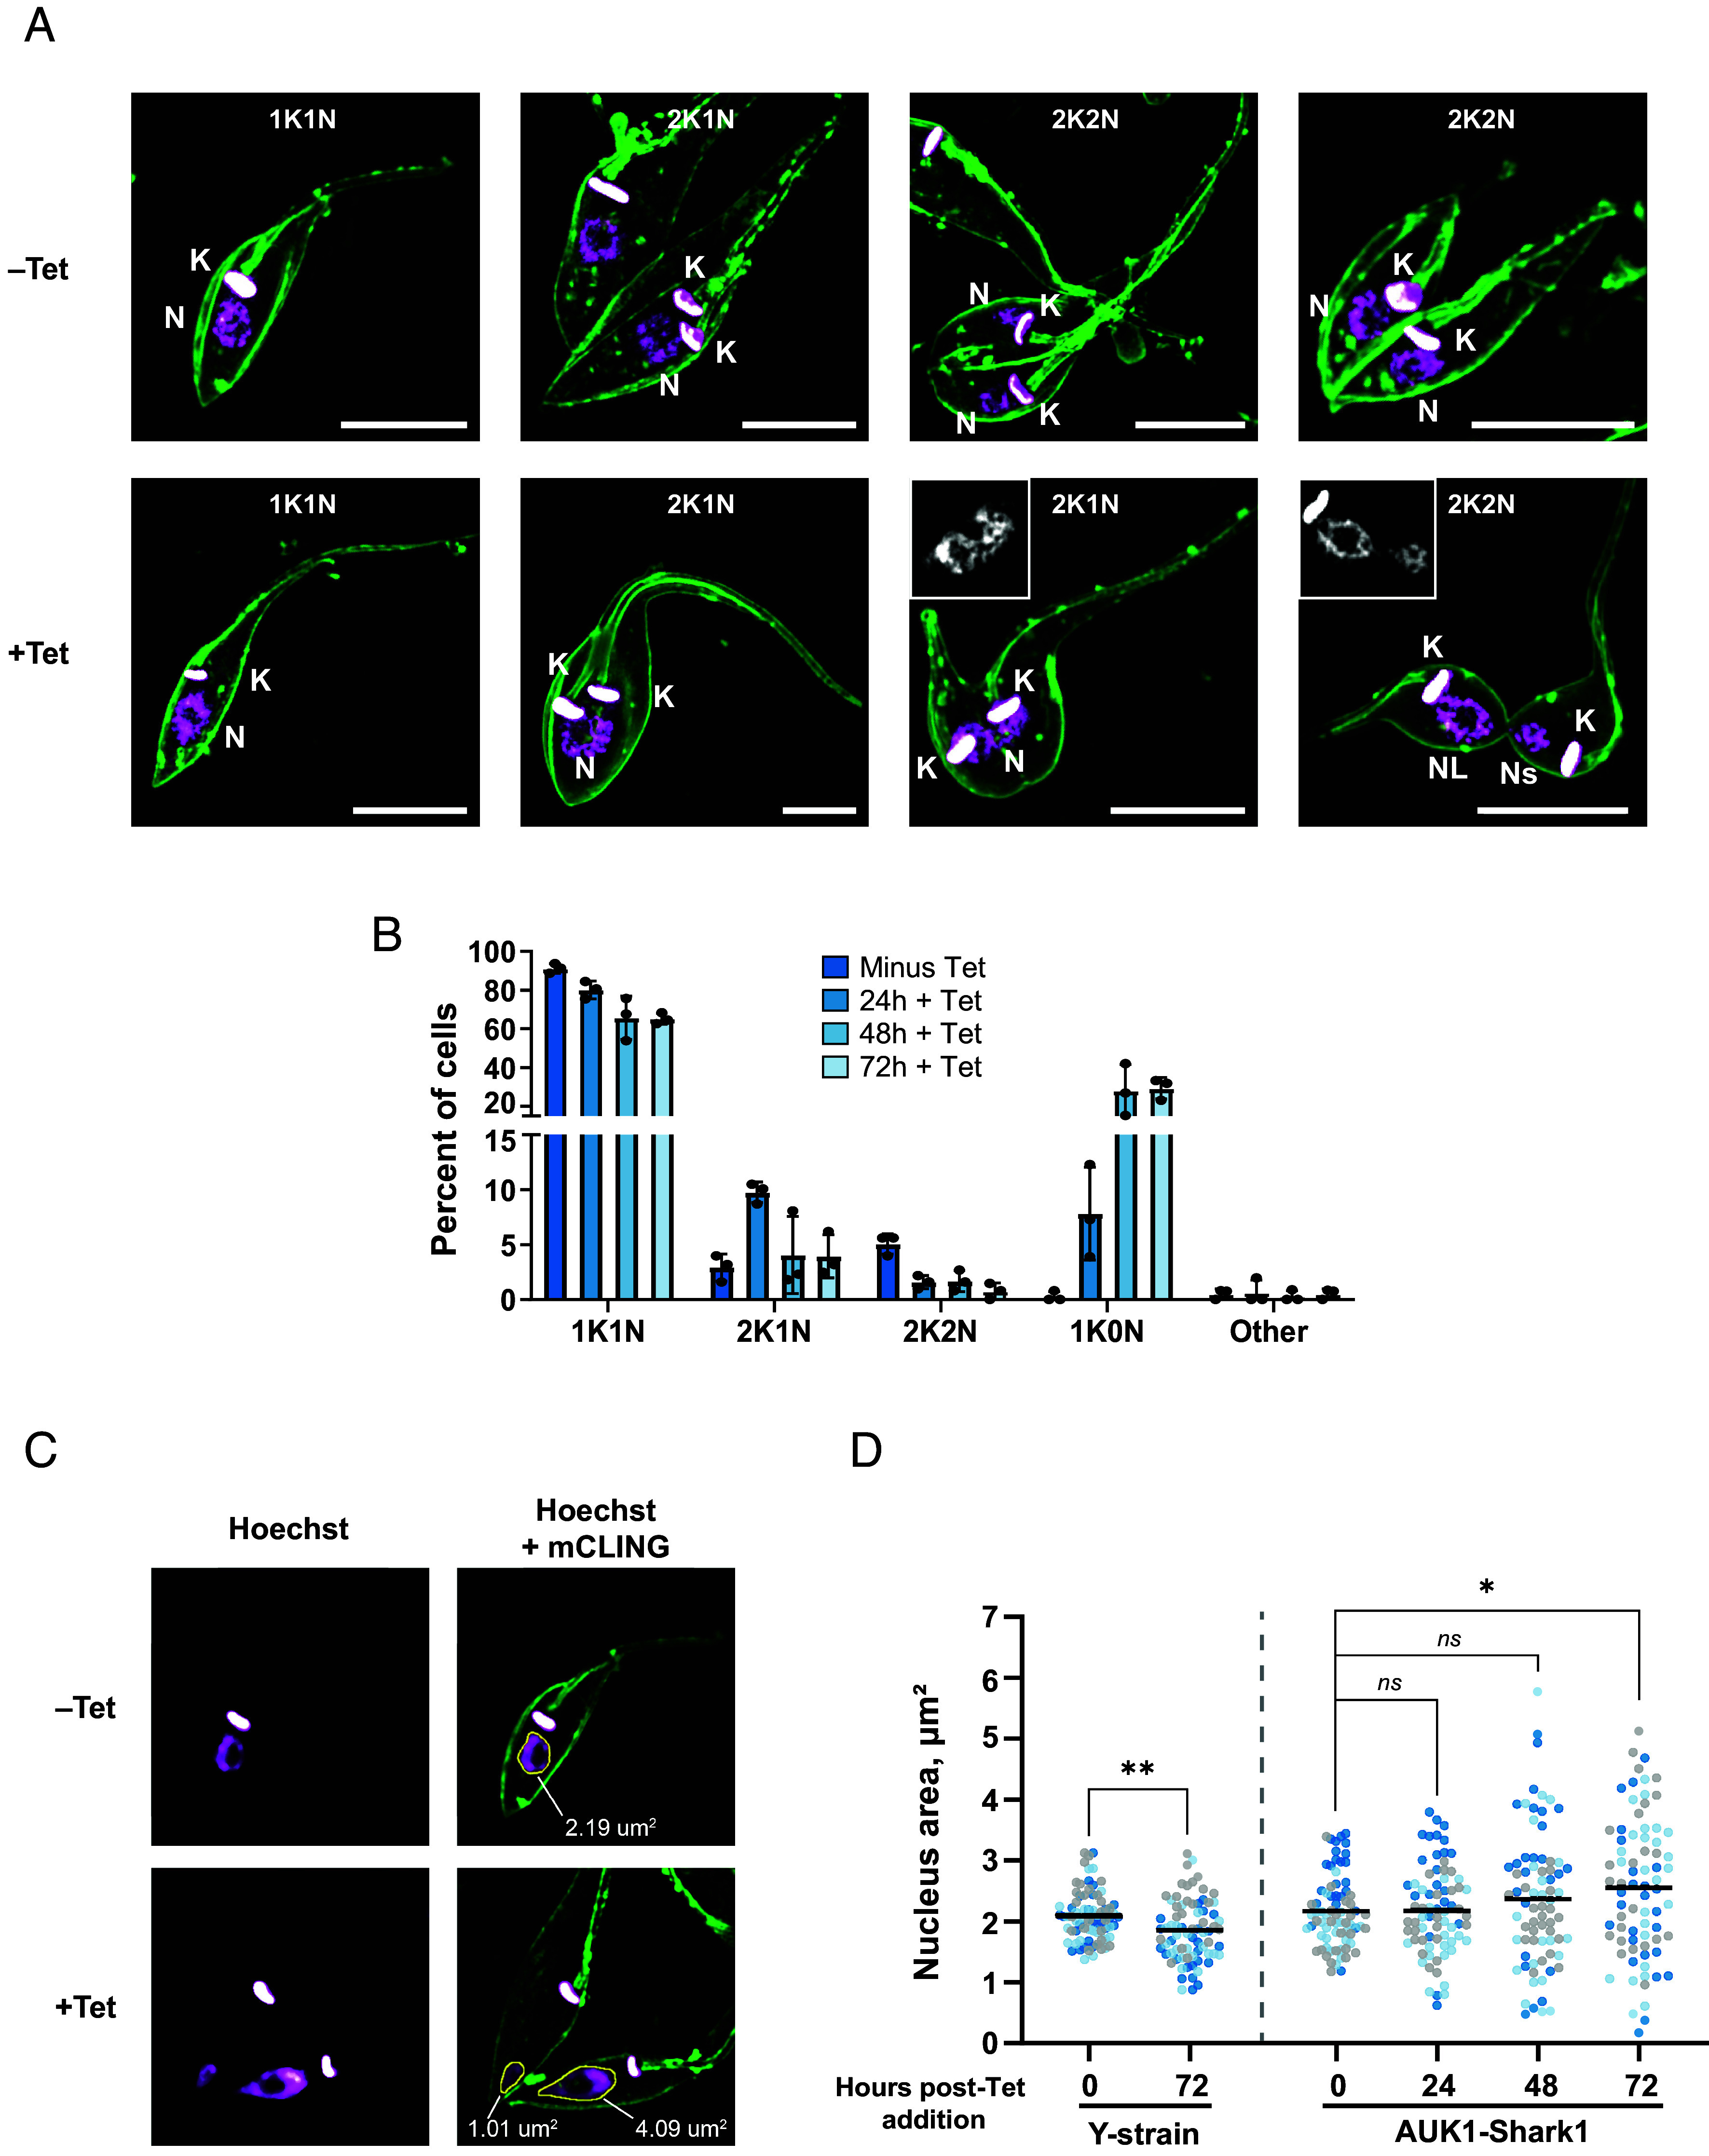
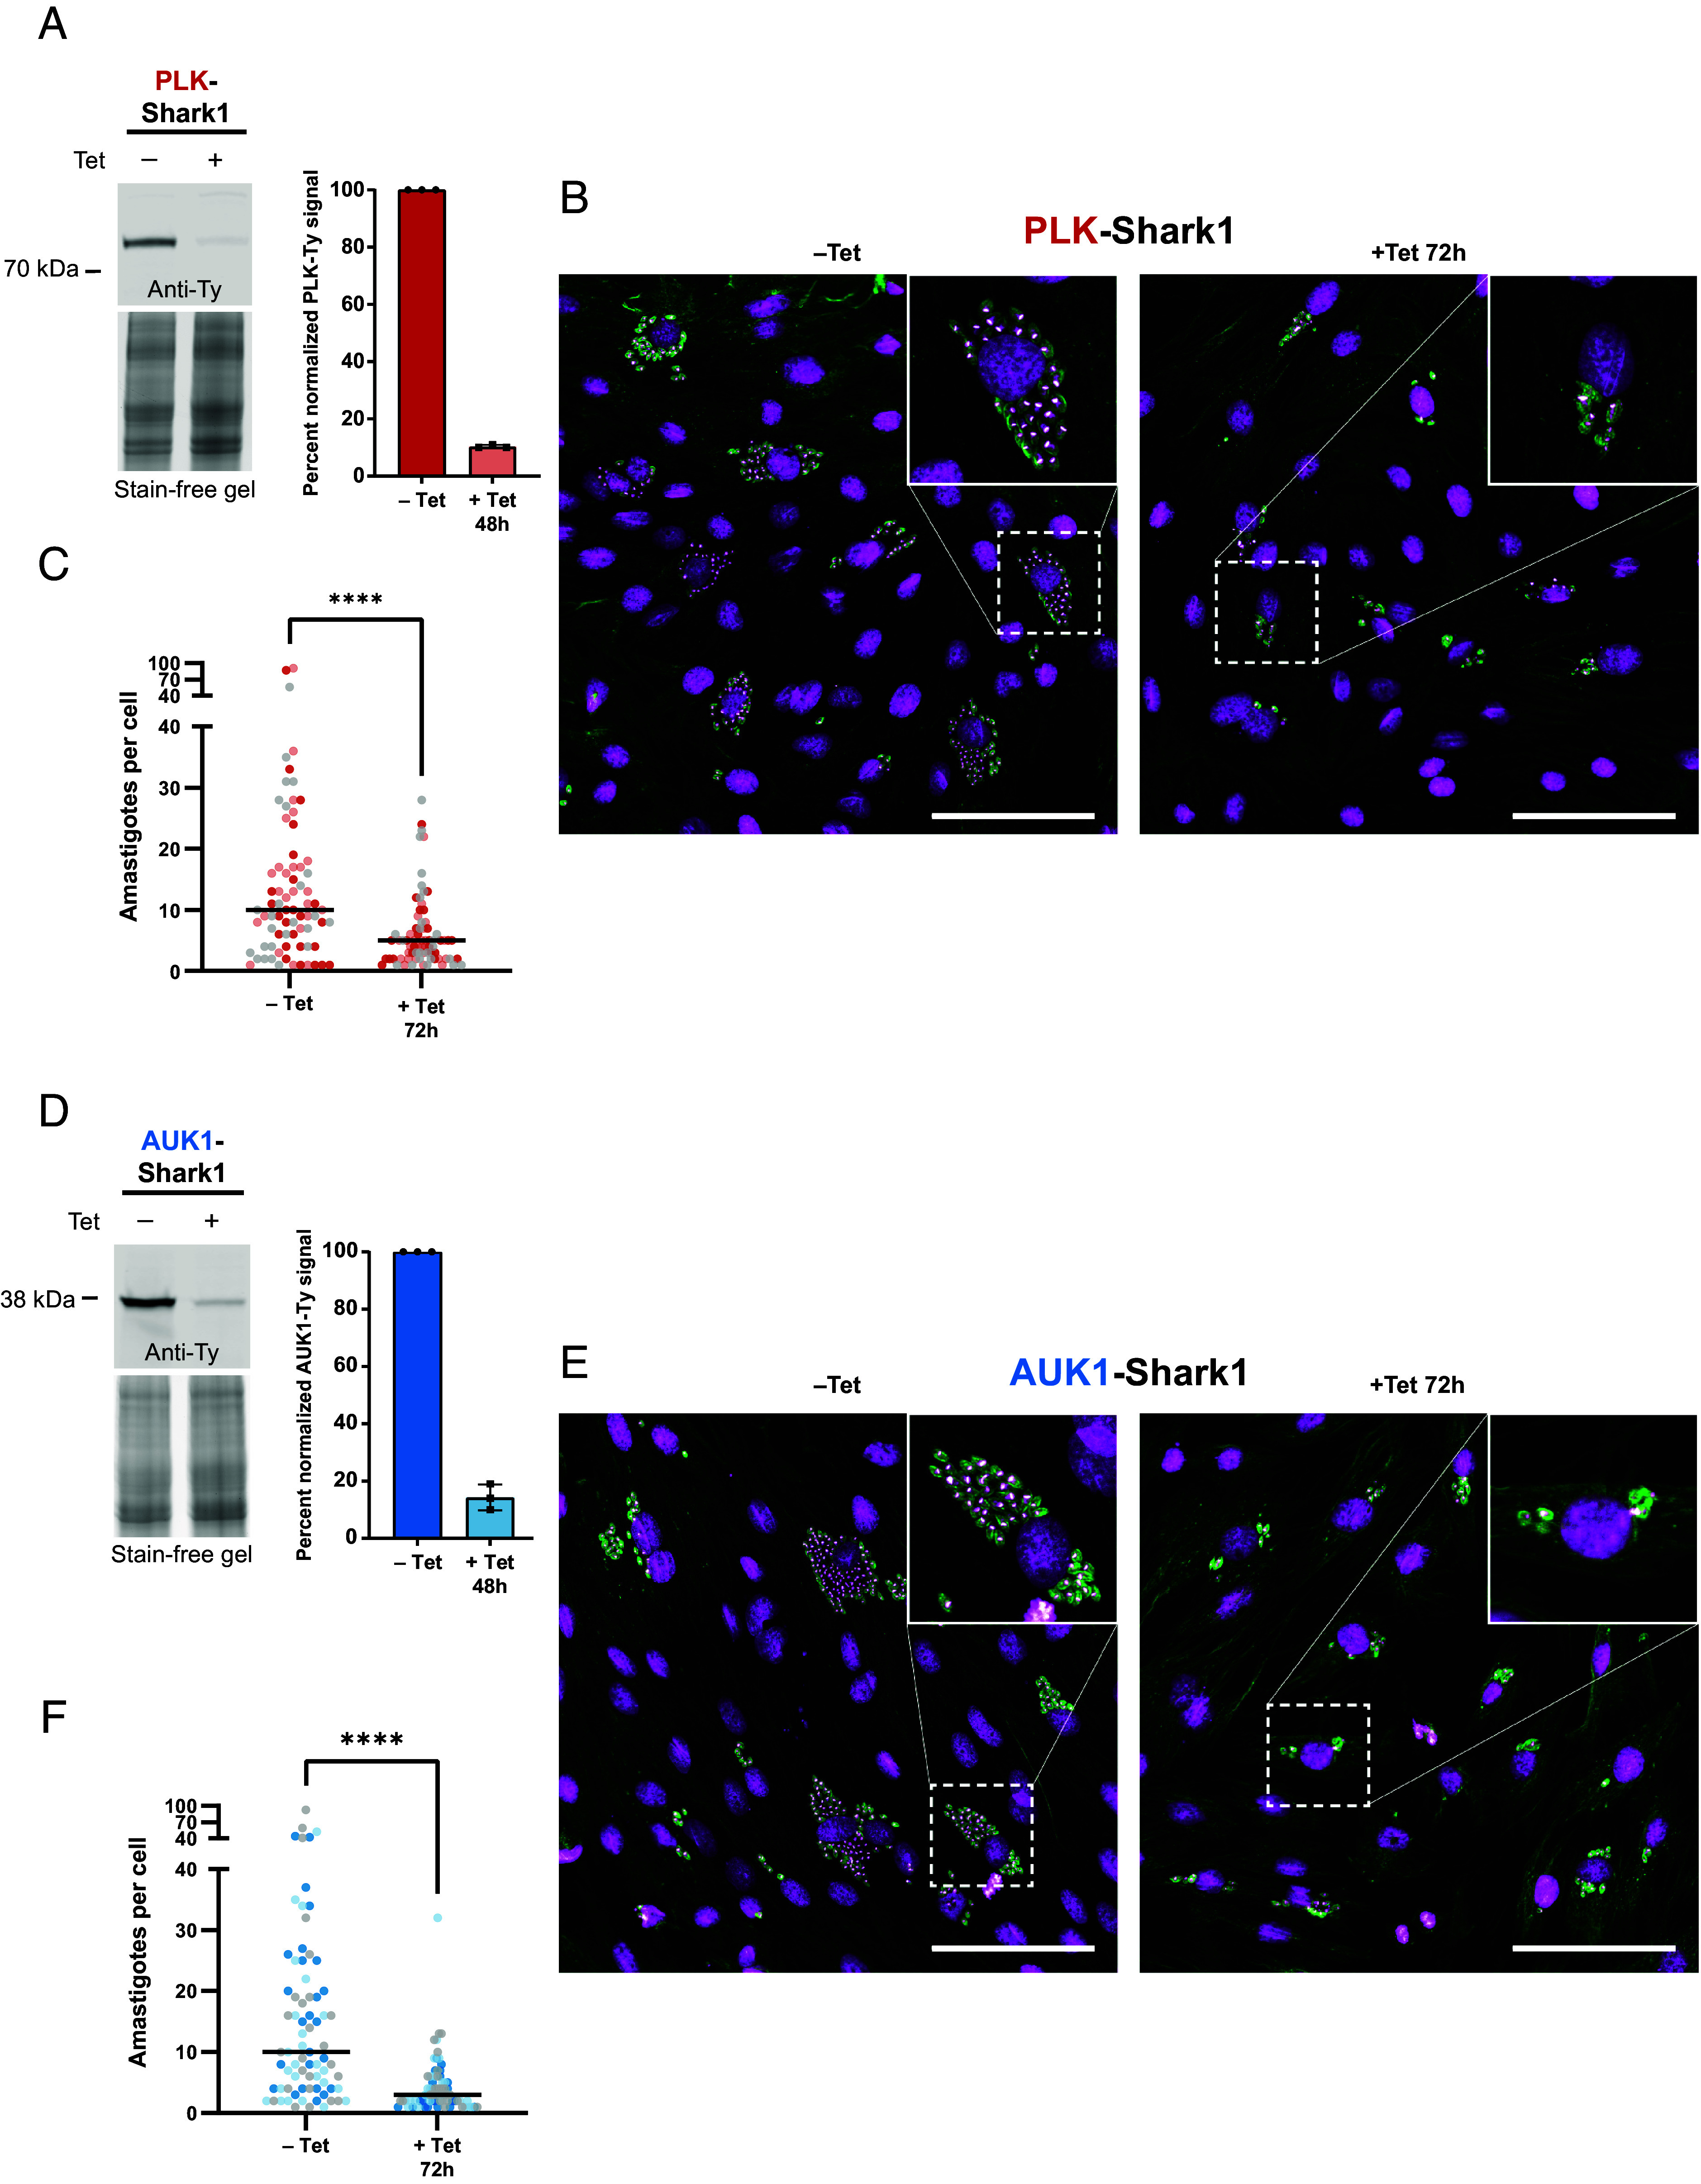
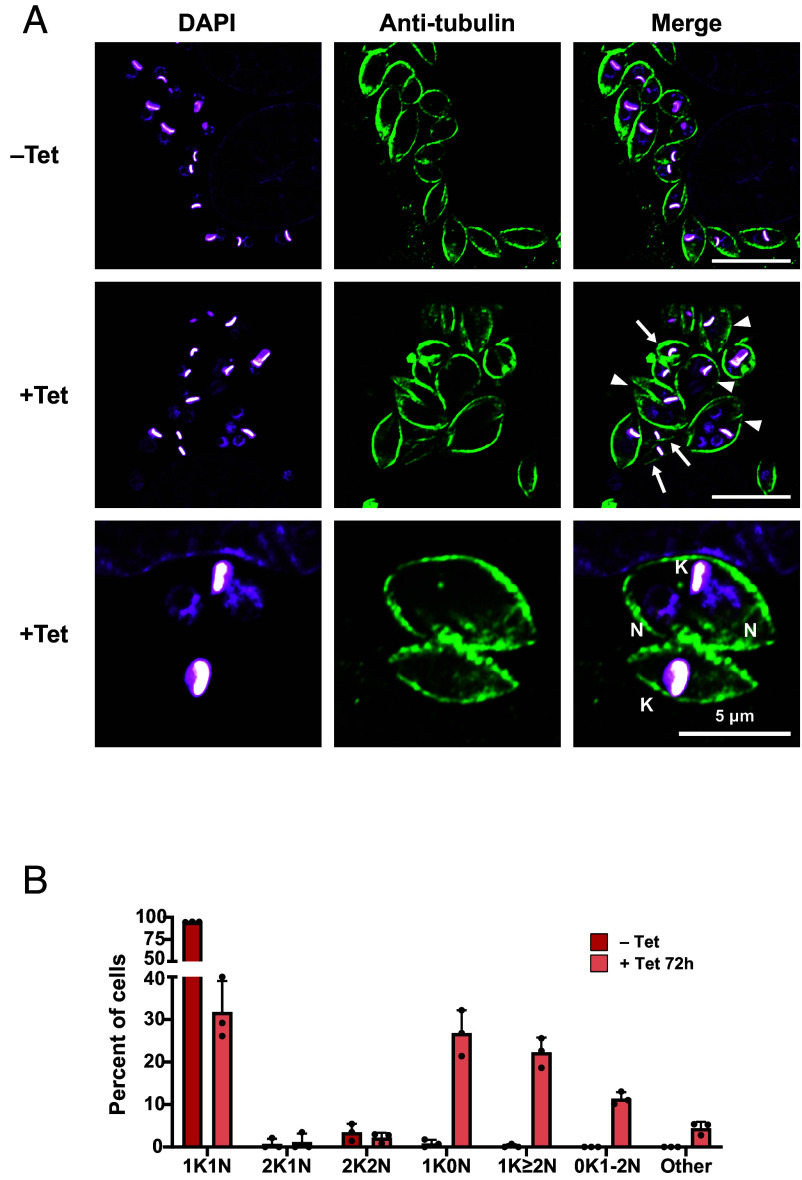
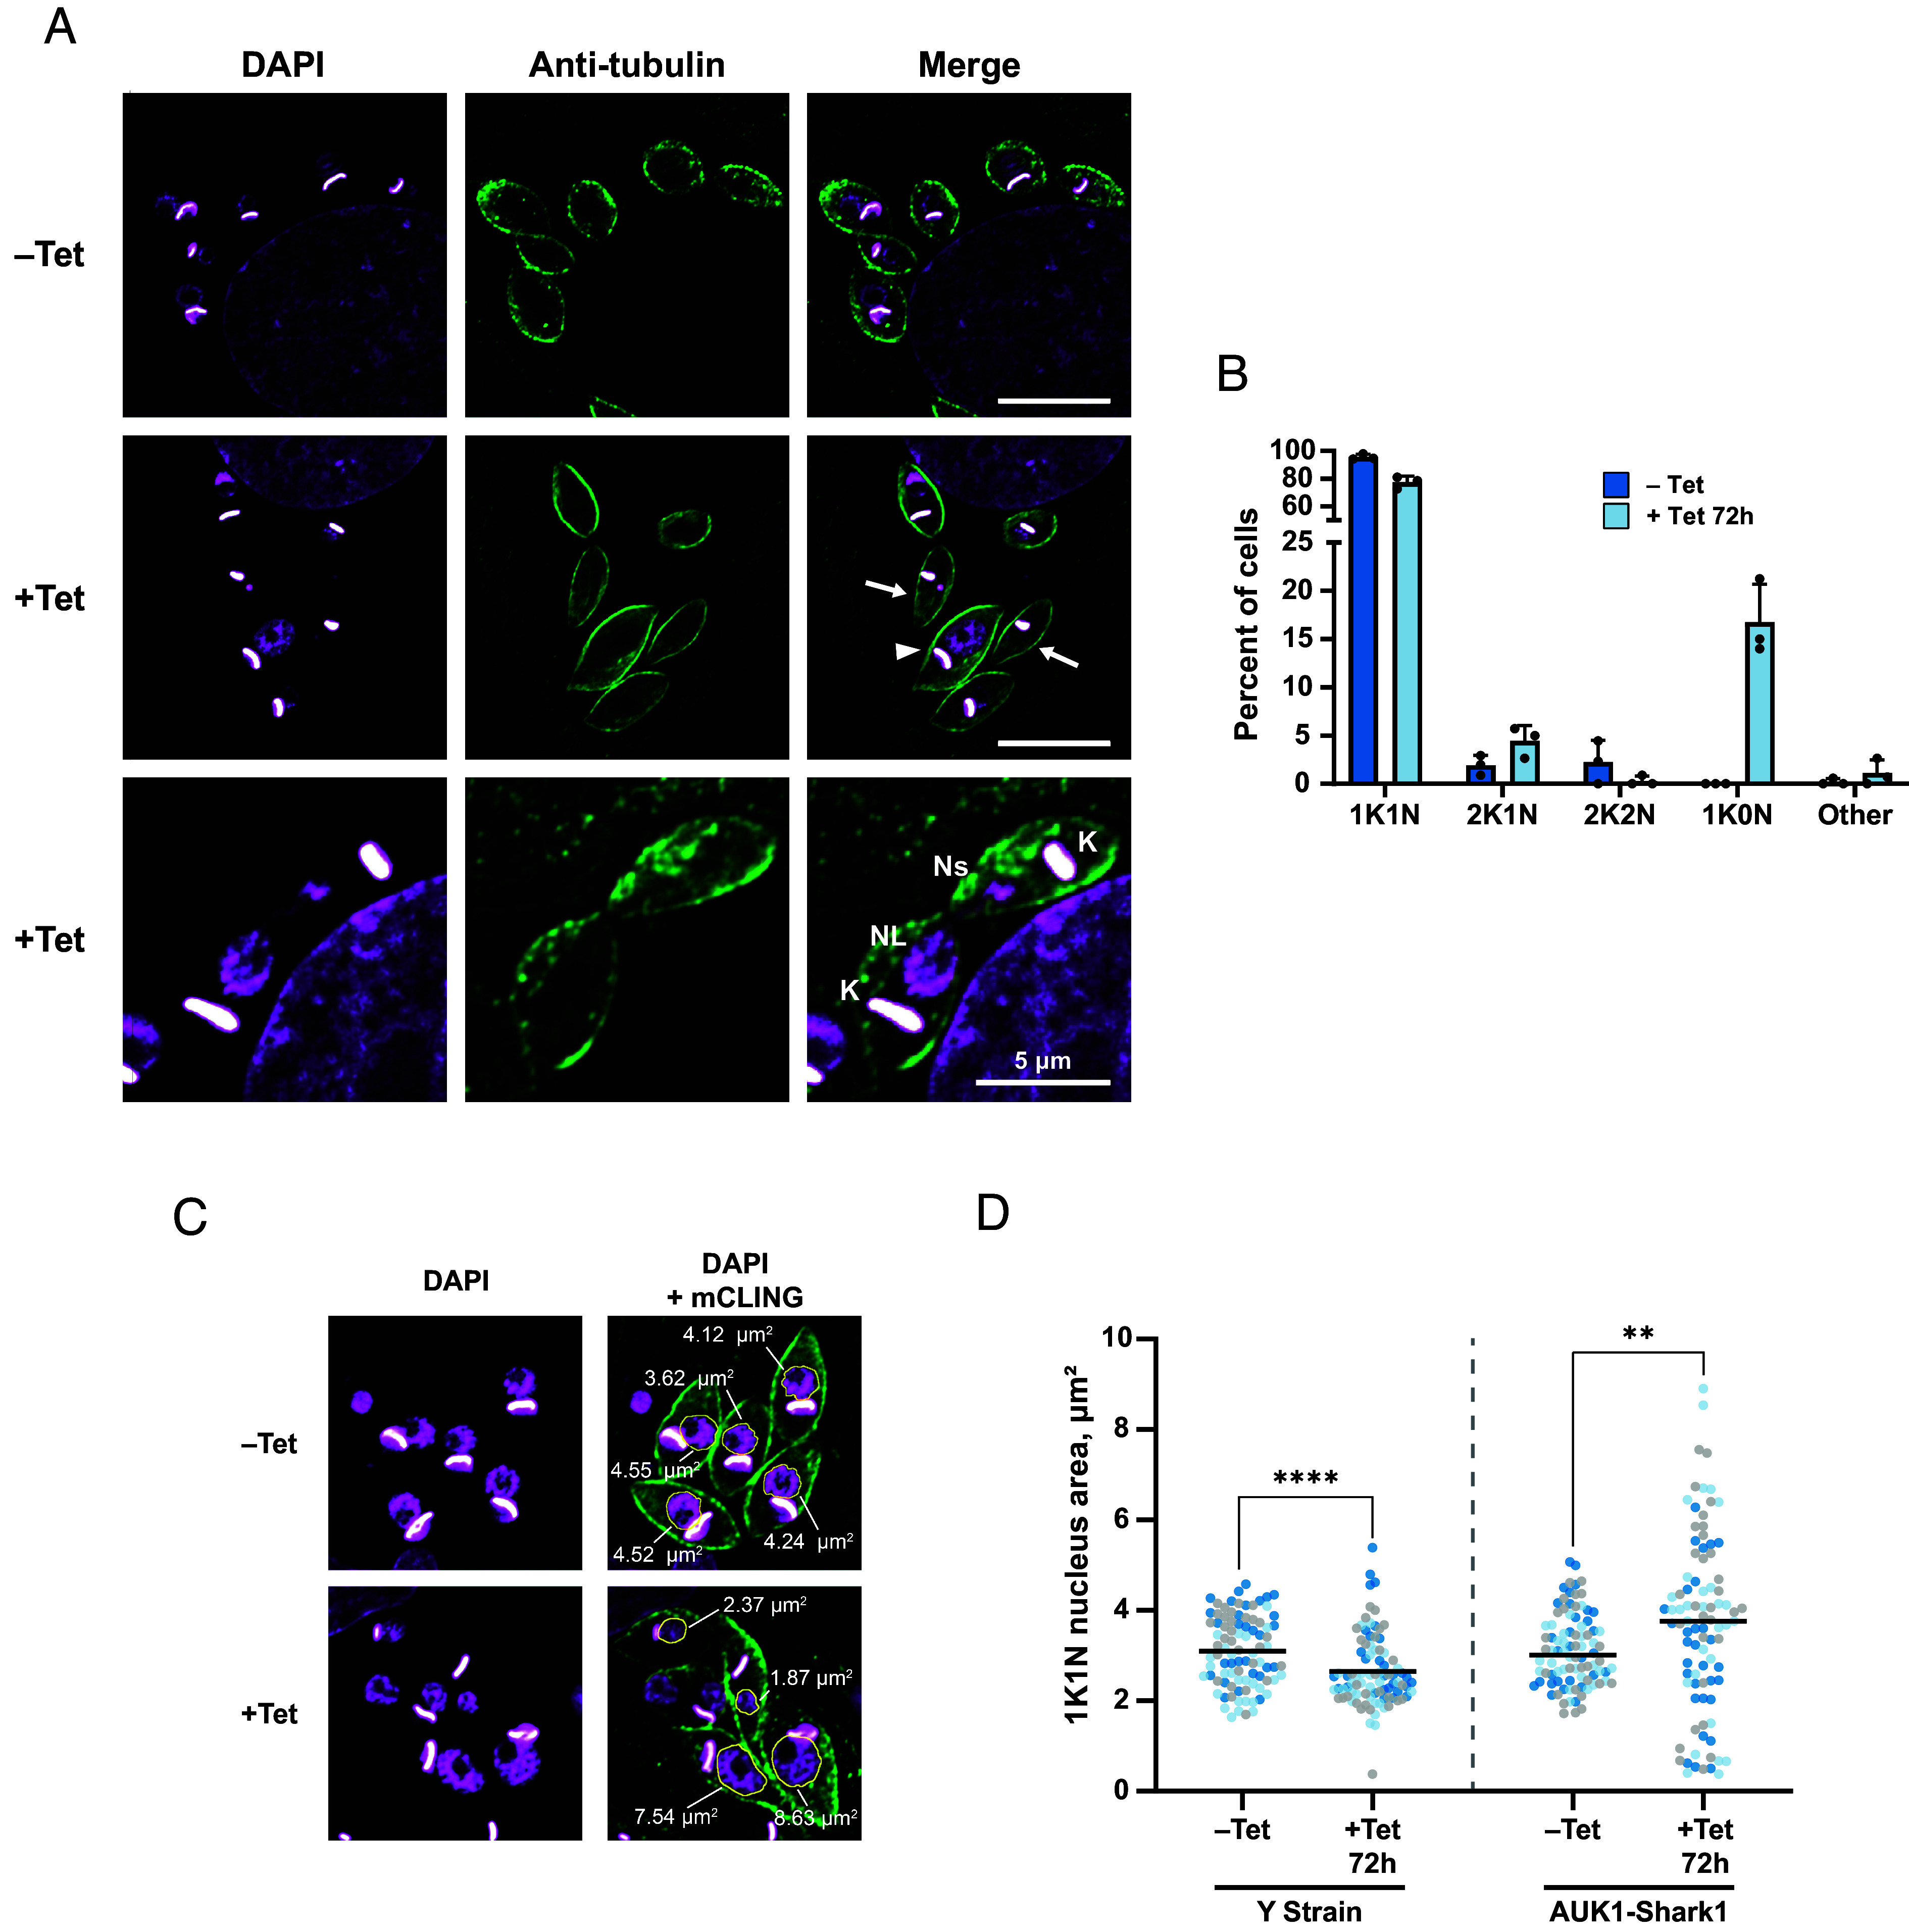
While advances in genome editing technologies have simplified gene disruption in many organisms, the study of essential genes requires development of conditional disruption or knockdown systems that are not available in most organisms. Such is the case for Trypanosoma cruzi, a parasite that causes Chagas disease, a severely neglected tropical disease endemic to Latin America that is often fatal. Our knowledge of the identity of essential genes and their functions in T. cruzi has been severely constrained by historical challenges in very basic genetic manipulation and the absence of RNA interference machinery. Here, we describe the development and use of self-cleaving RNA sequences to conditionally regulate essential gene expression in T. cruzi. Using these tools, we identified essential roles for Polo-like and Aurora kinases in T. cruzi cell division, mirroring their functions in Trypanosoma brucei. Importantly, we demonstrate conditional knockdown of essential genes in intracellular amastigotes, the disease-causing stage of the parasite in its human host. This conditional knockdown system enables the efficient and scalable functional characterization of essential genes in T. cruzi and provides a framework for the development of conditional gene knockdown systems for other nonmodel organisms.

Keywords: Trypanosoma cruzi; aptazyme; conditional knockdown; parasite; protozoan.


Conflict of interest statement

Competing interests statement:The authors declare no competing interest.

Figures

Fig. 1.
Fig. 1.
In vivo selection and optimization of a conditional Tet-responsive aptazyme epitope tag in T. cruzi. (A) Illustration of aptazyme components and in vivo screening and optimization workflow. (Left) An example aptazyme illustrated in the inactive conformation. Modules are labeled and color-coded. Stems I and II are labeled in the catalytic domain module. RNA aptamer stems P2 and P3 are labeled. Aptazyme candidates with different CM sequences were screened for basal expression levels of tagged genes by western blot (SI Appendix, Fig. S1). (Right) Illustration of Tc14, the top performing aptazyme candidate, in the active conformation induced by Tet binding. The red star indicates the approximate site of self-cleavage. The bidirectional red arrow illustrates the interaction between Loop 1 (L1) and Stem 1 (S1) after Tet binding by the RNA aptamer. Expanded circle illustrates specific interactions involving three bases in S1 (U108, C109, and C110, circled and labeled) important for stabilizing the ribozyme in the active conformation. Dotted lines connect bases in L1 and S1 where hydrogen bonding is likely to occur during catalysis. (B) Effect of S1 mutation on Tc14 activity. Tc14 S1 mutants were used to tag PLK, and protein basal expression and knockdown (induced by 5 µg/mL Tet for 72 h) were evaluated in epimastigotes by western blot. Anti-Ty signal was normalized to total protein content. The average of three replicates is presented. Error bars indicate SD. (C) Design of the PCR-generated cassette for Cas9-mediated incorporation of the Tc14-C110A (Shark1) aptazyme and 3x-Ty epitope tag into the 3′ UTR of a gene of interest. PCR primer annealing sites flanking the recombination site are indicated with directional arrows. (D) Diagnostic PCR to identify homozygous epimastigote clones. Primers flanking the recombination site were used to differentiate between wild-type and recombinant loci. Representative PLK-Shark1 and AUK1-Shark1 clonal cell lines are compared to Y-strain (parental) trypanosomes. (E) Expression of 3x-Ty Shark1-tagged PLK and AUK1 genes in representative clonal epimastigotes lines confirmed by western blot. PLK-3x-Ty predicted MW = 85 kDa. AUK1-3x-Ty predicted MW = 38.9 kDa. Stain-free gel illustrates total protein loading before transfer.
Fig. 2.
Fig. 2.
PLK and AUK1 are essential for epimastigote proliferation. (A) Illustration of mRNA degradation after Tet-induced aptazyme cleavage. (BD), PLK analysis. (EG), AUK1 analysis. (B and E) (Left) Representative western blots illustrating the effect of Tet on PLK-Shark1-3x-Ty (B) and AUK1-Shark1-3x-Ty (E) abundance. Epimastigotes were treated with Tet (5 µg/mL) and incubated at 28 °C for the indicated times and processed for western blotting with an anti-Ty antibody. Stain-free gel indicates protein loading before transfer to the membrane. (Right) PLK and AUK1 signal was measured, normalized to total protein content, and plotted as the average percent signal of an untreated control. AU = arbitrary units. Error bars represent SD. (C and F) Effect of Tet treatment on PLK and AUK1 mRNA abundance. Epimastigotes were treated with 5 µg/mL Tet at 28 °C and collected at the indicated time points for quantitative reverse-transcriptase PCR. PLK (C) and AUK1 (F) expression was normalized to the reference gene actin 1 and compared to uninduced controls. Error bars show SD. (D and G) Proliferation time course after PLK (D) and AUK1 (G) knockdown. Epimastigotes from two clonal lines seeded at a density of 2 × 10⁶/mL were incubated for 7 d ± 5 µg/mL Tet at 28 °C. Cell density was measured each day using a Beckman Coulter Counter and diluted periodically with fresh media (±Tet) to maintain log-phase growth. The average cumulative cell density at each time point from three independent experiments is presented. Error bars represent SD. (H) Effect of 5 µg/mL Tet on population doubling times (± 1 SD) in hours. Data from three replicates were analyzed. Rates between – Tet and +Tet samples were compared and P values obtained using Student’s t test.
Fig. 3.
Fig. 3.
PLK is essential for symmetric cytokinesis in epimastigotes. PLK-Shark1 epimastigotes treated with Tet (5 µg/mL) for 24, 48, or 72 h were collected at the indicated time points and stained with mCLING (66) and Hoechst 33342 for microscopic analysis. (A) Example images of trypanosomes before (Top) or after (Bottom) PLK knockdown. The Top row illustrates the typical configuration of kinetoplasts (K) and nuclei (N) in an epimastigote during cytokinesis. The Bottom row highlights trypanosomes with abnormal kinetoplast and nucleus arrangements before, during, and after cytokinesis. The cytokinesis stage and kinetoplast/nucleus configuration of each cell are indicated in each panel. The dashed white line indicates the division plane. (Scale bars, 5 µm.) (B) The number of kinetoplasts and nuclei per cell was determined. The average percent of cells with different K/N configurations from three independent experiments is presented. N > 150 per replicate. (C) Specific K/N configurations comprising the “Abnormal” population from panel B. xKxN = >2K or >2N.
Fig. 4.
Fig. 4.
AUK1 is essential for symmetric mitosis in epimastigotes. AUK1-Shark1 epimastigotes were incubated ±5 µg/mL Tet at 28 °C and collected after 24, 48, or 72 h. Cells were stained with mCLING and Hoechst 33342 prior to microscopic analysis. (A) Representative images of epimastigotes before (–Tet, Top row) and after (+Tet, Bottom row) AUK1 knockdown. Control epimastigotes demonstrating typical numbers and positioning of kinetoplasts (K) and nuclei (N) during the cell division cycle are shown. An S-phase nucleus is visible in a 2K1N cell (Top row, Middle-Left) and after mitosis two nuclei are visible on opposite sides of a cleavage furrow in a 2K2N epimastigote before (Top row, Middle-Right) and after (Top row, Far-Right) initiation of cytokinesis. In +Tet epimastigotes, a pictured 2K1N cell has not completed mitosis but cytokinesis has already been initiated (Bottom row, Middle-Right). The grayscale Inset shows a single-plane image of the Hoechst-stained nucleus. Unequally sized nuclei are present in a 2K2N cell that has nearly completed cytokinesis (Bottom row, far Right). The grayscale Inset shows a single-plane image of the Hoechst-stained nuclei. The K/N configuration of each cell is included in each panel. K = Kinetoplast, N = Nucleus, Ns = small nucleus, NL = large nucleus. (Scale bars, 5 µm.) (B) The number of K and N per cell was determined after AUK1 knockdown at the indicated time points. The average percent of cells with different K/N configurations is presented. N > 150 trypanosomes counted in each of three replicates. “Other” includes 1K2N, 0K1N, and >2K > 2N cells. (C) Example images of nucleus size in 1K1N cells before and after AUK1 knockdown. The nucleus area in 1K1N epimastigotes was measured using ImageJ. A median filter was applied to each image to smooth the periphery of the nucleus and aid in automated detection. (D) Nucleus area measurements in Y-strain (parental) and AUK1-Shark1 epimastigotes. Data points are color-coded according to replicate number. Twenty-five 1K1N trypanosomes were evaluated in each of three replicates. A Mann–Whitney U test was performed to test for statistical significance between samples. For Y-strain 0 h vs. 72 h, P = 1.8 × 10⁻³; for AUK1-Shark1 0 h vs. 24 h, P = 0.798; for AUK1-Shark1 0 h vs. 48 h, P = 0.380; for AUK1-Shark1 0 h vs. 72 h, P = 0.034.
Fig. 5.
Fig. 5.
PLK and AUK1 are essential for amastigote proliferation. (AC) PLK analysis. (DF) AUK1 analysis. (A and D) Tissue culture–derived PLK-Shark1 (A) and AUK1-Shark1 (D) trypomastigotes were used to infect human foreskin fibroblasts (HFFs) for 96 h at 37 °C. Trypomastigotes were washed off and HFF cells were incubated ±5 µg/mL Tet for 48 h at 28 °C. HFF cells were harvested from the tissue culture flask and intracellular amastigotes were released. Host cell debris was removed by filtration and filtered amastigotes were pelleted and subjected to SDS-PAGE and western blot. (Left) Representative western blot showing the effect of Tet on PLK-Ty (A) and AUK1-Ty (D) abundance. Anti-Ty signal was normalized to total protein loading, as determined by stain-free gel. PLK-3x-Ty predicted MW = 85 kDa. AUK1-3x-Ty predicted MW = 38.9 kDa. (Right) Average percent normalized PLK and AUK1 signal before and after knockdown from three biological replicates. Error bars represent SD. (B and E) Representative images of infected cardiomyocytes. Rat cardiomyocytes (H9C2) adhered to glass coverslips were infected with tissue culture–derived trypomastigotes for 24 h at 37 °C. Trypanosomes were washed off and H9C2 cells were incubated ±5 µg/mL Tet for 72 h at 28 °C. Cells were fixed and stained with anti-trypanosome alpha-tubulin 1 (TAT1) antibody and DAPI. Image grids were captured and a gamma correction (0.7) was applied to the DAPI channel to aid in visualization of the trypanosome nucleus. Scale bars indicate 100 µm. (C and F) Amastigotes per cell before and after PLK (C) or AUK1 (F) knockdown. Data points are color-coded according to the replicate. Lines indicate the median number of amastigotes per infected cell (PLK – Tet = 10, PLK + Tet = 5; AUK1 – Tet = 10, AUK1 + Tet = 3). Twenty-five infected cells were evaluated in each replicate. Statistical significance of the difference in distribution of data points between –Tet and +Tet samples was assessed using a Mann–Whitney U test (For PLK P = 0.001 and for AUK1 P = 0.0001).
Fig. 6.
Fig. 6.
PLK is essential for normal cytokinesis in amastigotes. PLK-Shark1 tissue culture–derived trypomastigotes were used to infect rat cardiomyocytes (H9C2) adhered to glass coverslips for 24 h at 37 °C. H9C2 cells were washed to remove trypanosomes and then incubated ±Tet (5 µg/mL) for 72 h at 28 °C. Cells were fixed and stained with TAT1 antibody and DAPI. (A) Example images of amastigotes. The Top row illustrates untreated amastigotes. The Middle row displays amastigotes with abnormal K/N configurations. Arrowheads indicate trypanosomes with 1 kinetoplast and ≥2 nuclei. Arrows indicate trypanosomes without a nucleus. Scale bars for Top and Middle rows = 10 µm. The Bottom row shows an enlarged image of a 1K2N and 1K0N amastigote. (Scale bar, 5 µm.) (B) The number of K and N per amastigote. N ≥ 100 amastigotes from at least five infected host cells per replicate. Three replicates were performed. The average percent K/N configuration type is presented. Other includes 2K > 2N, 0K > 2N, and 3K1N cell types.
Fig. 7.
Fig. 7.
AUK1 is essential for symmetric mitosis in amastigotes. AUK1-Shark1 tissue culture–derived trypomastigotes were incubated with rat cardiomyocytes (H9C2) adhered to glass coverslips at 37 °C for 24 h. Trypomastigotes were removed and H9C2 cells were incubated ±5 µg/mL Tet for 72 h at 28 °C. Cells were fixed and stained with TAT1 antibody and DAPI for microscopic analysis. (A) Example images of amastigotes in the absence (–Tet, Top row) or presence (+Tet, Bottom two rows) of 5 µg/mL Tet. Arrows indicate trypanosomes without a nucleus. The arrowhead indicates an amastigote with an abnormally large nucleus. Scale bars for Top and Middle rows represent 10 µm. The Bottom row illustrates a 2K2N amastigote undergoing cytokinesis before completion of mitosis. The scale bar represents 5 µm. K = kinetoplast, NL = large nucleus, Ns = small nucleus. (B) The number of K and N per amastigote was determined (N > 100 trypanosomes per replicate in each of three replicates). Other includes 1K2N, 0K1N, and 2K0N cells. (C) Example images of 1K1N nucleus size before and after AUK1 knockdown. The nucleus area in 1K1N amastigotes was measured in ImageJ after manually outlining the nucleus. A gamma correction of 0.7 was applied to the DAPI channel to aid in visualizing the nucleus periphery. The area of each nucleus belonging to a 1K1N amastigote is annotated. (D) Nucleus area measurements for 30 1K1N amastigotes in each of three biological replicates. Data points are color-coded according to the replicate number. Lines indicate the mean nucleus area. A Mann–Whitney U test was used to test for a statistical difference between the indicated samples. For Y-strain –Tet vs. +Tet, P < 1 × 10⁻⁴; for AUK1-Shark1 –Tet, vs. +Tet, P = 6.9 × 10⁻³.

Similar articles

Cited by

References

    1. Bern C., Kjos S., Yabsley M. J., Montgomery S. P., Trypanosoma cruzi and Chagas’ disease in the United States. Clin. Microbiol. Rev. 24, 655–681 (2011), 10.1128/CMR.00005-11. - DOI - PMC - PubMed
    1. Factsheet: Chagas disease in the Americas for public health workers - PAHO/WHO|Pan American Health Organization, https://www.paho.org/en/documents/factsheet-chagas-disease-americas-publ.... 27 January 2022. cited 22 May 2024.
    1. Nouvellet P., Dumonteil E., Gourbière S., The improbable transmission of Trypanosoma cruzi to human: The missing link in the dynamics and control of Chagas disease. PLoS Negl. Trop. Dis. 7, e2505 (2013), 10.1371/journal.pntd.0002505. - DOI - PMC - PubMed
    1. Brener Z., Life cycle of Trypanosoma cruzi. Rev. Inst. Med. Trop. Sao Paulo 13, 171–178 (1971). - PubMed
    1. Sturm N. R., Simpson L., Kinetoplast DNA minicircles encode guide RNAs for editing of cytochrome oxidase subunit III mRNA. Cell 61, 879–884 (1990), 10.1016/0092-8674(90)90198-N. - DOI - PubMed

MeSH terms

LinkOut - more resources