. 2025 Mar 21;11(12):eadr1492.
doi: 10.1126/sciadv.adr1492. Epub 2025 Mar 19.

Gene-specific transcript buffering revealed by perturbation of coactivator complexes

Affiliations

Gene-specific transcript buffering revealed by perturbation of coactivator complexes

Faezeh Forouzanfar et al. Sci Adv. .

Abstract

Transcript buffering entails reciprocal modulation of mRNA synthesis and degradation to maintain stable RNA levels under varying cellular conditions. Current models depict a global connection between mRNA synthesis and degradation, but underlying mechanisms remain unclear. Here, we show that changes in RNA metabolism following depletion of TIP60/KAT5, the acetyltransferase subunit of the NuA4 transcriptional coactivator complex, reveal that transcript buffering occurs at a gene-specific level. By combining RNA sequencing of nuclear, cytoplasmic, and newly synthesized transcript fractions with biophysical modeling in mouse embryonic stem cells, we demonstrate that transcriptional changes caused by TIP60 depletion are offset by corresponding changes in RNA nuclear export and cytoplasmic stability, indicating gene-specific buffering. Disruption of the unrelated ATAC coactivator complex also causes gene-specific transcript buffering. We propose that cells dynamically adjust RNA splicing, export, and degradation in response to individual RNA synthesis alterations, thereby sustaining cellular homeostasis.


Figures

Fig. 1.
Fig. 1.. TIP60 is essential for mESCs proliferation.
(A) Tip60AID cells were incubated for the indicated time with either DMSO or 1 mM auxin. TIP60 was detected by Western blotting using HRP-coupled streptavidin. Actin was used as a loading control. A representative Western blot and quantification of three independent replicates (mean and SEM) are shown. (B) Cell number (mean and SEM of n = 3 independent experiments) of the indicated cells treated with DMSO or 1 mM auxin at the indicated times. (C) Bright-field images of cells incubated with DMSO or 1 mM auxin for the indicated times. Scale bar, 40 μm. (D) Cell cycle distribution (mean and SD of three independent experiments) of Tip60AID cells treated with DMSO or auxin for 24 hours, determined by flow cytometry. Cells were grown in FCS + LIF + 2i. a.u., arbitrary unit.
Fig. 2.
Fig. 2.. Role of TIP60 in mRNA synthesis.
(A) Heatmaps of DEGs in Tip60AID cells treated with auxin versus DMSO for 24 hours assessed by RNA-seq. Genes in the heatmaps are sorted from the most up-regulated to the most down-regulated genes. (B) Venn diagrams designating the overlap between DEGs in (A) and TIP60-associated genes (24). (C) Top 10 GO terms (biological process) associated with DEGs in (A), ranked by P value. (D to F) Heatmaps (D), Venn diagrams (E), and GO analysis (F) of differentially transcribed genes assessed by TT-seq. Genes were considered significantly altered if their log2 (FC) was >1 or <−1 and their Benjamini-Hochberg adjusted P value < 0.05 (n = 3 independent experiments).
Fig. 3.
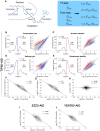
Fig. 3.. Integration of TT-seq and Frac-seq reveals gene-specific transcript buffering.
(A) Schematic of mRNA metabolism, showing transcription (with rate α), splicing (β), export (η), and cytoplasmic degradation (γ). Rates are derived from TT-seq and Frac-seq data (blue box). Labels: U¯lab (unspliced labeled RNA); U¯N, S¯N, and S¯C (unspliced nuclear, spliced nuclear, and spliced cytoplasmic RNA). (B to E) Log2 FCs in transcription (B), splicing (C), nuclear retention (D), and cytoplasmic stability (E) upon TIP60 depletion. Significant genes (log2 FC > |1|, P < 0.01) are shown in red (up-regulated) and blue (down-regulated). Scatter plots show control versus auxin rates. Blue and red dots represent significant up- and down-regulated genes (P < 0.01, log2 FC > |1|). Gene numbers and relative percentages in each category are indicated. (F and G) Correlations between changes in transcription rate and changes in either nuclear retention (F) or cytoplasmic stability (G) upon TIP60 depletion. Dark dots represent genes with a significant FC (P < 0.01). Pearson correlation coefficients are displayed for all the genes (r = −0.72 and r = −0.7) and for significant genes (r = −0.97 and r = −0.97). (H) Log2 FC in transcription versus log2 FC in nuclear to cytoplasmic ratio (NCR). Black dots represent intronless genes. Pearson correlation coefficients are displayed for all the genes (r = −0.039) or intronless genes (r = −0.13). (I and J) Correlation between the log2 FC in transcription rate and the log2 FC in RNA stability after depletion of the ATAC subunit Zzz3 (I) or Yeats2 (J). Dark dots represent genes with a significant FC (P < 0.05). Pearson correlation coefficients are displayed for all the genes (r = −0.61 and r = −0.57) and for significant genes (r = −0.8 and r = −0.82).
Fig. 4.
Fig. 4.. Buffering efficiency for Tip60 target and nontarget genes.
Correlation between changes in transcription and nuclear retention (A and D), cytoplasmic stability (B and E), and N/C ratio (C and F) after TIP60 depletion as in Fig. 3 (F to H), for putative TIP60 target and nontarget genes. Changes in total RNA levels are color-coded as indicated.
Fig. 5.
Fig. 5.. Gene-specific transcript buffering in response to transcription coactivator perturbations.
This schematic illustrates the interplay between transcription coactivator perturbations (e.g., TIP60 or ATAC complex depletion) and RNA homeostasis. Perturbations lead to alterations in mRNA synthesis, which are counterbalanced by changes in mRNA export and cytoplasmic decay of specific transcripts, thereby maintaining RNA homeostasis.

Update of

Similar articles

Cited by

References

    1. Baptista T., Grünberg S., Minoungou N., Koster M. J. E., Timmers H. T. M., Hahn S., Devys D., Tora L., SAGA is a general cofactor for RNA polymerase II transcription. Mol. Cell 68, 130–143.e5 (2017). - PMC - PubMed
    1. Sun M., Schwalb B., Schulz D., Pirkl N., Etzold S., Larivière L., Maier K. C., Seizl M., Tresch A., Cramer P., Comparative dynamic transcriptome analysis (cDTA) reveals mutual feedback between mRNA synthesis and degradation. Genome Res. 22, 1350–1359 (2012). - PMC - PubMed
    1. Warfield L., Ramachandran S., Baptista T., Devys D., Tora L., Hahn S., Transcription of nearly all yeast RNA polymerase II-transcribed genes is dependent on transcription factor TFIID. Mol. Cell 68, 118–129.e5 (2017). - PMC - PubMed
    1. Berry S., Müller M., Rai A., Pelkmans L., Feedback from nuclear RNA on transcription promotes robust RNA concentration homeostasis in human cells. Cell Syst. 13, 454–470.e15 (2022). - PubMed
    1. Helenius K., Yang Y., Tselykh T. V., Pessa H. K. J., Frilander M. J., Mäkelä T. P., Requirement of TFIIH kinase subunit Mat1 for RNA Pol II C-terminal domain Ser5 phosphorylation, transcription and mRNA turnover. Nucleic Acids Res. 39, 5025–5035 (2011). - PMC - PubMed

LinkOut - more resources