. 2025 Mar 21;11(12):eads8351.
doi: 10.1126/sciadv.ads8351. Epub 2025 Mar 19.

Genome-wide CRISPR screen identifies IRF1 and TFAP4 as transcriptional regulators of Galectin-9 in T cell acute lymphoblastic leukemia

Affiliations

Genome-wide CRISPR screen identifies IRF1 and TFAP4 as transcriptional regulators of Galectin-9 in T cell acute lymphoblastic leukemia

Caroline R M Wiggers et al. Sci Adv. .

Abstract

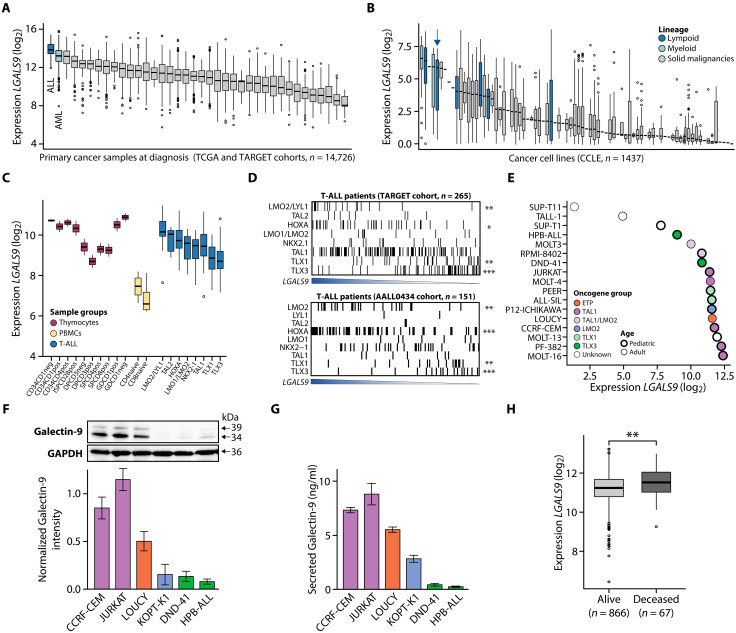
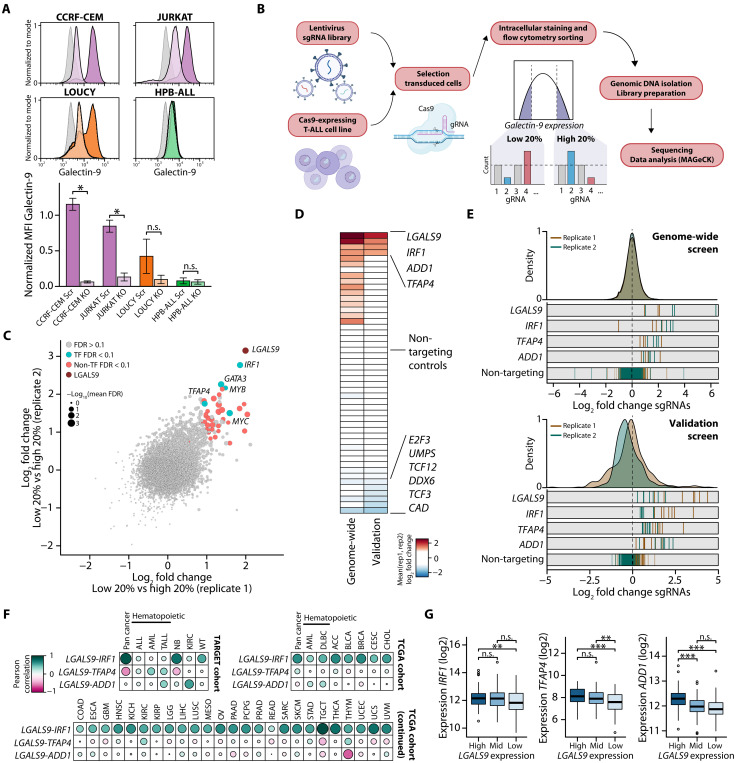
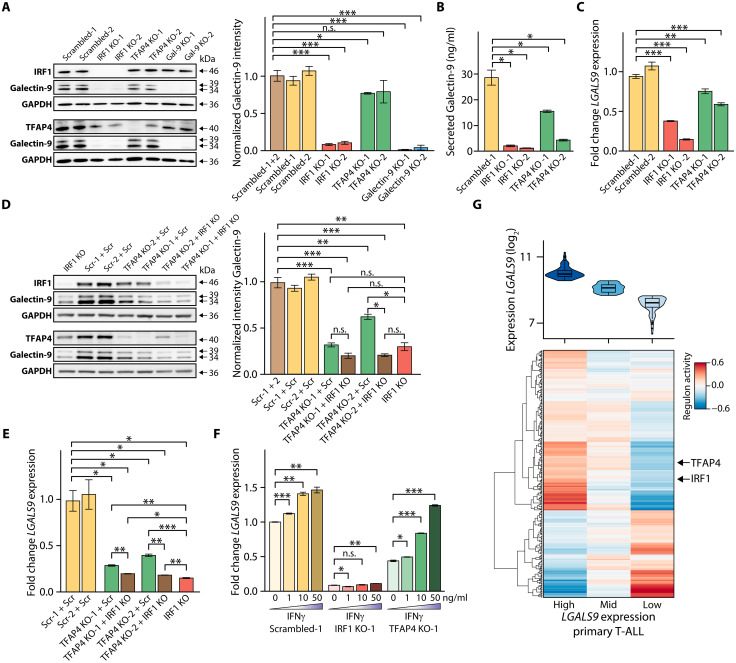
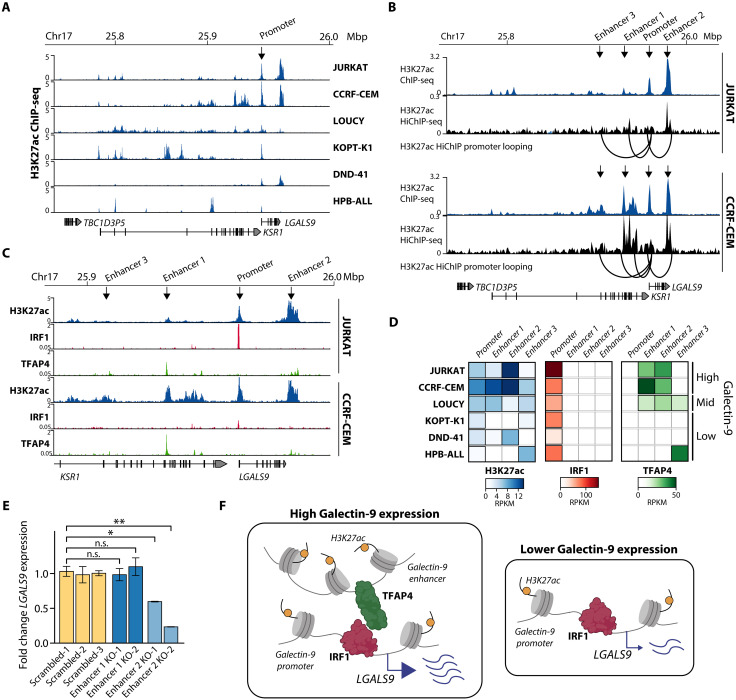
Galectin-9 is overexpressed in a variety of cancers and associated with worse clinical outcome in some cancers. However, the regulators driving Galectin-9 expression are unknown. Here, we defined the transcriptional regulators and epigenetic circuitry of Galectin-9 in pediatric T cell acute lymphoblastic leukemia (T-ALL), as an example of a disease with strong Galectin-9 expression, in which higher expression was associated with lower overall survival. By performing a genome-wide CRISPR screen, we identified the transcription factors IRF1 and TFAP4 as key regulators for Galectin-9 expression by binding its regulatory elements. Whereas IRF1 was observed exclusively on the promoter, TFAP4 binding was detected at an enhancer solely in T-ALL cells associated with higher Galectin-9 levels. Together, our results show that IRF1 is responsible and indispensable for Galectin-9 expression and TFAP4 further fine-tunes its expression. Our approach, a flow-based genome-wide CRISPR screen complemented by transcription factor binding and enhancer mapping, creates innovative opportunities for understanding and manipulating epigenetic transcriptional regulation in cancer.


Figures

Fig. 1.
Fig. 1.. Heterogeneous Galectin-9 expression in pediatric T-ALL.
(A) Boxplots depicting log2 LGALS9 expression (normalized count RSEM+1) in primary hematological and solid cancer samples at diagnosis in the TCGA and TARGET cohorts analyzed using the UCSC Xena platform (n = 14,726) (20). (B) Boxplots depicting log2 LGALS9 expression (TPM+1) in hematological (colored in blue; T-ALL depicted by blue arrow) and solid (gray) cancer cell lines from the CCLE database (24Q2; n = 1437) (21). (C) Boxplots depicting log2 LGALS9 expression (normalized DESeq2 counts+1) in healthy donor thymocytes at several differentiation stages [red, GSE151079 (64, 65)], healthy donor peripheral blood CD4+ and CD8+ T cells [yellow, GSE107011 (66)], and in primary pediatric T-ALL patient samples at diagnosis (blue, TARGET cohort) split by T-ALL oncogenic subgroup. (D) Heatmap depicting oncogenic T-ALL subgroups of primary T-ALL samples sorted by LGALS9 expression in two independent cohorts [top: TARGET (n = 265); bottom: AALL0434 (n = 151)]. Samples were split in tertiles based on LGALS9 expression, and a Fisher exact test was used to assess enrichment of oncogenic subtypes in LGALS9 high versus low expressing T-ALL groups. *P < 0.05; **P < 0.01; ***P < 0.001. (E) Log2 LGALS9 expression (normalized DESeq2 counts+1) in T-ALL cell lines [CCLE (21)] color coded by T-ALL subtype annotated by Squiban et al. (67). (F) Western blot quantification of Galectin-9 total protein levels in six T-ALL cell lines. Error bars indicate SEM of triplicates, and one representative Western blot is shown. Intensities were normalized to GAPDH and to average intensities of CCRF-CEM and Jurkat cell lines. (G) Bar plot showing secreted Galectin-9 in cell culture supernatant after 2 days of culture in six T-ALL cell lines assessed by ELISA. Error bars indicate SEM of triplicates. (H) Boxplot depicting LGALS9 expression in pediatric patients with T-ALL from the AALL0434 cohort split by clinical outcome. **P < 0.01 (unpaired t test).
Fig. 2.
Fig. 2.. Genome-wide CRISPR screen for Galectin-9 regulators in T-ALL.
(A) Flow cytometry analysis of Galectin-9 expression in Jurkat, CCRF-CEM, Loucy, and HPB-ALL scrambled (Scr) and Galectin-9 KO T-ALL cell lines. Representative flow plots are shown (top), and the mean fluorescence intensity (MFI) was calculated of duplicate experiments (bottom) and normalized to the average MFI of Jurkat and CCRF-CEM scrambled control cell lines. A t test was used for statistical analysis. *P < 0.05; n.s., not significant. (B) Schematic overview of the genome-wide CRISPR screen for Galectin-9 in T-ALL cell line Jurkat. Created in BioRender. B.Y. (2025) https://BioRender.com/n03l034. (C) Scatterplot showing log2 fold changes of 20% low versus 20% high expressing Jurkat cells in the genome-wide CRISPR screen assessed by MAGeCK. Dot size indicates −log10 of the mean FDR of both replicates of a one-sided significance test using a negative binomial model by the MAGeCK algorithm (23). (D) Heatmap depicting the log2 fold change of 20% low versus 20% high Galectin-9 expressing Jurkat cells in the CRISPR genome-wide and validation screen. Only significant hits of the genome-wide screen and nontargeting controls were included and shown. (E) Log2 fold changes of sgRNA abundance of significant hits IRF1, TFAP4, and ADD1 and positive control LGALS9 in the genome-wide CRISPR screen (top) and validation CRISPR screen (bottom). (F) Pearson correlation of IRF1, TFAP4, and ADD1 expression with LGALS9 expression in the TCGA and TARGET cohorts [UCSC Xena platform (n = 14,726) (20)]. See table S1 for abbreviations of cancer types and the number of patients. (G) Boxplots depicting log2 IRF1, TFAP4, and ADD1 expression (normalized DESeq2 counts+1) in primary T-ALL (TARGET cohort, n = 265) split by low, mid, and high LGALS9 expression. An unpaired t test was used for statistical analysis. **P < 0.01; ***P < 0.001; n.s., not significant.
Fig. 3.
Fig. 3.. TFs IRF1 and TFAP4 regulate Galectin-9 expression.
(A) Western blot quantification in single-cell–derived CRISPR KO clones in Jurkat T-ALL cells. Intensities were normalized to GAPDH and scrambled controls. Error bars indicate SEM of duplicates for which Western blots are shown. Data of scrambled 1+2 represent both scrambled controls together. (B) Bar plot showing Galectin-9 concentration secreted in cell culture supernatant after 2 days of culture in Jurkat scrambled control, IRF1 KO, and TFAP4 KO cell lines. Error bars indicate SEM of triplicates. (C) Bar plot depicting fold change of LGALS9 expression assessed by RT-qPCR compared to scrambled control in Jurkat scrambled, IRF1 KO, and TFAP4 KO cell lines. Error bars indicate SEM of triplicates. (D and E) Western blot (WB) quantification (D) and fold change of LGALS9 expression assessed by RT-qPCR (E) of IRF1-TFAP4 dual KO Jurkat cells. Single-cell–derived scrambled or TFAP4 KO cell lines were subjected to CRISPR editing of IRF1 and scrambled gRNAs. A bulk IRF1 KO sample was taken along as well and note order TFAP4 KO2/1 in WB. WB intensities were normalized to GAPDH and scrambled controls. Error bars indicate SEM of duplicates (D) or triplicates (E). Data of scrambled 1+2 represent both scrambled controls together. (F) Bar plot depicting fold change of LGALS9 expression assessed by RT-qPCR of Jurkat cells treated with a range of IFN-γ for 48 hours. Expression was normalized to vehicle-treated scrambled control. Error bars indicate SEM of triplicates. (G) Heatmap depicting TF activity analysis [RScenic (25)] in primary pediatric T-ALL patient samples from the TARGET cohort (n = 265). Samples were equally split in LGALS9 high, mid, and low expressing groups. See table S2 for other regulons in the same hierarchical cluster as IRF1 and TFAP4. An unpaired t test was used for all statistical analysis. *P < 0.05; **P < 0.01; ***P < 0.001; n.s., not significant.
Fig. 4.
Fig. 4.. IRF1 and TFAP4 bind regulatory DNA elements of LGALS9.
(A) H3K27ac enrichment in the LGALS9 locus analyzed by ChIP-seq experiments in T-ALL cell lines. (B) Chromatin looping analyzed by H3K27ac HiChIP-seq experiments in Jurkat and CCRF-CEM cells. Only chromatin looping from the LGALS9 promoter is shown, and three enhancers detected in both cell lines are indicated by an arrow. (C) H3K27ac, IRF1, and TFAP4 enrichment in the LGALS9 locus analyzed by ChIP-seq experiments in Jurkat and CCRF-CEM cells. (D) Heatmap depicting H3K27ac (left), IRF1 (middle), and TFAP4 (right) enrichment on the LGALS9 promoter and three identified enhancers. Faint gray outline indicates that this region is not peak called in the respective sample. (E) Bar plot depicting fold change of LGALS9 expression assessed by RT-qPCR compared to scrambled control in single clone–derived CRISPR-edited Jurkat cells upon a 150-bp deletion in enhancer 1, a 1.6-kb deletion in enhancer 2, or scrambled controls. Error bars indicate SEM of triplicates, and an unpaired t test was used for statistical analysis; *P < 0.05; **P < 0.01; n.s., not significant. (F) Schematic summary of the transcriptional regulation of LGALS9 expression. Created in BioRender. B.Y. (2025) https://BioRender.com/a56h547.

Similar articles

References

    1. Wada J., Kanwar Y. S., Identification and characterization of Galectin-9, a novel β-galactoside-binding mammalian lectin. J. Biol. Chem. 272, 6078–6086 (1997). - PubMed
    1. Yang R.-Y., Rabinovich G. A., Liu F.-T., Galectins: Structure, function and therapeutic potential. Expert Rev. Mol. Med. 10, e17 (2008). - PubMed
    1. Kapetanakis N.-I., Busson P., Galectins as pivotal components in oncogenesis and immune exclusion in human malignancies. Front. Immunol. 14, 1145268 (2023). - PMC - PubMed
    1. Zhang M., Liu C., Li Y., Li H., Zhang W., Liu J., Wang L., Sun C., Galectin-9 in cancer therapy: From immune checkpoint ligand to promising therapeutic target. Front. Cell Dev. Biol. 11, 1332205 (2024). - PMC - PubMed
    1. Yang R., Sun L., Li C.-F., Wang Y.-H., Yao J., Li H., Yan M., Chang W.-C., Hsu J.-M., Cha J.-H., Hsu J. L., Chou C.-W., Sun X., Deng Y., Chou C.-K., Yu D., Hung M.-C., Galectin-9 interacts with PD-1 and TIM-3 to regulate T cell death and is a target for cancer immunotherapy. Nat. Commun. 12, 832 (2021). - PMC - PubMed

MeSH terms