. 2025 May;246(3):1032-1048.
doi: 10.1111/nph.70060. Epub 2025 Mar 19.

In a nutshell: pistachio genome and kernel development

Affiliations

In a nutshell: pistachio genome and kernel development

Jaclyn A Adaskaveg et al. New Phytol. 2025 May.

Abstract

Pistachio is a sustainable nut crop with exceptional climate resilience and nutritional value. However, the molecular processes underlying pistachio nut development and nutritional traits are largely unknown, compounded by limited genomic and molecular resources. To advance pistachios as a future food source and a model system for hard-shelled fruits, we generated a chromosome-scale reference genome of the most widely grown pistachio cultivar (Pistacia vera 'Kerman') and a spatiotemporal study of nut development. We integrated tissue-level physiological data from thousands of nuts over three growing seasons with transcriptomic data encompassing 14 developmental time points of the hull, shell, and kernel to assemble gene modules associated with physiological changes. Our study defined four distinct stages of pistachio nut growth and maturation. We then focused on the kernel to identify transcriptional and metabolic changes in molecular pathways governing nutritional quality, such as the accumulation of unsaturated fatty acids, which are vital for shelf life and dietary value. These findings revealed key candidate conserved regulatory genes, such as PvAP2-WRI1 and PvNFYB-LEC1, likely involved in oil accumulation in kernels. This work yields new knowledge and resources that will inform other woody crops and facilitate further improvement of pistachio as a globally significant, sustainable, and nutritious crop.

Keywords: Kerman; Pistacia vera; chromosome‐scale assembly; kernel metabolic profile; nut development; nut physiology; pistachio; reference genome; spatiotemporal transcriptome; tree crop.


Conflict of interest statement

None declared.

Figures
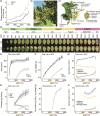
Fig. 1
Fig. 1
Pistachio nut development is categorized into four distinct stages. (a) Comparison of United States (US) pistachio (Pistacia vera) production to the world in the past 60 years (Food and Agricultural Organization; https://www.fao.org/faostat/en/#search/pistachio). Pistachios (‘Kerman’) at Stage III on a tree (b) and a branch, (c) with nut and kernel anatomy. (d) Pistachio development (whole nut, halved nut, and kernel) assessed from April to September 2019 in California and categorized into four stages represented by calendar time and accumulated heat units expressed as growing degree days (GDD) in °C. Bar, 1 cm. The new stages were defined by assessing (e) whole nut and kernel area growth (mm2), (f) dry weight (g) of the whole nut and kernel, (g) color changes in the hull measured in the L*a*b* color space (L*, or lightness, a* or redness, and b* or yellowness), (h) texture changes in the hull, shell, and kernel (kg of Force), (i) fat content in the kernel (g 100 g−1 dry weight), and (j) kernel color changes measured in the L*a*b* color space. (e–j) Lines show fitted linear and linear mixed polynomial models as a function of heat accumulation (GDD). Error bars indicate SD from the means. (e–j) The stages are represented in a bar with distinct colors below the x‐axes. Stage I, light green; Stage II, green; Stage III, yellow; Stage IV, pink.
Fig. 2
Fig. 2
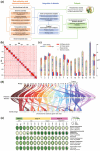
Chromosome‐scale genome assembly of Pistacia vera ‘Kerman’ offers new genetic resources and tools. (a) Overview of current study workflow, including data collection, integration of datasets, and outputs. (b) Heat map of the Omni‐C interaction density among 15 chromosomes. The red color indicates the intensity of interactions between genomic regions. Green and blue lines are contigs and chromosomes, respectively. (c) Ideogram with protein‐coding gene and repeat density in 1‐Mb window size on 15 chromosomes of the ‘Kerman’ genome. Protein‐coding gene density is represented in each chromosome in heatmap style, and repeat density is plotted to the right side of each chromosome in red. The density of long terminal repeat retrotransposons (LTR‐RTs) Ty3/Gypsy and Ty1/copia are shown on the left side of each chromosome in normal and dotted lines, respectively. The scale bar for chromosome size is indicated on the right. (d) Macrosynteny analysis of the ‘Kerman’ 15 chromosomes compared with the mango and sweet orange genomes. (e) Tissue‐specific RNA‐seq expression of genes highly expressed unique to pistachio nuts identified by comparison of Iso‐seq collapsed isoforms demonstrating differential expression patterns across tissues. CDS, coding sequence.
Fig. 3
Fig. 3
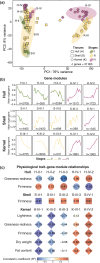
Gene co‐expression patterns confirm pistachio (Pistacia vera ‘Kerman’) developmental stages. (a) Principal component analysis of total gene expression (normalized reads) for all samples, marked by stage (color) and tissue (shape). Then, a weighted gene co‐expression network analysis was conducted for each tissue and produced modules of genes with similar expression patterns. (b) Gene modules were selected with high correlations to physiological traits and categorized by stage according to the time points in which expression was elevated (mean eigengene value) in each tissue type (H‐hull, S‐shell, or K‐kernel) and at specific developmental stages (II, III, or IV) for each module (1–X). Each module graph indicates the mean eigengene value at each time point along the x‐axis. Gray dashed lines indicate the transitions between stages along the x‐axis. Colors of lines correspond to the stages each module is categorized as (green as II, yellow as III, and magenta as IV). All gene modules can be found in Supporting Information Table S13. (c) Correlation using Pearson's product–moment correlation coefficient between the expression profiles (module eigengene values) of the selected modules and the physiological trait data. Correlations R 2 > 0.7 with significance P < 0.01 are shown for each tissue. The intensity of the color indicates the strength of the correlation (R 2), and the shape of the icon indicates the tissue type.
Fig. 4
Fig. 4
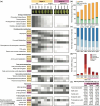
Pistachio (Pistacia vera ‘Kerman’) kernels display conserved patterns of seed development and unique metabolite fluctuations. (a) Summary of selected significantly enriched (P adj < 0.05 determined by Fisher's exact test) gene functions (e.g. Gene Ontology (GO), Kyoto Encyclopedia of Genes and Genomes, iTAK) in modules highly correlated to relevant kernel traits (all enrichments can be found in Supporting Information Table S13). The sum of gene expression (i.e. normalized reads) at each time point in a given module is shown for enriched (P adj < 0.05) functions. Metabolite profiles to confirm the gene expression trends across kernel development were obtained for (b) carbohydrates, starch, and proteins; (c) fatty acids, including monounsaturated fatty acid, polyunsaturated fatty acid, and saturated fatty acid; (d) monoterpene volatiles relevant to flavor; (e) phenolic compounds contributing to flavor and nutrition. Phenolics are reported as mg g−1 dry weight and as a percentage of the total amount. Metabolites are reported as averages across kernel samples (n = 3–4). The time points of kernel development correspond to the growing degree days (GDD, in °C) at collection.
Fig. 5
Fig. 5
Fatty acid biosynthesis and potential regulators in pistachio (Pistacia vera ‘Kerman’) kernel development. (a) Expression pattern (in normalized reads) of transcription factors LEAFY‐COTYLEDON1 (PvNFYB‐LEC1; PvKer.12.g280410) and WRINKLED1 (PvAP2‐WRI1; PvKer.03.g083330) involved in seed development and fatty acid accumulation across timepoints represented in growing degree days (GDD, in °C). The corresponding stages are colored below in yellow (Stage III) and pink (Stage IV). The module each gene is a member of is indicated in each graph of (a). (b) Predicted 3D structure of P. vera ‘Kerman’ PvAP2‐WRI1 protein. Colors indicate the folding confidence level as labeled on the right bottom. (c) Relative location of previously reported WRI1 AW‐Box binding motifs found in ‘Kerman’ fatty acid biosynthesis (dark blue) and K‐III‐1 module genes (light blue) compared with other genes that contained the same binding motif. The consensus sequence of the AW‐Box binding motif is shown as a logo. (d) A representation of fatty acid biosynthesis pathways based on Kyoto Encyclopedia of Genes and Genomes pathways (www.genome.jp/kegg/pathway.html, last accessed December 2023). Dashed lines indicate that some steps were omitted. The gene expression levels (i.e. log10 of the mean normalized read count for each sampling) are represented in colored boxes on a white‐blue scale with each box representing a sampling point from Stage III and Stage IV determined GDD and each row representing homologous genes of a specific step in the pathway. Samplings for gene expression include dates from 1223 to 2564 GDD. Colored circles represent the accumulation of specific fatty acid compounds. Colors (white‐red scale) indicate the relative accumulation of a specific metabolite at each time point, and the size of each circle represents the amount of the metabolite, measured in percentages of total fat (%). Six time points from Stage III (1357, 1647, and 1881 GDD) and Stage IV (2139, 2475, and 2564 GDD) were used for all fatty acid data shown. Fatty acid genes containing the WRI1 AW‐box or LEC1 CCAAT target sequences are indicated by a star or diamond shape, respectively. ACA, acetyl‐CoA carboxylase; FAB2, acyl‐[acyl‐carrier‐protein] desaturase; fabD, S‐malonyltransferase; fabF, 3‐oxoacyl‐[acyl‐carrier‐protein] synthase II; fabG, 3‐oxoacyl‐[acyl‐carrier protein] reductase; fabH, 3‐oxoacyl‐[acyl‐carrier‐protein] synthase III; fabI, enoyl‐[acyl‐carrier protein] reductase I; fabZ, 3‐hydroxyacyl‐[acyl‐carrier‐protein] dehydratase; FAD2, omega‐6 fatty acid desaturase; FAD3, acyl‐lipid omega‐3 desaturase; FATA, fatty acyl‐ACP thioesterase A; FATB, fatty acyl‐ACP thioesterase B.

Similar articles

References

    1. Alonge M, Lebeigle L, Kirsche M, Jenike K, Ou S, Aganezov S, Wang X, Lippman ZB, Schatz MC, Soyk S. 2022. Automated assembly scaffolding using RagTag elevates a new tomato system for high‐throughput genome editing. Genome Biology 23: 258. - PMC - PubMed
    1. Andrews S. 2010. fastqc: a quality control tool for high throughput sequence data. http://www.bioinformatics.babraham.ac.uk/projects/fastqc
    1. Bates D, Mächler M, Bolker B, Walker S. 2015. Fitting linear mixed‐effects models Usinglme4. Journal of Statistical Software 67: 1–48.
    1. Benjamini Y, Hochberg Y. 1995. Controlling the false discovery rate: a practical and powerful approach to multiple testing. Journal of the Royal Statistical Society. Series B, Statistical Methodology 57: 289–300.
    1. Benny J, Giovino A, Marra FP, Balan B, Martinelli F, Caruso T, Marchese A. 2021. Transcriptomic analysis of the Pistacia vera (L.) fruits enable the identification of genes and hormone‐related gene linked to inflorescence bud abscission. Genes 13: 60. - PMC - PubMed