. 2025 Jun;155(6):1938-1951.
doi: 10.1016/j.tjnut.2025.02.025. Epub 2025 Mar 17.

The Association of Prenatal Dietary Factors with Child Autism Diagnosis and Autism-Related Traits Using a Mixtures Approach: Results from the Environmental Influences on Child Health Outcomes Cohort

Collaborators, Affiliations

The Association of Prenatal Dietary Factors with Child Autism Diagnosis and Autism-Related Traits Using a Mixtures Approach: Results from the Environmental Influences on Child Health Outcomes Cohort

Megan G Bragg et al. J Nutr. 2025 Jun.

Abstract

Background: Previous research on the role of maternal diet in relation to autism has focused on examining individual nutrient associations. Few studies have examined associations with multiple nutrients using mixtures approaches, which may better reflect true exposure scenarios.

Objectives: This study aims to examine associations of nutrient mixtures with children's autism diagnosis and trait scores within a large, diverse population.

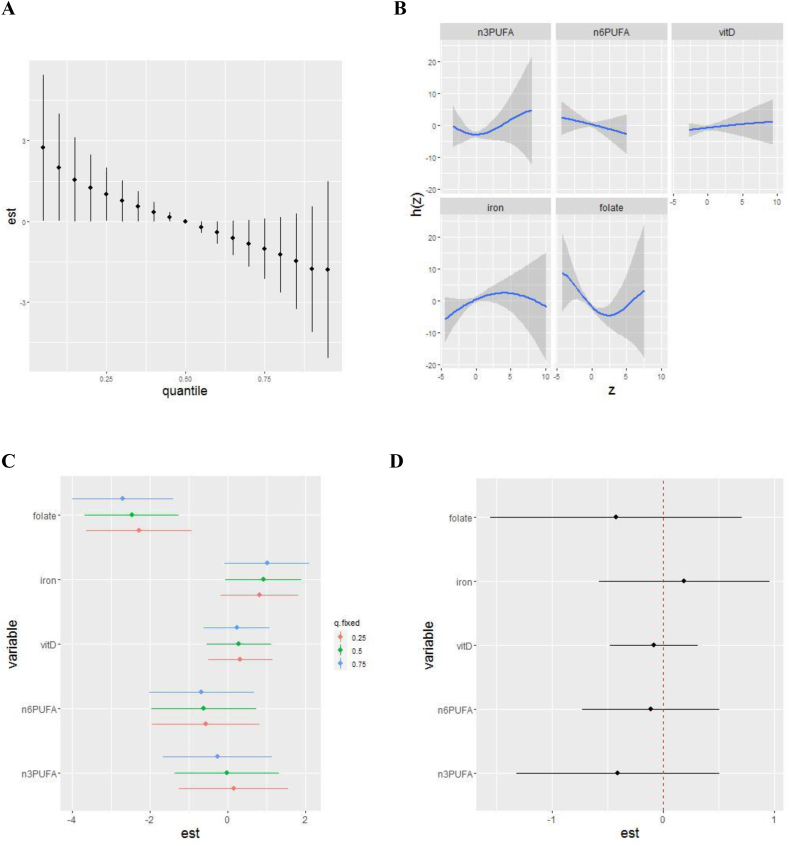
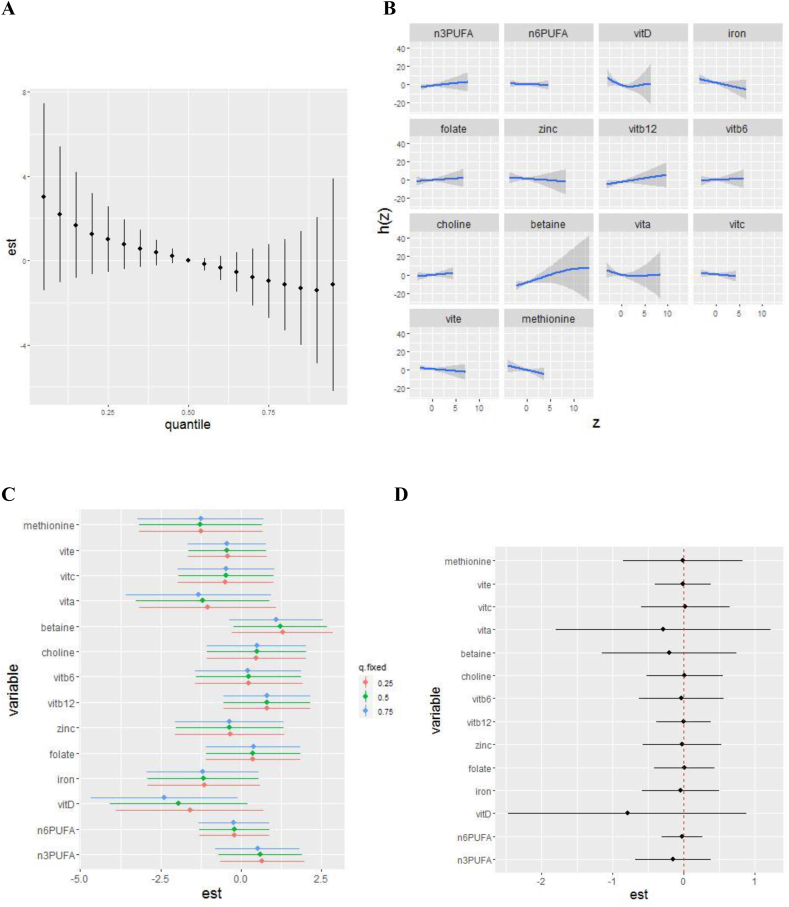
Methods: Participants were drawn from the United States Environmental influences on Child Health Outcomes (ECHO) consortium. Maternal prenatal diet was reported via validated food frequency questionnaires. Children's autism-related traits were measured using the Social Responsiveness Scale (SRS) and autism diagnoses were from parent reports of physician diagnosis. Bayesian kernel machine regression was used to examine the overall mixture effect and interactions between a set of 5 primary nutrients (folate, vitamin D, omega 3 and omega 6 fatty acids, and iron), adjusted for potential confounders, in relationship to child outcomes. Secondary analyses were conducted in a subset of cohorts with an expanded set of 14 nutrients. Traditional linear and logistic regression models were also analyzed for comparison of results to mixture models.

Results: A total of 2614 participants drawn from 7 ECHO cohorts were included in primary analysis. Mixture analyses suggested that increasing the overall 5-nutrient mixture was associated with lower SRS scores. Individual U-shaped associations and bivariate interactions between folate and omega 3 fatty acids were suggested. In the subset included in the secondary analyses of the 14-nutrient mixture, a modest inverse trend remained, but individual nutrient associations were altered, with vitamin D demonstrating higher relative importance than other nutrients. Strong associations with autism diagnosis were not observed.

Conclusions: In this large sample, we found evidence for combined nutrient effects with broader autism-related traits. Because results for individual nutrients were sensitive to mixture components, replication of combined associations between nutrients and autism-related outcomes is needed.

Keywords: autism; epidemiology; neurodevelopment; nutrients; statistical mixtures methods.


Conflict of interest statement

Conflict of interest The content is solely the responsibility of the authors and does not necessarily represent the official views of the National Institutes of Health. The authors report no conflicts of interest.

Figures

FIGURE 1
FIGURE 1
Adjusted associations between prenatal intake of 5 nutrients and child SRS scores using hierarchical BKMR (n = 2614). Results of Bayesian kernel machine regression (BKMR) analyses in ECHO including energy-adjusted nutrient intake for omega 3 and omega 6 fatty acids, iron, vitamin D, and folate, adjusted for maternal age, maternal prepregnancy BMI, child sex (male and female), cohort type (enriched familial autism probability and general population), maternal ethnicity/race (non-Hispanic White, non-Hispanic Black, Hispanic, and other), maternal education (less than high school, high school/GED, some college/associates degree/trade school, bachelor’s degree, and graduate degree), maternal smoking (yes and no), and child year of birth (1998–2004, 2005–2009, 2010–2014, and 2015+). Plots show: (A) the overall mixture effect, or the relationship between the nutrient mixture and child SRS scores. (B) Individual nutrient associations with SRS scores, holding all other nutrients at their 50th percentile. (C) Single-exposure effects; plot shows the impact on a child SRS score when each exposure increases from its 25th to 75th percentile (whereas other exposures are fixed at their 25th, 50th, or 75th percentiles). (D) Interaction parameters; plot compares the single-exposure health risk of each exposure (associated with a change from its 25th to 75th percentile) when other exposures are fixed to their 75th percentile compared with their 25th percentile. The primary set of nutrients included here was selected as described in the text based on a priori interest for neurodevelopmental relevance and grouped by shared pathway. ECHO, Environmental influences on Child Health Outcomes; SRS, Social Responsiveness Scale.
FIGURE 2
FIGURE 2
Adjusted bivariate associations between prenatal intake of 5 nutrients and child SRS scores using hierarchical Bayesian kernel machine regression (BKMR) (n = 2614). Results of BKMR analyses in ECHO including energy-adjusted nutrient intake for omega 3 and omega 6 fatty acids, iron, vitamin D, and folate, adjusted for maternal age, maternal prepregnancy BMI, child sex (male and female), cohort type (enriched familial autism probability and general population), maternal ethnicity/race (non-Hispanic White, non-Hispanic Black, Hispanic, and other), maternal education (less than high school, high school/GED, some college/associates degree/trade school, bachelor’s degree, and graduate degree), maternal smoking (yes and no), and child year of birth (1998–2004, 2005–2009, 2010–2014, and 2015+). Plots show bivariate exposure–response function for 2 predictors, where the second predictor is fixed at various percentiles (10th, 50th, and 90th), and all other predictors are fixed at the 50th percentile. The magnified plot shows the association of folate with SRS score at different quantiles of omega 3 fatty acids. Intersecting lines suggest an interaction between folate and omega 3 fatty acids. ECHO, Environmental influences on Child Health Outcomes; SRS, Social Responsiveness Scale.
FIGURE 3
FIGURE 3
Adjusted associations between prenatal intake of 14 nutrients and child SRS scores using hierarchical Bayesian kernel machine regression (BKMR) (n = 952). Results of BKMR analyses in ECHO including energy-adjusted nutrient intake for omega 3 and omega 6 fatty acids, iron, vitamin D, folate, zinc, vitamin B12, vitamin B6, choline, betaine, vitamin A, vitamin C, vitamin E, and methionine, adjusted for maternal age, maternal prepregnancy BMI, child sex (male, female), cohort type (enriched familial autism probability, general population), maternal ethnicity/race (non-Hispanic White, non-Hispanic Black, Hispanic, and other), maternal education (less than high school, high school/GED, some college/associates degree/trade school, bachelor’s degree, and graduate degree), maternal smoking (yes, no), and child year of birth (1998–2004, 2005–2009, 2010–2014, and 2015+). Plots show: (A) the overall mixture effect, or the relationship between the nutrient mixture and child SRS scores. (B) Individual nutrient associations with SRS scores, holding all other nutrients at their 50th percentile. (C) Single-exposure effects; plot shows the impact on child SRS score when each exposure increases from its 25th to 75th percentile (whereas other exposures are fixed at their 25th, 50th, or 75th percentiles). (D) Interaction parameters; plot compares the single-exposure health risk of each exposure (associated with a change from its 25th to 75th percentile) when other exposures are fixed to their 75th percentile compared with their 25th percentile. The set of nutrients included here was selected as described in the text based on a priori interest for neurodevelopmental relevance and grouped by shared pathway. ECHO, Environmental influences on Child Health Outcomes; SRS, Social Responsiveness Scale.
FIGURE 4
FIGURE 4
Adjusted bivariate associations between prenatal intake of 14 nutrients and child SRS scores using hierarchical Bayesian kernel machine regression (BKMR) (n = 952). Results of BKMR analyses in ECHO including energy-adjusted nutrient intake for omega 3 and omega 6 fatty acids, iron, vitamin D, folate, zinc, vitamin B12, vitamin B6, choline, betaine, vitamin A, vitamin C, vitamin E, and methionine, adjusted for maternal age, maternal prepregnancy BMI, child sex (male, female), cohort type (enriched familial autism probability, and general population), maternal ethnicity/race (non-Hispanic White, non-Hispanic Black, Hispanic, and other), maternal education (less than high school, high school/GED, some college/associates degree/trade school, bachelor’s degree, and graduate degree), maternal smoking (yes and no), and child year of birth (1998–2004, 2005–2009, 2010–2014 and 2015+). Plots show bivariate exposure–response function for 2 predictors, where the second predictor is fixed at various percentiles (10th, 50th, and 90th) and all other predictors are fixed at the 50th percentile. The set of nutrients included here was selected as described in the text based on a priori interest for neurodevelopmental relevance and grouped by shared pathway. ECHO, Environmental influences on Child Health Outcomes.

References

    1. Prado E.L., Dewey K.G. Nutrition and brain development in early life. Nutr. Rev. 2014;72(4):267–284. doi: 10.1111/nure.12102. - DOI - PubMed
    1. Zhong C., Tessing J., Lee B.K., Lyall K. Maternal dietary factors and the risk of autism spectrum disorders: a systematic review of existing evidence. Autism. Res. 2020;13(10):1634–1658. doi: 10.1002/aur.2402. - DOI - PMC - PubMed
    1. Maenner M.J., Warren Z., Williams A., Amoakohene E., Bakian A.V., Bilder D.A., et al. Prevalence and characteristics of autism spectrum disorder among children aged 8 years — autism and developmental disabilities monitoring network, 11 sites, United States, 2020, Morb. Mortal. Wkly Rep. MMWR. 2023;72(2):1–14. doi: 10.15585/mmwr.ss7202a1. - DOI - PMC - PubMed
    1. Bölte S., Girdler S., Marschik P.B. The contribution of environmental exposure to the etiology of autism spectrum disorder. Cell. Mol. Life Sci. 2019;76(7):1275–1297. doi: 10.1007/s00018-018-2988-4. - DOI - PMC - PubMed
    1. Hallmayer J., Cleveland S., Torres A., Phillips J., Cohen B., Torigoe T., et al. Genetic heritability and shared environmental factors among twin pairs with autism. Arch. Gen. Psychiatry. 2011;68(11):1095–1102. doi: 10.1001/archgenpsychiatry.2011.76. - DOI - PMC - PubMed