. 2025 Mar 19;16(1):2693.
doi: 10.1038/s41467-025-57883-7.

Individualized non-invasive deep brain stimulation of the basal ganglia using transcranial ultrasound stimulation

Affiliations

Individualized non-invasive deep brain stimulation of the basal ganglia using transcranial ultrasound stimulation

Ghazaleh Darmani et al. Nat Commun. .

Abstract

Transcranial ultrasound stimulation (TUS) offers precise, non-invasive neuromodulation, though its impact on human deep brain structures remains underexplored. Here we examined TUS-induced changes in the basal ganglia of 10 individuals with movement disorders (Parkinson's disease and dystonia) and 15 healthy participants. Local field potentials were recorded using deep brain stimulation (DBS) leads in the globus pallidus internus (GPi). Compared to sham, theta burst TUS (tbTUS) increased theta power during stimulation, while 10 Hz TUS enhanced beta power, with effects lasting up to 40 min. In healthy participants, a stop-signal task assessed tbTUS effects on the GPi, with pulvinar stimulation serving as an active sham. GPi TUS prolonged stop-signal reaction times, indicating impaired response inhibition, whereas pulvinar TUS had no effect. These findings provide direct electrophysiological evidence of TUS target engagement and specificity in deep brain structures, suggesting its potential as a noninvasive DBS strategy for neurological and psychiatric disorders.


Conflict of interest statement

Competing interests: The authors declare no competing interests.

Figures

Fig. 1
Fig. 1. Transcranial ultrasound stimulation (TUS) of the GPi in Parkinson’s disease and dystonia patients implanted with deep brain stimulation (DBS) devices.
A TUS was applied to lead contacts 1 and 9 (contacts are numbered 0-3 on one lead and 8−11 on the other, with 0 and 8 being the deepest ones) for each patient (left and right hemispheres) individually. Local field potentials (LFPs) were recorded wirelessly before, during, and up to 40 min after the application of TUS. The experimental protocol timeline incorporates neurological assessments, baseline LFP recording, TUS application (theta burst transcranial ultrasound (tbTUS), 10 Hz TUS), and sham conditions (active and passive), followed by post-stimulation LFP recordings and a final neurological assessment. A has been printed with permission from © CC Medical Arts. B An example of a 4-s long LFP segment recorded wirelessly using the Medtronic Percept device.
Fig. 2
Fig. 2. Acoustic simulation estimates of the acoustic pressure distribution and temperature changes in the GPi-DBS patients.
A Spatial intensity distribution for patient S10, with red indicating the highest intensity and blue the lowest. The ultrasound beam’s focal point was located within the GPi. B Estimated temperature rise in different brain tissues for the same patient S10, with the highest temperature rise observed at the skull due to absorption and heating effects from the ultrasound energy. In both simulations, the transducer was positioned externally at the top, with the skull’s outline and ultrasound waves shown penetrating through to the target area. CH Comparative analysis of simulated ultrasound parameters for two sonication protocols, theta burst transcranial ultrasound (tbTUS) and 10 Hz TUS. C Estimated temperature in the skin, skull, and brain for both protocols (n = 20 hemispheres). D Transducer adjustments in subject space along the x, y, and z axes in mm to compensate for ultrasound beam deviations based on BabelBrain simulation results (n = 20 hemispheres). E Sonication depth based on BabelBrain simulation results compared to the unadjusted distance from the transducer to the target location (n = 20 hemispheres). FH In situ intensity values of Spatial Peak Temporal Average (ISPTA), Spatial Peak Pulse Average (ISPPA), and Mechanical Index (MI) for both protocols. Note that 10 Hz TUS results in higher ISPTA values than tbTUS (n = 20 hemispheres). Data are presented as mean ± standard deviation. I Pressure maps derived from ultrasound modeling superimposed on the MRI image of patient S04, highlighting the targeting of the DBS lead within the left GPi. J Postoperative CT imaging fused with preoperative MRI, featuring automatically segmented 3D visualizations of the GPe (turquoise), GPi (orange), internal capsule (red), thalamus (navy blue), and the DBS lead. These elements are superimposed onto the simulated acoustic focus (yellow) using BrainLab software. K The in-line view of the DBS lead artifact for the same patient (S04), along with the simulated acoustic focus (with the epicenter outlined in red, orange, and yellow), is shown. The lower part of (K) illustrates the size and location of the acoustic focus in comparison to other structures, including the GPe, GPi, internal capsule, and thalamus.
Fig. 3
Fig. 3. DBS lead localization and power changes from baseline for all TUS protocols.
A The localizations of the DBS leads in the GPi (n = 9 PD patients, n = 1 dystonia patient) demonstrated in both axial and coronal brain views. B Comparison of baseline spectral power across the tbTUS, 10 Hz TUS, active sham, and passive sham conditions, indicating no significant differences in total baseline LFP power spectra (3–30 Hz) prior to the application of TUS (Wilcoxon signed-rank test). Shaded areas represent the standard error of the mean. CF Histograms represent the total percentage change in spectral power (3–30 Hz) from baseline following each TUS protocol. The data has been pooled across all 18 hemispheres (n = 9 PD patients) and at four different time points post-TUS. While tbTUS (C), and 10 Hz TUS (D) significantly increased the overall power from baseline (tbTUS: p = 0.01, 10 Hz TUS: p = 7E-06), passive sham and active sham TUS (E, F) had no significant effects (passive sham: p = 0.06, active sham: p = 0.8). Statistical Significance was tested by a two-sided Wilcoxon signed-rank test with Bonferroni adjustment. Asterisks indicate statistical significance (*p < 0.05, ***p < 0.001) and the pink downward-pointing triangles indicate the mean of the distribution. The vertical dashed line at 0% denotes the baseline level for reference.
Fig. 4
Fig. 4. Comparative analysis of spectral power changes across different stimulation protocols.
This collection of scatter plots, labeled (AF), illustrates the percent change in power for various stimulation conditions. Both tbTUS and 10 Hz TUS increased the power significantly compared to the passive sham (Mann–Whitney U-test, p = 0.006, and p = 4.55E-06 respectively), and the active sham (Mann–Whitney U-test, p = 0.0003, and p = 3.57E-07 respectively) stimulation. Changes in the power following 10 Hz TUS were more profound than tbTUS-induced power increase (Mann–Whitney U-test, p = 0.03). Finally, there was no significant difference between the passive sham and active sham conditions (Mann–Whitney U-test, p = 0.45). In (AF), p-values were adjusted by Benjamini-Hochberg procedure to control FDR. Each dot represents an individual hemisphere/timepoint measurement (n = 18 hemispheres, 4 different time points), and error bars indicate the standard error of the mean of power across the entire frequency range of 3 to 30 Hz. Superimposed histograms on the right side of each plot reveal the distribution of changes, with the inverted triangle denoting the mean of each distribution. The dashed line in each plot marks the zero point, serving as a baseline for comparison. Significant differences between the means of each histogram are highlighted with asterisks, where * denotes p < 0.05, ** signify p < 0.01, and *** indicate p < 0.001. These differences are measured in terms of power changes between each pair of stimulation protocols.
Fig. 5
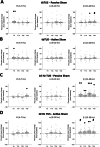
Fig. 5. Percent power change from baseline in distinct frequency bands following TUS of GPi.
This figure displays the changes in spectral power within different frequency bands (θ theta [4–7 Hz], α alpha [8–12 Hz], and β beta [13–30 Hz]) from baseline after transcranial ultrasound stimulation (TUS), measured at T0, T10, T25, and T40 minutes post-intervention (n = 18 hemispheres). The error bars represent the standard error of the mean. The panels depict comparisons between TUS and sham conditions: A shows tbTUS - Passive Sham with significant increase in θ power at T0 (p = 0.009, Wilcoxon signed-rank test) and β power at T25 (p = 0.04, paired t-test), as well as a non-significant trend (denoted by #) towards increase in β power at T40 (p = 0.07, paired t-test). B illustrates tbTUS - Active Sham with significant increase in θ power at T0 (p = 0.03, paired t-test); C represents 10 Hz TUS - Passive Sham, indicating significant increase in β power at T0, T10, T25, and T40 (p = 0.004, p = 0.002, p = 0.0003, and p = 0.03 respectively, paired t-test), as well as in θ power at T40 (p = 0.03, paired t-test) and D displays 10 Hz TUS - Active Sham with significant increase in β power at T10, and T25 (p = 0.01, and p = 0.003 respectively, paired t-test), as well with non-significant increase in β at T0 and T40 post-TUS (p = 0.09, and p = 0.06 respectively, paired t-test). Asterisks denote levels of statistical significance (*p < 0.05, **p < 0.01, ***p < 0.001), and hash signs (#) indicate statistical trends (non-significant changes in the range of 0.05 <p < 0.1)). In each frequency band, p-values were adjusted by Benjamini-Hochberg procedure to control FDR. All statistical tests were two-sided.
Fig. 6
Fig. 6. Correlation analysis of percent power change from baseline with MDS-UPDRS scores and LEDD dosage following TUS protocols.
This figure displays scatter plots examining the relationship between percent power change from baseline (n = 18 hemispheres) and clinical as well as pharmacological variables across different TUS protocols. Each panel presents Pearson correlation values (r) and associated significance levels (p-values), analyzing the potential link between changes in spectral power and either MDS-UPDRS scores or LEDD (Levodopa Equivalent Daily Dose) in milligrams (mg). A, B show the correlations for tbTUS (theta burst TUS) with Passive and Active Sham respectively, while C, D illustrate the same for 10 Hz TUS with Passive and Active Sham, respectively. The left graphs of each panel correspond to correlations with MDS-UPDRS, and the right graphs with LEDD dosage. Notably, significant correlations are observed in the right graphs of (A, B, C), suggesting a relationship between LEDD dosage and spectral power change in these conditions. The shaded areas around the dotted line represent the 95% confidence intervals for the regression estimates.
Fig. 7
Fig. 7. Causal effects of the TUS of the GPi and pulvinar on inhibitory control behavior.
A Schematic of the behavioral study design: Fifteen healthy participants performed the task three times in each session: before sonication, after the first round of sonication, and after the second round of sonication. Part of this figure has been Created in BioRender. Ramezanpour, H. (2025) https://BioRender.com/p29x980. B Schematic of the stop-signal task used to measure inhibitory control. In Go trials, participants respond to a go stimulus, while in stop trials, they attempt to inhibit their response upon seeing a stop signal, with a stop-signal delay (SSD) adjusted to create a 50% successful stop rate. ITI inter trial interval.
Fig. 8
Fig. 8. Acoustic simulation estimates of the acoustic pressure distribution and temperature changes in the healthy participants in Experiment II.
A Estimated temperature change for both targets. (GPi: n = 30 hemispheres, Pulvinar: n = 29 hemispheres) B Transducer adjustments in subject space along the x (ΔX), y (ΔY), and z (ΔZ) axes in mm to compensate for ultrasound beam deviations based on BabelBrain simulation results (GPi: n = 30 hemispheres, Pulvinar: n = 29 hemispheres). CE In situ intensity values of the Mechanical Index (MI), Spatial Peak Pulse Average (ISPPA), and Spatial Peak Temporal Average (ISPTA) for both targets (GPi: n = 29 hemispheres, Pulvinar: n = 29 hemispheres). F The average actual distance and the adjusted distance to target GPi (n = 30 hemispheres) and Pulvinar (n = 30 hemispheres) after corrections for skull energy losses. Error bars indicate the standard error of the mean. G Pressure maps derived from ultrasound modeling were superimposed on the MRI image of one exemplary subject, demonstrating that the focal region of the ultrasound beam successfully overlapped with the intended target regions (GPi and pulvinar). The superimposed modeling shows the axial plane of the subjects’ brain, with the intersection of the green lines marking the sonication focal point, informed by subject-specific anatomical data.
Fig. 9
Fig. 9. Stop-signal task performance pre- and post-intervention in GPi and pulvinar targets.
A Stop-signal reaction times (SSRTs) for the GPi target, displayed across three different time points: pre-intervention, post-intervention 1 (post1), and post-intervention 2 (post2). Each data point represents an individual participant’s SSRT with group mean marked, demonstrating significantly increased SSRT post-intervention (n = 15 participants; pre vs. post1: p = 0.03, paired t-test; pre vs. post2: p = 0.01, paired t-test; post1 vs. post2: p = 0.45, paired t-test). B Go trial reaction times for the GPi target across the same time points as in (A), with individual participant data (n = 15) and group mean indicated, showing no significant change (pre vs. post1: p = 0.92, paired t-test; pre vs. post2: p = 0.90, paired t-test; post1 vs. post2: p = 0.97, paired t-test). C Stop-signal reaction times for the pulvinar target, with individual participant data (n = 15), displaying no significant change across the time points (pre vs. post1: p = 0.45, paired t-test; pre vs. post2: p = 0.47, paired t-test; post1 vs. post2: p = 0.94, paired t-test). D Go trial reaction times for the pulvinar target, also showing individual participant data (n = 15) without significant differences across the time points (pre vs. post1: p = 0.65, paired t-test; pre vs. post2: p = 0.42, paired t-test; post1 vs. post2: p = 0.49, paired t-test). E Comparison of stop-signal reaction times (post - pre) between the two stimulated regions, with individual participant data, displaying significant longer SSRTs when GPi was sonicated (p = 0.04, two-sample t-test). F Go trial reaction times did not differ across the two stimulation regions (p = 0.86, two-sample t-test). E, F to account for differences in baseline variability between the GPi and pulvinar sessions, post-TUS values were normalized by the standard deviation of the pre-TUS values (n = 30). The asterisk (*) denotes statistically significant differences (p < 0.05), and ‘n.s.’ indicates non-significant differences. Error bars indicate the standard error of the mean (blue: pre-intervention, purple: post-intervention 1, yellow: post-intervention 2, red: GPi, black: pulvinar).

References

    1. Darmani, G. et al. Non-invasive transcranial ultrasound stimulation for neuromodulation. Clin. Neurophysiol.135, 51–73 (2022). - PubMed
    1. Wagner, T., Valero-Cabre, A. & Pascual-Leone, A. Noninvasive human brain stimulation. Annu. Rev. Biomed. Eng.9, 527–565 (2007). - PubMed
    1. Lozano, A. M. et al. Deep brain stimulation: current challenges and future directions. Nat. Rev. Neurol.15, 148–160 (2019). - PMC - PubMed
    1. Folloni, D. et al. Manipulation of subcortical and deep cortical activity in the primate brain using transcranial focused ultrasound stimulation. Neuron101, 1109–1116.e5 (2019). - PMC - PubMed
    1. Kubanek, J. et al. Remote, brain region–specific control of choice behavior with ultrasonic waves. Sci. Adv.6, eaaz4193 (2020). - PMC - PubMed

LinkOut - more resources