. 2025 Mar 19;16(1):2651.
doi: 10.1038/s41467-025-58107-8.

Microbiota-indole-3-propionic acid-heart axis mediates the protection of leflunomide against αPD1-induced cardiotoxicity in mice

Affiliations

Microbiota-indole-3-propionic acid-heart axis mediates the protection of leflunomide against αPD1-induced cardiotoxicity in mice

Rong Huang et al. Nat Commun. .

Abstract

Anti-programmed death 1 (αPD1) immune checkpoint blockade is used in combination for cancer treatment but associated with cardiovascular toxicity. Leflunomide (Lef) can suppress the growth of several tumor and mitigate cardiac remodeling in mice. However, the role of Lef in αPD1-induced cardiotoxicity remains unclear. Here, we report that Lef treatment inhibits αPD1-related cardiotoxicity without compromising the efficacy of αPD1-mediated immunotherapy. Lef changes community structure of gut microbiota in αPD1-treated melanoma-bearing mice. Moreover, mice receiving microbiota transplants from Lef+αPD1-treated melanoma-bearing mice have better cardiac function compared to mice receiving transplants from αPD1-treated mice. Mechanistically, we analyze metabolomics and identify indole-3-propionic acid (IPA), which protects cardiac dysfunction in αPD1-treated mice. IPA can directly bind to the aryl hydrocarbon receptor and promote phosphoinositide 3-kinase expression, thus curtailing the cardiomyocyte response to immune injury. Our findings reveal that Lef mitigates αPD1-induced cardiac toxicity in melanoma-bearing mice through modulation of the microbiota-IPA-heart axis.


Conflict of interest statement

Competing interests: The authors declare no competing interests.

Figures

Fig. 1
Fig. 1. Lef enhanced the efficacy of αPD1-mediated immunotherapy against melanoma progression.
A Schematic representation of the experimental design for establishing a model of PD1 inhibitors-related cardiotoxicity in mice, encompassing the administration schedule of both PD1 inhibitor (administered intraperitoneally at 250 μg/kg on alternate days) and leflunomide (given daily at 10 mg/kg). B Hematoxylin and eosin (H&E) staining illustrates the histological features of melanoma tumor sections. C Quantification reveals the temporal evolution of melanoma tumor volume across groups (IgG control, n = 15; αPD1-treated, n = 20). D Assessment of CD4+ (red) and CD8+ (green) T lymphocyte infiltration within tumor tissues from different groups (n = 6). Nuclei are stained with DAPI (blue). Data are shown as the mean ± SEM and analyzed using one-way ANOVA with post hoc tests.
Fig. 2
Fig. 2. Lef attenuated cardiotoxicity in αPD1-treated melanoma mice.
A Representative M-mode echocardiographic images of the left ventricle. Ejection fraction (EF) (B) and Fractional shortening (FS) (C) and Left ventricular end-diastolic internal diameter (LVIDd) (D) were detected in these groups (n = 8). 2D speckle-tracking echocardiography and strain analysis (E) and Average radial strain (ARS) (F) and Global longitudinal strain (GLS) (G) (n = 4). H Heart weight-to-body weight ratio (HW/BW) (n = 8). I, J Plasma biomarker assessments revealing levels of cardiac troponin T (cTnT) and creatine kinase-MB (CK-MB) (n = 6). K HE staining and quantification of cardiomyocyte cross-sectional area (n = 6). L Masson trichrome staining and quantification of cardiac fibrosis (n = 6). Data are shown as the mean ± SEM and analyzed using one-way ANOVA with post hoc tests.
Fig. 3
Fig. 3. Lef effectively suppresses PD1 inhibitor-induced apoptosis in mice cardiomyocytes.
A Volcano plots of the upregulated genes (red) and downregulated genes (green) of αPD1 and αPD1+Lef groups (n = 4). The differential expression of genes (DEGs) between the two groups was analyzed using the DESeq2 R package (two-sided). B The analysis depicts the enriched Kyoto Encyclopedia of Genes and Genomes (KEGG) pathways among genes showing altered expression in melanoma-bearing mice treated with either αPD1+Veh or αPD1+Lef (two-sided). C Immunofluorescent staining for cardiac CD8+ T cells (green) in various treatment groups, highlighting their distribution and infiltration (n = 6). Nuclei are stained with DAPI (blue). D Representative western blots of BAX and BCL2 protein expression in hearts (n = 6). E Terminal deoxynucleotidyl transferase dUTP Nick End Labeling (TUNEL) staining and apoptosis rate in cardiac tissues (green, arrows indicate positive signals) (n = 6). Nuclei are stained with DAPI (blue). Data are shown as the mean ± SEM and analyzed using one-way ANOVA with post hoc tests.
Fig. 4
Fig. 4. Lef ameliorates PD1 inhibitor-induced intestinal barrier dysfunction and the effects of fecal transplantation in mice.
A Flow chart of fecal microbiota transplantation in αPD1 mice: recipient αPD1 mice, receiving αPD1 mouse feces, and αPD1+Lef mouse feces. Left ventricular end-diastolic dimension (LVIDd) (B), Ejection fraction (EF) (C), and Global longitudinal strain (GLS) (D) were detected in these groups (αPD1: n = 10, αPD1+Lef: n = 12). E Relative mRNA levels of Bnp (n = 6). F Plasma biomarker assessments reveal levels of cardiac troponin T (cTnT) (n = 6). G Terminal deoxynucleotidyl transferase dUTP Nick End Labeling (TUNEL) staining and apoptosis rate in tissues (green, arrows indicate positive signals) (n = 6). Nuclei are stained with DAPI (blue). Data are shown as the mean ± SEM and analyzed using unpaired two-tailed Student’s t-test.
Fig. 5
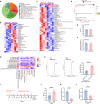
Fig. 5. Lef treatment alters gut microbial abundance and community structure in PD1 inhibitor-treated mice.
A Goods coverage index of dilution curves (n = 4). B Simpson’s index, in response to α-diversity of the flora (n = 4). For the box plots, the boxes extend from the first to the third quartile (25th to 75th percentiles), with the center line indicating the median and analyzed using one-way ANOVA followed by Tukey post hoc test (two-sided). C Principal coordinate analysis (PCoA), in response to β-diversity of the flora (n = 4) (ADONIS test: αPD1 verse IgG, p = 0.032; αPD1 verse αPD1+Lef, p = 0.024). D Heatmap of clustering of relative abundance of the flora at the phylum level (n = 4). E Sankey diagram illustrating the dynamic shifts in microbial populations among different groups in response to treatments (n = 4). F Linear discriminant analysis effect size (LEfSe) analysis of the αPD1 group versus the αPD1+Lef group (LDA threshold = 2.0) (n = 4). G Pairwise Spearman rank correlation heatmap for the analysis of the relationship between genus-level flora and cardiac function (n = 4). Data are shown as the mean ± SEM.
Fig. 6
Fig. 6. IPA protected against cardiotoxicity in αPD1-treated melanoma mice.
A Metabolite class pie charts. B, C Clustering heatmap of relative levels of serum metabolites (n = 4). D Pathway analyses of αPD1+Lef and αPD1+Veh (n = 4). Tryptophan deficiency experiments. Ejection fraction (EF) (E) and relative mRNA levels of Bnp after Tryptophan deficiency (F) (n = 6). G Heatmap of genus-level intestinal flora in association with characteristic serum metabolites (n = 4). H Quantitative analysis of IPA (n = 6). I Mice with 40 mg/kg IPA by gavage for a fortnight. J Ejection fraction (EF) (n = 10). K Relative mRNA levels of Bnp (n = 6). L Plasma biomarker assessments reveal levels of cardiac troponin T (cTnT) (n = 6). Data are shown as the mean ± SEM and analyzed using an unpaired two-tailed Student′s t-test.
Fig. 7
Fig. 7. IPA affects cardiotoxicity through the AhR receptor.
A Representative western blots of AhR and CYP1A1 after deficiency of IPA receptor AhR (n = 6). B Relative mRNA levels of Ahr in mouse heart (n = 6). Echocardiographic ejection fraction (EF) (C) and Fractional shortening (FS) (D) (n = 10). E Relative mRNA levels of Bnp (n = 6). F Plasma biomarker assessments revealing levels of cTnT (n = 6). Data are shown as the mean ± SEM and analyzed using unpaired two-tailed Student’s t-test (B) or one-way ANOVA with post hoc tests for others.
Fig. 8
Fig. 8. IPA promoted PI3K expression through the ligand binding of AhR in the heart.
A AhR binding site was identified on the PI3K promoter. B Independent ChIP-PCR (n = 6). C, D Relative mRNA levels of Pik3ca in hearts of mice (n = 6). E Representative western blots of p-PI3K, PI3K, p-AKT, and p-GSK-3β protein expression in hearts (n = 6). F Cell viability in αPD1, αPD1+IPA and αPD1 +shPI3K groups (n = 6). Data are shown as the mean ± SEM and analyzed using unpaired two-tailed Student’s t-test (B) or one-way ANOVA with post hoc tests.

References

    1. Turner, N., Ware, O. & Bosenberg, M. Genetics of metastasis: melanoma and other cancers. Clin. Exp. Metastasis35, 379–391 (2018). - PubMed
    1. Siegel, R. L., Miller, K. D., Fuchs, H. E. & Jemal, A. Cancer statistics, 2022. CA A Cancer J. Clin.72, 7–33 (2022). - PubMed
    1. Robert, C. et al. Five-year outcomes with dabrafenib plus trametinib in metastatic melanoma. N. Engl. J. Med.381, 626–636 (2019). - PubMed
    1. Hodi, F. S. et al. Improved survival with ipilimumab in patients with metastatic melanoma. N. Engl. J. Med.363, 711–723 (2010). - PMC - PubMed
    1. Woo, T. E. et al. Effectiveness of immune checkpoint inhibitor with anti-PD-1 monotherapy or in combination with ipilimumab in younger versus older adults with advanced melanoma. Curr. Oncol.30, 8936–8947 (2023). - PMC - PubMed

MeSH terms

LinkOut - more resources