. 2025 Mar 19;16(1):2708.
doi: 10.1038/s41467-025-57631-x.

Clade-specific extracellular vesicles from Akkermansia muciniphila mediate competitive colonization via direct inhibition and immune stimulation

Affiliations

Clade-specific extracellular vesicles from Akkermansia muciniphila mediate competitive colonization via direct inhibition and immune stimulation

Moon-Gi Hong et al. Nat Commun. .

Abstract

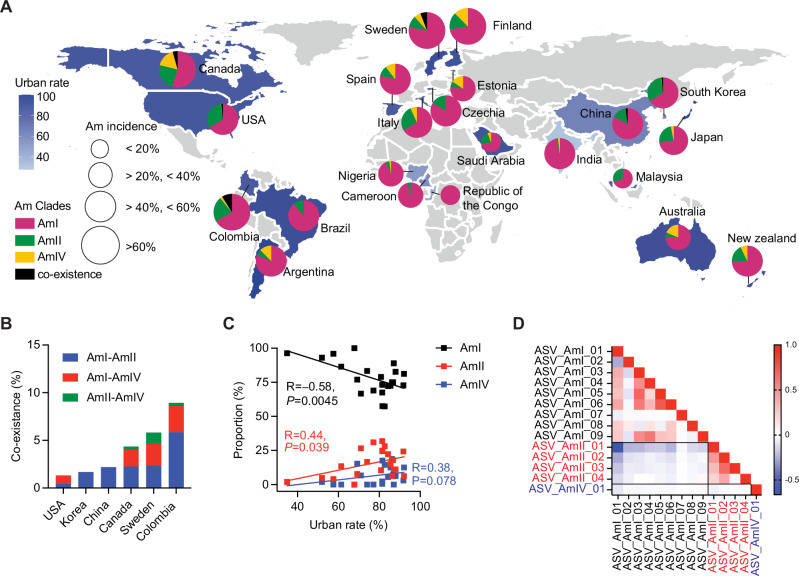
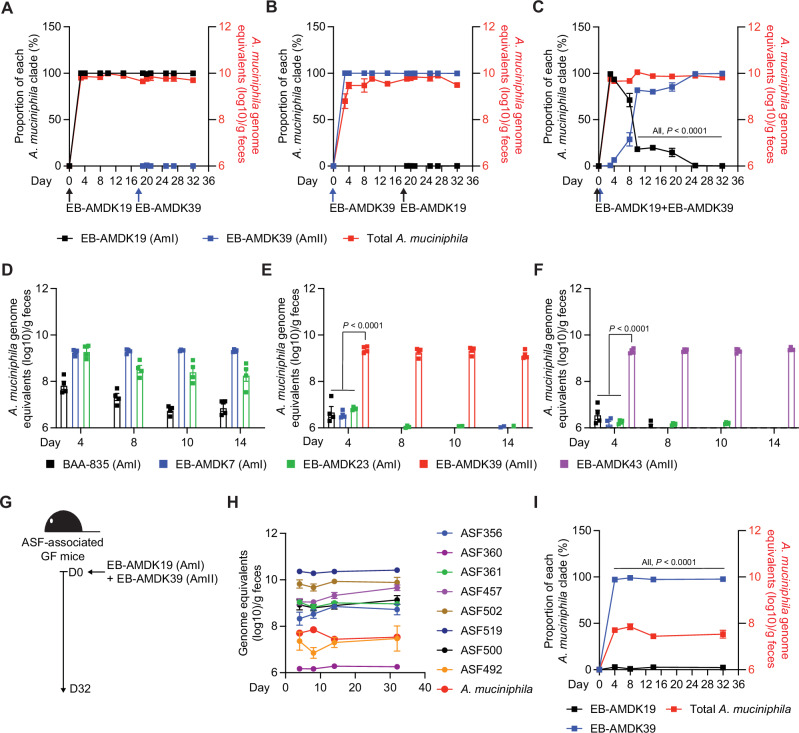
Akkermansia muciniphila, a promising candidate for next-generation probiotics, exhibits significant genomic diversity, classified into several distinct clades (AmI to AmIV). Notably, a single Akkermansia clade tends to predominate within individual hosts, with co-occurrence of different clades being rare. The mechanisms driving such clade-specific exclusion remain unclear. Here, we show that extracellular vesicles (EVs) derived from AmII clade inhibit the growth of clade I (AmI), conferring a competitive advantage to AmII. Moreover, we observe clade-specific immunoglobulin A (IgA) responses, where AmII clade-specific IgAs, induced by EVs from AmII, facilitate niche occupancy and competitive exclusion of AmI. These findings provide insights into the competitive dynamics of A. muciniphila clades and suggest that future personalized microbiome interventions could be optimized by considering the clade composition of A. muciniphila in individual hosts.


Conflict of interest statement

Competing interests: M-G.H., D.H.K., D.K.L., S-N.L., and J-G.S. were employed by Enterobiome Inc. The authors declare that this study did not receive funding from Enterobiome Inc. The remaining authors declare no competing interests.

Figures

Fig. 1
Fig. 1. Diversity of A. muciniphila influenced by urbanization and single clade predominance in human populations.
A Pie charts showing the distribution of A. muciniphila clades within each country. The blue scale filling each country represents the urban rate. The size of the pie reflects the proportions of individuals harboring A. muciniphila in each country. B Coexistence of A. muciniphila clades in six countries. C Scatter plot with Pearson correlation coefficients after two-sided multiple comparisons showing the correlation between the proportion of A. muciniphila clades and urbanization rate. D Spearman correlation matrix of A. muciniphila ASVs according to clade in 890 healthy Korean subjects. Spearman correlation coefficient strength was 12 as indicated by the colored bar. Twenty-two A. muciniphila ASVs were named for each clade according to the rank of total read count, and 14 ASVs with > 1000 read count were used for correlation analysis (ASV_AmI_01 to ASV_AmI_09: black, ASV_AmII_01 to ASV_AmII_04: red, ASV_AmIV_01: blue). Source data are provided as a Source Data file.
Fig. 2
Fig. 2. Culture supernatants from various AmII clade strains unilaterally inhibit AmI clade growth in vitro.
A Changes in relative abundance of EB-AMDK19(AmI) and EB-AMDK39 (AmII) after in vitro co-culture. Equal numbers of EB-AMDK19 and EB-AMDK39 were co-inoculated into mucin-rich media. Values are averaged from three biological replicates. B Changes in relative abundance of A. muciniphila clades upon addition of EB-AMDK39 to EB-AMDK19-enriched culture. EB-AMDK39 (1 × 108 CFU) was additionally inoculated into EB-AMDK19-enriched culture (1 × 1010 CFU/culture). C Changes in growth of EB-AMDK19 (AmI) and EB-AMDK39 upon the treatment with culture supernatants derived from EB-AMDK19 and EB-AMDK39. D, E Changes in growth of various A. muciniphila strains belonging to AmI and AmII clades upon treatment with supernatants derived from the EB-AMDK39 (D) and from the other AmII clade strains (E). Growth of each A. muciniphila strain was measured as OD600 at 48 h after inoculation (AmI strains: black, AmII strains: red). Growth was depicted as a percentage of media control (n = 3 biological replicates). Cell-free supernatants derived from A. muciniphila strains were prepared through filtration (0.2 µm). At least, two independent experiments showed similar results. Statistical differences were determined using two-way ANOVA with Sidak’s multiple comparison tests. ns: not significant. Error bars represent SEM. Source data are provided as a Source Data file.
Fig. 3
Fig. 3. Extracellular vesicles derived from AmII inhibit AmI growth in vitro.
A Changes in EB-AMDK19 (AmI) growth upon treatment with unprocessed, heat-inactivated (HI) and protease-treated EB-AMDK39 (AmII)-derived culture supernatant. AmII-derived supernatants were heat-inactivated at 95 °C for 15 min or treated with proteinase K (1 mg/mL) for 16 h at 37 °C. Proteinase K-treated samples were supplemented with protease inhibitor (1 mM). B EB-AMDK19 growth inhibition by EB-AMDK39-derived culture supernatant fractionated by molecular weight. EB-AMDK19 growth was assessed after 24 h in the presence of 20% size-fractionated EB-AMDK39-derived culture supernatant. C Identification of inhibitory size-exclusion fractions derived from EB-AMDK39-derived culture supernatant. Fractions prepared by size-exclusion chromatography were treated into EB-AMDK19 culture at a final concentration of 10% (v/v). Growth of EB-AMDK19 at 37 °C for 24 h was depicted as a percentage of media control. Points and connecting lines are drawn to show the EB-AMDK19 growth changes according to the fractions. Column bar graph shows the protein concentration (mg/mL) in each fraction. D Dose dependent inhibition of EB-AMDK19 growth by enriched EB-AMDK39-derived EVs. EV particle number was determined by nano particle tracking analysis. Enriched EB-AMDK39-derived EVs at various EV-to-cell ratios were used to treat EB-AMDK19 culture (1 × 106 CFU/culture) and growth was assessed after 24 h. AD Growth is depicted as a percentage of media control (n = 3 biological replicates). At least, two independent experiments showed similar results. Statistical differences were determined by one-way ANOVA with Tukey’s multiple comparison tests. ns: not significant. Error bars represent SEM. E Disk diffusion test to monitor the growth inhibition of each clades by enriched EVs derived from EB-AMDK19 (EVs-EB-AMDK19) and EB-AMDK39 (EVs-EB-AMDK39). F Transmission electron micrographs showing enriched EVs derived from EB-AMDK19 or EB-AMDK19 and the structural integrity of each clade strain upon treatment with enriched EVs derived from EB-AMDK19 or EB-AMDK19. Bars indicate 500 nm. At least two independent experiments showed similar results. Source data are provided as a Source Data file.
Fig. 4
Fig. 4. Luminal EVs derived from AmII-associated germ-free mice inhibit AmI growth in vitro.
A, B Levels of EB-AMDK19 (AmI) (A) and EB-AMDK39 (AmII) (B) in feces from mono-associated GF mice at different time points. GF mice were gavaged with each clade and fecal DNA was prepared to determine luminal levels of each clade by qPCR (n = 4). C, D Changes in growth of EB-AMDK19 (C) and EB-AMDK39 (D) in vitro upon treatment of whole fecal soluble fractions (SF) from GF mice, and whole fecal SF, heat-inactivated whole fecal SF, and size-fractionated SF with indicated cut-off from EB-AMDK39-associated GF mice. Growth was assessed after 24 h upon treatment. Growth is depicted as a percentage of media control (n = 3 biological replicates). At least two independent experiments showed similar results. Statistical differences were determined by one-way ANOVA with Tukey’s multiple comparison tests. ns: not significant. Error bars represent SEM. E Identification of inhibitory size-exclusion fractions derived from fecal SF of GF (left) and EB-AMDK39-associated GF mice (right). Fractions prepared by size-exclusion chromatography were used to treat EB-AMDK19 and EB-AMDK39 culture at a final concentration of 20% (v/v). Growth of each clade at 37 °C for 24 h is depicted as a percentage of media control. Points and connecting lines were drawn based on the clade growth patterns (% of medium control) according to the fractions. Growth of EB-AMDK19 and EB-AMDK39 was marked in black and blue, respectively. The column bar graph was drawn using the protein concentration (mg/mL) in each fraction (red). Data represent the averages of triplicate measurements. Two independent experiments showed similar results. Statistical differences were determined by two-way ANOVA with Sidak’s multiple comparison tests. Error bars represent SEM. F Disk diffusion test to show changes in growth of EB-AMDK19 upon treatment with enriched EVs from EB-AMDK39 in vitro culture, fecal SF derived from GF (B), and EB-AMDK39-asssociated GF mice (C). Source data are provided as a Source Data file.
Fig. 5
Fig. 5. AmII strains of A. muciniphila predominate in the host gut under various conditions.
A, B Pre-occupancy effect on competitive exclusion between AmI and AmII. A GF mice were first gavaged with EB-AMDK19 (AmI) followed by association with EB-AMDK39 (AmII) on day 19 post-EB-AMDK19 administration (n = 4). B GF mice were first gavaged with EB-AMDK39 followed by association with EB-AMDK19 on day 19 post-EB-AMDK39 administration (n = 4). C Competitive exclusion between AmI and AmII in the murine gut. GF mice were administered simultaneously with an equal mixture of two-clade strains (n = 4). The genome equivalent levels of total A. muciniphila and each clade in feces was quantified using qPCR with A. muciniphila-specific and clade-specific primers. The proportion of each clade (%) is shown as black points/line (EB-AMDK19) and blue points/line (EB-AMDK39). Each point represents the average of measurement in an individual mouse. Two independent experiments showed similar results. DF GF mice were gavaged with a mixture of three AmI strains (BAA-835, EB-AMDK7, EB-AMDK23) alone (D) and with either EB-AMDK39 (AmII) (E) or EB-AMDK43 (AmII) (F) (n = 4). The genome equivalent levels of each A. muciniphila strain in feces was quantified using qPCR with strain-specific primers. Each point represents the average measurement in an individual mouse. GI Competitive exclusion between A. muciniphila clades in gnotobiotic mice associated with Altered Schaedler Flora (ASF). GI GF mice were first gavaged with ASF for 6 weeks. ASF-associated GF mice were administered with an equal mixture of two-clade strains (EB-AMDK19 and EB-AMDK39) (n = 3). G Experiment scheme. H Changes in the genome equivalent levels of ASF species and A. muciniphila (n = 3). I Competitive exclusion between EB-AMDK19 and EB-AMDK39 in the gnotobiotic mice (n = 3). The genome equivalent levels of total A. muciniphila and each clade in feces was quantified using qPCR with A. muciniphila-specific and clade-specific primers. The proportion of each clade (%) is shown as black points/line (EB-AMDK19) and blue points/line (EB-AMDK39). Each data point represents the average of measurements taken from an individual mouse. Two independent experiments showed similar results. Statistical differences were determined using two-way ANOVA with Sidak’s multiple comparison tests (AI). Error bars represent SEM. Source data are provided as a Source Data file.
Fig. 6
Fig. 6. EV-induced clade-specific IgA enhances initial colonization of AmII in the host gut.
A Schematics of strategies for bacterial cell flow cytometry to examine the proportion of IgA-bound bacteria. B Proportions of IgA bound bacteria in GF mice mono-associated with EB-AMDK19 (AmI) and EB-AMDK39 (AmII) (n = 4 per group). Each data point represents the average of measurements taken from an individual mouse. C, D Cross-reactivity of luminal IgAs induced by each clade. Fecal soluble fraction (fSF) obtained from EB-AMDK19- and EB-ADMK39-associated GF mice (n = 4 per group). fSF from an individual mouse was used to treat EB-AMDK19 and EB-AMDK39 bacteria and the proportion of IgA bound bacteria was determined by bacterial cell flow cytometry. C Representative contour plot showing the proportion of IgA-bound bacteria gated on DNA-stained bacteria. D Percentage of IgA-bound bacteria (EB-AMDK19 or EB-AMDK39). Data points represent individual mice. E, F GF mice were orally treated with enriched EB-AMDK39-derived EVs. At indicated time points, fecal soluble fractions were obtained to examine specific binding to EB-AMDK39 bacteria by bacterial flow cytometry (n = 4 for GF mice associated with EB-AMDK39, n = 8 for untreated GF mice and GF mice orally treated with enriched EB-AMDK39-derived EVs). E Representative plot showing the proportion of IgA-bound EB-AMDK39 gated on DNA-stained bacteria. F Percentage of IgA-bound EB-AMDK39. G Effect of IgAs induced by oral administration of enriched EB-AMDK39-derived EV on the initial colonization of EB-AMDK39. GF wildtype (WT) mice, GF WT mice, and B cell-deficient JH−/− mice treated with enriched EB-AMDK39-derived EVs (50 μg per mouse) were administered with a mixture of EB-AMDK19 (1 × 108 CFU per mouse) and EB-AMDK39 (2 × 107 CFU or 4 × 106 CFU) on day 14 post-EV administration. GF WT mice without EV administration were used as a negative control (n = 4 per group). The level of each clade in feces was quantified by qPCR with clade-specific primers. Each point represents the average of measurements taken from an individual mouse. Statistical differences were determined by two-way ANOVA with Sidak’s multiple comparison tests (B, D, G) or by one-way ANOVA with Tukey’s multiple comparisons test (F). ns: not significant. Error bars represent SEM. Source data are provided as a Source Data file.

References

    1. Wang, B., Yao, M., Lv, L., Ling, Z. & Li, L. The human microbiota in health and disease. Engineering3, 71–82 (2017).
    1. Gomaa, E. Z. Human gut microbiota/microbiome in health and diseases: a review. Antonie Van. Leeuwenhoek113, 2019–2040 (2020). - PubMed
    1. Cani, P. D. & de Vos, W. M. Next-generation beneficial microbes: the case of Akkermansia muciniphila. Front. Microbiol.8, 1765 (2017). - PMC - PubMed
    1. Zhang, T., Li, Q., Cheng, L., Buch, H. & Zhang, F. Akkermansia muciniphila is a promising probiotic. Microb. Biotechnol.12, 1109–1125 (2019). - PMC - PubMed
    1. Derrien, M., Belzer, C. & de Vos, W. M. Akkermansia muciniphila and its role in regulating host functions. Microb. Pathogenesis106, 171–181 (2017). - PubMed

Substances

Supplementary concepts

LinkOut - more resources