. 2025 Mar 19;8(1):171.
doi: 10.1038/s41746-025-01557-7.

Credibility assessment of a mechanistic model of atherosclerosis to predict cardiovascular outcomes under lipid-lowering therapy

Affiliations

Credibility assessment of a mechanistic model of atherosclerosis to predict cardiovascular outcomes under lipid-lowering therapy

Yishu Wang et al. NPJ Digit Med. .

Abstract

Demonstrating cardiovascular (CV) benefits with lipid-lowering therapy (LLT) requires long-term randomized clinical trials (RCTs) with thousands of patients. Innovative approaches such as in silico trials applying a disease computational model to virtual patients receiving multiple treatments offer a complementary approach to rapidly generate comparative effectiveness data. A mechanistic computational model of atherosclerotic cardiovascular disease (ASCVD) was built from knowledge, describing lipoprotein homeostasis, LLT effects, and the progression of atherosclerotic plaques leading to myocardial infarction, ischemic stroke, major acute limb event and CV death. The ASCVD model was successfully calibrated and validated, and reproduced LLT effects observed in selected RCTs (ORION-10 and FOURIER for calibration; ORION-11, ODYSSEY-OUTCOMES and FOURIER-OLE for validation) on lipoproteins and ASCVD event incidence at both population and subgroup levels. This enables the future use of the model to conduct the SIRIUS programme, which intends to predict CV event reduction with inclisiran, an siRNA targeting hepatic PCSK9 mRNA.


Conflict of interest statement

Competing interests: D.A. reports having received payment or honoraria for lectures, presentations, speakers bureaus or educational events from Amgen, Alnylam, Amarin, Astra Zeneca, Boehringer, BMS, Bouchara Recordati, Pfizer, Novartis, Novo Nordisk, Organon, Sanofi, Servier, Vifor. P.A. reports: Grants: French government (PHRC: RIISC-THETIS, TST-40, SPICAF trials), Pfizer and AstraZeneca (TST trial); Speaker fee: Novartis, Viatris, Sanofi; Advisory board: Novartis, Neuraltide; Steering committee: Bayer. F.B. reports having received payments for consulting, speaking, or educational events from Amgen, Amarin, Novartis, Novo Nordisk, Boehringer, Servier, ViiV healthcare, Gilead and Sanofi. B.C. reports having received payments for consulting, speaking, or educational events from Amgen, Astra Zeneca, BMS, Eli Lilly, Novartis, Novo Nordisk, Sanofi, Ultragenyx. G.M. reports having received payments for consulting, speaking, or educational events from Amgen, Amarin, Bayer Healthcare, BMS, Leo Pharma, Novartis, Novo Nordisk, Pfizer and Sanofi. P.G.S. reports: Research grants: Amarin, Sanofi; Clinical Trials (Steering committee, CEC, DSMB): Amarin, Amgen, AstraZeneca, Bayer, Bristol-Myers Squibb, Idorsia, Janssen, Novartis, Novo-Nordisk, Pfizer, Sanofi; Consulting or speaking: Amarin, Amgen, BMS, Novo-Nordisk; Senior Associate Editor at Circulation; Chief Scientific Officer: Bioquantis.

Figures
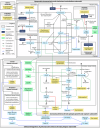
Fig. 1
Fig. 1. Graphical representation of the ASCVD model.
The top half shows the lipoprotein homeostasis and cholesterol metabolism submodel which focuses on the cholesterol cycle in physiological compartments and relations between the different lipoproteins. Cholesterol regulation mechanisms (e.g. cholesterol synthesis auto-regulation in hepatocytes) are not represented. Treatment submodels are represented via treatments’ mechanisms of action. The statin box includes 2 different statin submodels (rosuvastatin and atorvastatin). The atherosclerotic coronary plaque growth and rupture submodel is shown in the bottom half. Impact of inflammation is not represented on this graph, including pro-inflammatory and anti-inflammatory factors (e.g. inflammatory signals released by cell necrosis) and impact of inflammation (e.g. increased lipid oxidation with inflammation). 3P-MACE three-point major adverse cardiovascular event, CETP Cholesteryl ester transfer protein, CV death cardiovascular death, HDL-C high density lipoprotein cholesterol, hsCRP high-sensitivity C-reactive protein, LDL-C low-density lipoprotein cholesterol, LDLR low-density lipoprotein receptor, Lp(a)-C lipoprotein(a)-cholesterol, NPC1L1 Niemann-Pick C1-Like 1, VLDL-C very low-density lipoprotein cholesterol, PCSK9 proprotein convertase subtilisin/kexin type 9, PK pharmacokinetics, VSMC vascular smooth muscle cells.
Fig. 2
Fig. 2. Goodness of fit of calibration results obtained with the ASCVD model and VPop (N = 442,615).
Comparisons between simulated and observed data of a mean LDL-C relative change from baseline over time for LDL-C under placebo or inclisiran treatment, b median LDL-C level over time under placebo or evolocumab treatment, c cumulative incidence of MACE over time under placebo or evolocumab treatment and d CV event rates at 2.2 years for placebo and evolocumab arms. Simulated data were obtained by applying the placebo scenario and (a) inclisiran scenario or (bd) evolocumab scenario to the calibrated ASCVD model and VPop, and are shown in solid lines. Observed data are extracted from ORION-10 RCT (N = 780 in the placebo arm and N = 781 in the inclisiran arm) for (a) and from FOURIER RCT, (N = 13,780 in the placebo arm and N = 13,784 in the evolocumab arm) for (bd) and are shown in dashed lines. Placebo arms are shown in blue and treatment arms in orange. * Due to space constraint, the observed incidence rates of MALE (0.45% for placebo group and 0.27% for evolocumab group) are not shown. MALE incidence rates are measured at 2.5 years. CV death cardiovascular death, IS ischemic stroke, LDL-C low-density lipoprotein cholesterol, MACE major adverse cardiovascular event, MALE major adverse limb event, MI myocardial infarction, VPop virtual population.
Fig. 3
Fig. 3. Goodness of fit of calibration results with FOURIER at the subgroup-level.
Comparison of the predicted 3P-MACE incidence rates and HR stratified by subgroups with observed data extracted from FOURIER RCT (aSabatine et al., b Sever et al., cSabatine et al., dCharytan et al., eGiugliano et al. and fO’Donoghue et al.,. In the forest plot, simulated HR are presented as yellow triangles, observed HR and 95% CI are presented as black squares and bars. 3P-MACE three-point major adverse cardiovascular event, CI confidence interval, eGFR estimated glomerular filtration rate, EVO evolocumab, FU follow-up duration, HR hazard ratio, LDL-C LDL cholesterol, Lp(a) lipoprotein(a), MI myocardial infarction, PAD peripheral artery disease, Pbo placebo, PolyVD more than one medical history among prior MI, prior ischemic stroke and symptomatic PAD, RCT randomized clinical trial, VPop virtual population.
Fig. 4
Fig. 4. Main validation results on LDL-C and MACE at the population level.
a Comparison of simulated (solid lines) and observed (dashed lines) mean LDL-C evolution over time in ORION-11 under placebo (blue) and inclisiran (yellow). Observed data are extracted from individual data from ORION-11 for patients under well tolerated statin background therapy, 95% PPI is derived using 100 bootstrap repetitions of 808 patients among the 10,479. b Comparison of simulated 3P-MACE (CV death, nonfatal MI, nonfatal IS) (solid lines) and observed 4P-MACE (coronary heart disease (CHD) death, nonfatal MI, fatal and nonfatal IS and unstable angina requiring hospitalization) cumulative incidence in ODYSSEY-OUTCOMES (dashed lines) under placebo (blue) and alirocumab (yellow). Observed data are extracted from Schwartz et al. supplementary material. 95% PPI is derived using 100 bootstrap repetitions of 9462 patients among the 84,046. c Comparison of simulated (solid lines) and observed (dashed lines) mean LDL-C evolution over time under evolocumab in FOURIER-OLE for patients under placebo (blue) and evolocumab (yellow) during FOURIER parent trial. d Comparison of simulated (solid lines) and observed (dashed lines) 3P-MACE cumulative incidence in FOURIER-OLE under evolocumab for patients in the placebo group and in the evolocumab group in the FOURIER parent study. For (c) and (d), observed data are extracted from O’Donoghue et al. and 95% PPI is derived using 100 bootstrap repetitions of 3317 patients among the 16,570. CI confidence interval, EVO-EVO patient group originally randomized to evolocumab in the parent study then continued the evolocumab treatment during the FOURIER-OLE follow-up period, LDL-C LDL cholesterol, MACE major adverse cardiovascular event, Pbo-EVO patient group originally randomized to placebo in the parent study then treated with evolocumab during the FOURIER-OLE follow-up period, PPI predicted-percentage interval.
Fig. 5
Fig. 5. Main validation results with ODYSSEY-OUTCOMES at the subgroup-level.
Comparison of the predicted MACE incidence rates and HR stratified by subgroups with observed data extracted from ODYSSEY-OUTCOMES RCT (aSchwartz et al. and supplementary material, bSinnaeve et al.,, cBittner et al., dRay et al., eTuñón et al., fJukema et al. and gSchwartz et al.. The follow-up duration is 2.8 years. In the forest plot, simulated HR are presented as yellow triangles, observed HR and 95% CI are presented as black squares and bars. 3P-MACE three-point major adverse cardiovascular event, ASCVD atherosclerotic cardiovascular disease, ALI alirocumab, CBVD cerebrovascular disease, CHD coronary heart disease, CI confidence interval, eGFR estimated glomerular filtration rate (mL/min/1.73 m²), HR hazard ratio, LDL-C LDL cholesterol, Lp(a) lipoprotein(a), PAD peripheral arterial disease, Pbo placebo, PPI predicted-percentage interval, RCT randomized clinical trial, VPop virtual population.
Fig. 6
Fig. 6. Main robustness results on CV outcome incidence rates and HR predictions for a follow-up duration of 7 years with IMPROVE-IT.
Comparison of the predicted CV outcome incidence rates and HR with observed incidence rates in IMPROVE-IT. Observed incidence rates correspond to 7-year Kaplan–Meier estimates extracted from Cannon et al.. In the forest plot, simulated HR are presented as yellow triangles, observed HR and 95% CI are presented as black squares and bars. 3P-MACE three-point major adverse cardiovascular event, CI confidence interval, CV cardiovascular, EZE ezetimibe, HR hazard ratio, IS ischemic stroke, MI myocardial infarction, Pbo placebo, PPI predicted percentile interval, RCT randomized clinical trial, VPop virtual population.

References

    1. Libby, P. et al. Atherosclerosis. Nat. Rev. Dis. Prim.5, 56 (2019). - PubMed
    1. WHO. Cardiovascular diseases (CVDs). (2021) https://www.who.int/news-room/fact-sheets/detail/cardiovascular-diseases....
    1. GBD 2019 Diseases and Injuries Collaborators. Global burden of 369 diseases and injuries in 204 countries and territories, 1990–2019: a systematic analysis for the Global Burden of Disease Study 2019. Lancet396, 1204–1222 (2020). - PMC - PubMed
    1. Ference, B. A. et al. Low-density lipoproteins cause atherosclerotic cardiovascular disease. 1. Evidence from genetic, epidemiologic, and clinical studies. A consensus statement from the European Atherosclerosis Society Consensus Panel. Eur. Hear. J.38, 2459–2472 (2017). - PMC - PubMed
    1. Koplev, S. et al. A mechanistic framework for cardiometabolic and coronary artery diseases. Nat. Cardiovasc. Res.1, 85–100 (2022). - PMC - PubMed

LinkOut - more resources