

Prediction and analysis of tumor infiltrating lymphocytes across 28 cancers by TILScout using deep learning
- PMID: 40108446
- PMCID: PMC11923303
- DOI: 10.1038/s41698-025-00866-0
Prediction and analysis of tumor infiltrating lymphocytes across 28 cancers by TILScout using deep learning
Abstract
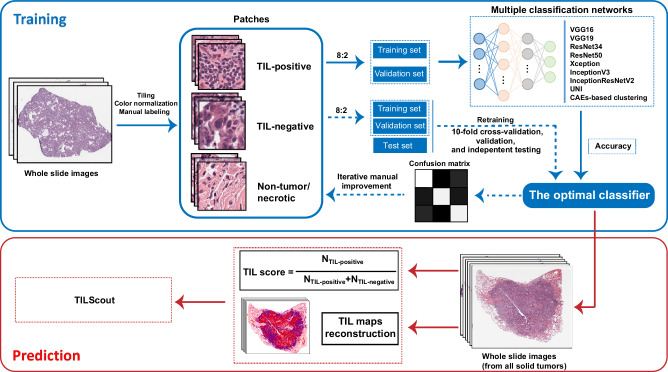
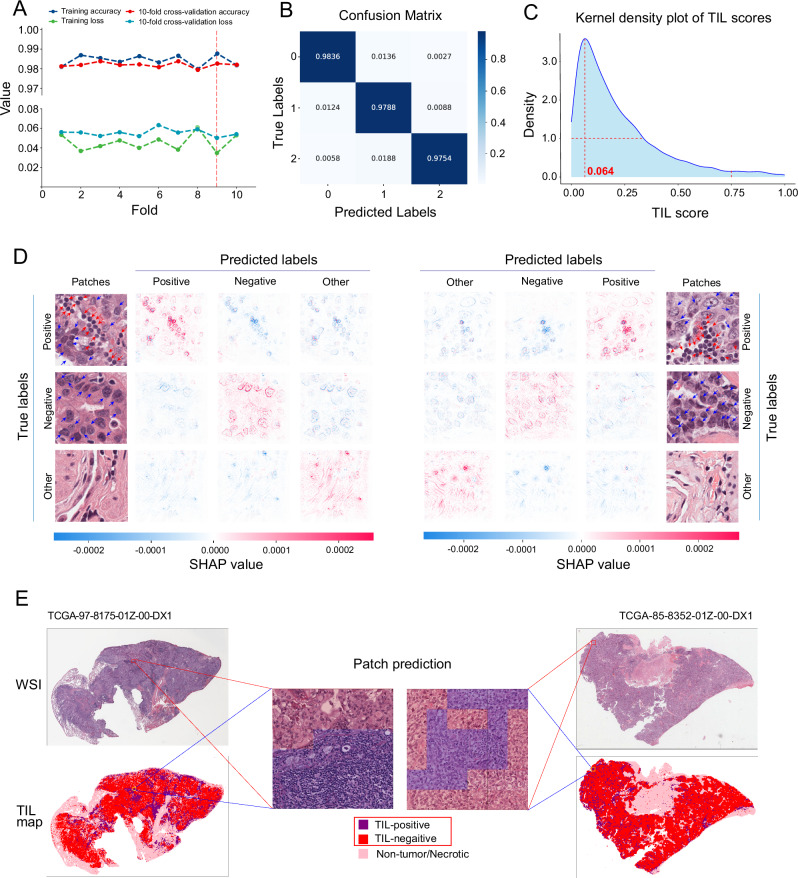
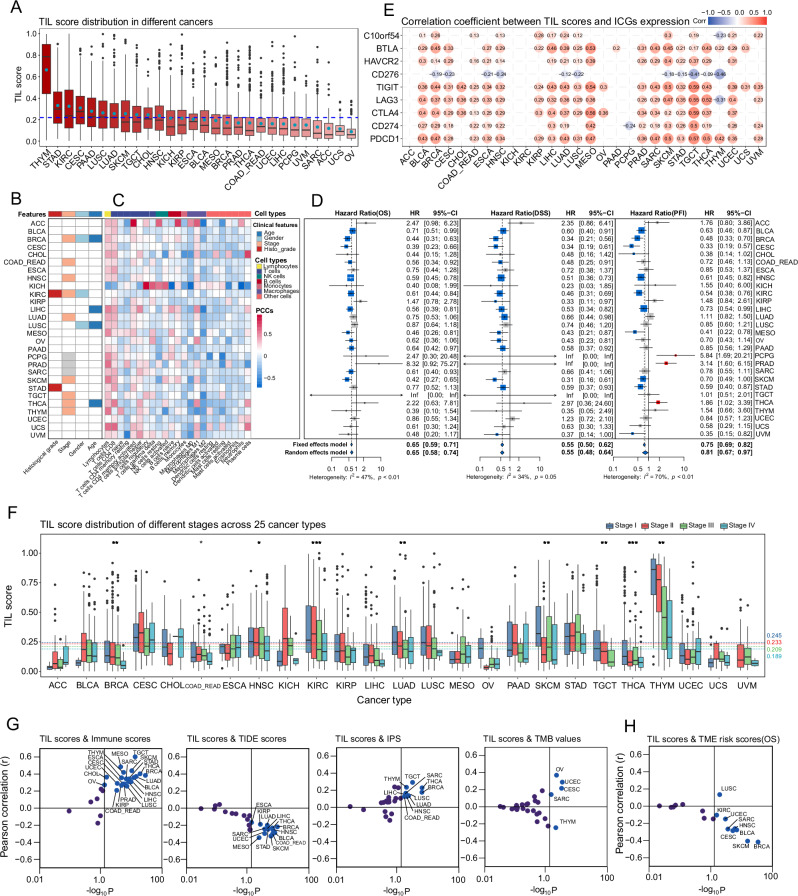
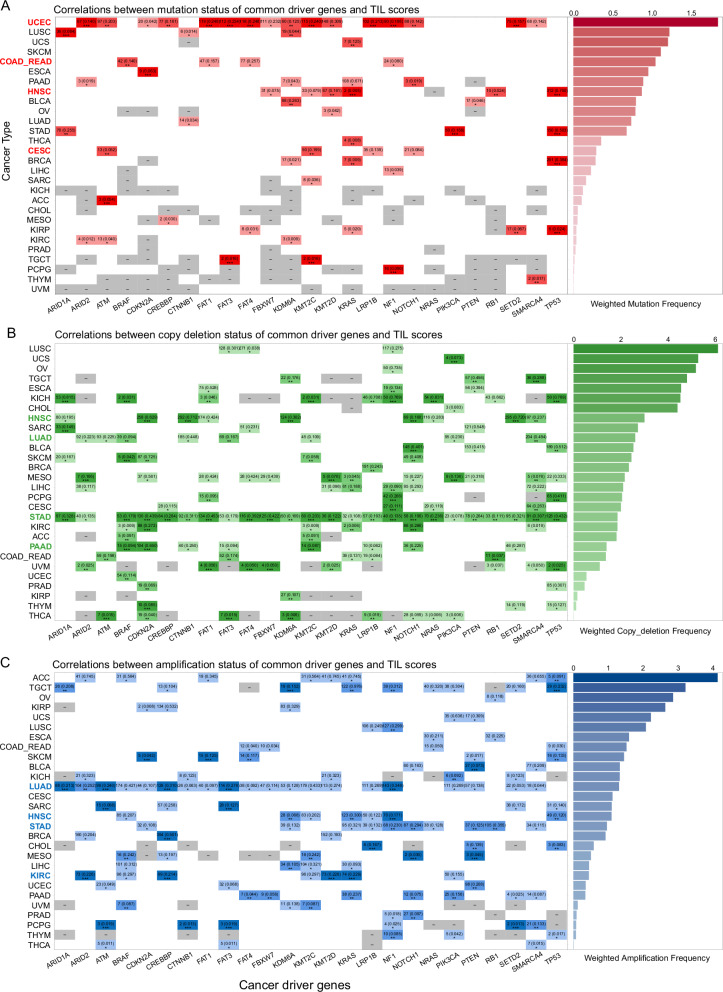
The density of tumor-infiltrating lymphocytes (TILs) serves as a valuable indicator for predicting anti-tumor responses, but its broad impact across various types of cancers remains underexplored. We introduce TILScout, a pan-cancer deep-learning approach to compute patch-level TIL scores from whole slide images (WSIs). TILScout achieved accuracies of 0.9787 and 0.9628, and AUCs of 0.9988 and 0.9934 in classifying WSI patches into three categories-TIL-positive, TIL-negative, and other/necrotic-on validation and independent test sets, respectively, surpassing previous studies. The biological significance of TILScout-derived TIL scores across 28 cancers was validated through comprehensive functional and correlational analyses. A consistent decrease in TIL scores with an increase in cancer stage provides direct evidence that the lower TIL content may stimulate cancer progression. Additionally, TIL scores correlated with immune checkpoint gene expression and genomic variation in common cancer driver genes. Our comprehensive pan-cancer survey highlights the critical prognostic significance of TILs within the tumor microenvironment.
© 2025. The Author(s).
Conflict of interest statement
Competing interests: The authors declare no competing interests.
Figures

Similar articles
-
Deep-Learning-Based Characterization of Tumor-Infiltrating Lymphocytes in Breast Cancers From Histopathology Images and Multiomics Data.JCO Clin Cancer Inform. 2020 May;4:480-490. doi: 10.1200/CCI.19.00126. JCO Clin Cancer Inform. 2020. PMID: 32453636 Free PMC article.
-
Deep Learning-Based Mapping of Tumor Infiltrating Lymphocytes in Whole Slide Images of 23 Types of Cancer.Front Oncol. 2022 Feb 16;11:806603. doi: 10.3389/fonc.2021.806603. eCollection 2021. Front Oncol. 2022. PMID: 35251953 Free PMC article.
-
Pathomics Image Analysis of Tumor Infiltrating Lymphocytes (TILs) in Colon Cancer.Res Sq [Preprint]. 2025 Apr 1:rs.3.rs-6173056. doi: 10.21203/rs.3.rs-6173056/v1. Res Sq. 2025. PMID: 40235501 Free PMC article. Preprint.
-
The molecular mechanism of actions and clinical utilities of tumor infiltrating lymphocytes in gastrointestinal cancers: a comprehensive review and future prospects toward personalized medicine.Front Immunol. 2023 Nov 24;14:1298891. doi: 10.3389/fimmu.2023.1298891. eCollection 2023. Front Immunol. 2023. PMID: 38077386 Free PMC article. Review.
-
The journey of tumor-infiltrating lymphocytes as a biomarker in breast cancer: clinical utility in an era of checkpoint inhibition.Ann Oncol. 2021 Oct;32(10):1236-1244. doi: 10.1016/j.annonc.2021.07.007. Epub 2021 Jul 24. Ann Oncol. 2021. PMID: 34311075 Review.
Cited by
-
Spatial features of tumor-infiltrating lymphocytes in primary lesions of lung adenocarcinoma predict lymph node metastasis.J Transl Med. 2025 Jul 25;23(1):842. doi: 10.1186/s12967-025-06860-1. J Transl Med. 2025. PMID: 40713757 Free PMC article.
-
Immuno-Oncology at the Crossroads: Confronting Challenges in the Quest for Effective Cancer Therapies.Int J Mol Sci. 2025 Jun 26;26(13):6177. doi: 10.3390/ijms26136177. Int J Mol Sci. 2025. PMID: 40649958 Free PMC article. Review.
-
Tumor-infiltrating lymphocytes in cancer immunotherapy: from chemotactic recruitment to translational modeling.Front Immunol. 2025 May 22;16:1601773. doi: 10.3389/fimmu.2025.1601773. eCollection 2025. Front Immunol. 2025. PMID: 40475782 Free PMC article. Review.
-
Comprehensive genomic and digital pathology profiling of tobacco-chewer female oral cancer patients simultaneously with integration of single-cell datasets identifies clinically actionable patient subgroups.Clin Transl Med. 2025 Jul;15(7):e70386. doi: 10.1002/ctm2.70386. Clin Transl Med. 2025. PMID: 40621643 Free PMC article. No abstract available.
References
-
- Wu, T. & Dai, Y. Tumor microenvironment and therapeutic response. Cancer Lett.387, 61–68 (2017). - PubMed
-
- Tramm, T. et al. Tumor-infiltrating lymphocytes predict improved overall survival after post-mastectomy radiotherapy: a study of the randomized DBCG82bc cohort. Acta Oncol.61, 153–162 (2022). - PubMed
Grants and funding
LinkOut - more resources
Full Text Sources
