. 2025 May;641(8061):232-239.
doi: 10.1038/s41586-025-08734-4. Epub 2025 Mar 19.

Sleep pressure accumulates in a voltage-gated lipid peroxidation memory

Affiliations

Sleep pressure accumulates in a voltage-gated lipid peroxidation memory

H Olof Rorsman et al. Nature. 2025 May.

Abstract

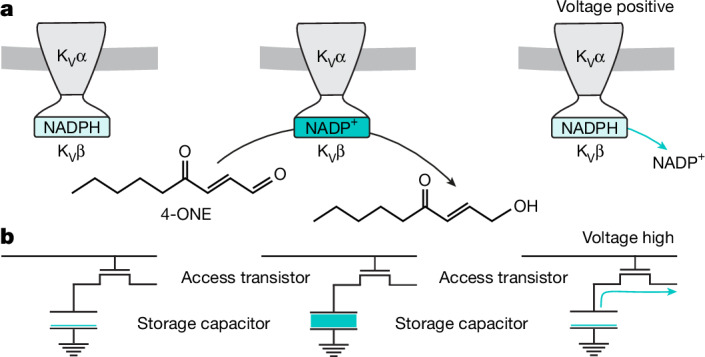
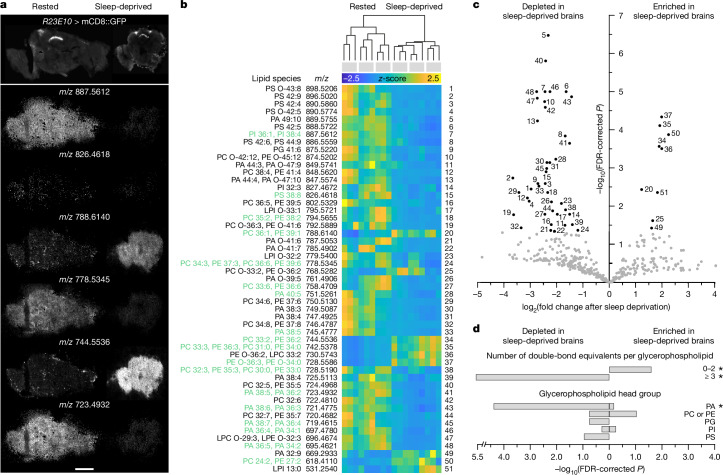
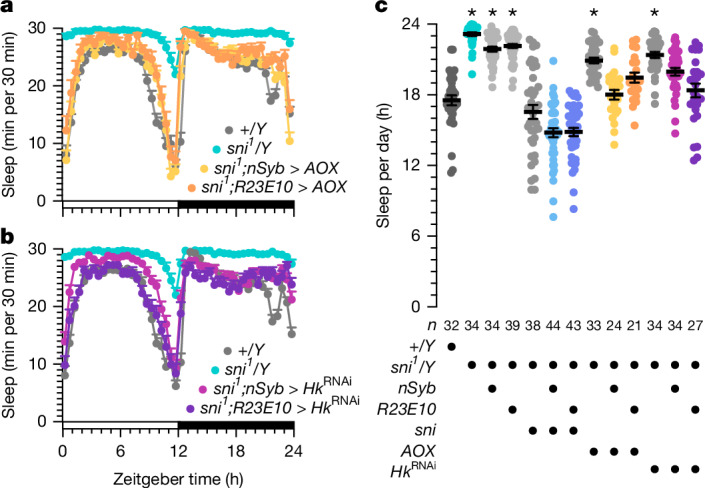
Voltage-gated potassium (KV) channels contain cytoplasmically exposed β-subunits1-5 whose aldo-keto reductase activity6-8 is required for the homeostatic regulation of sleep9. Here we show that Hyperkinetic, the β-subunit of the KV1 channel Shaker in Drosophila7, forms a dynamic lipid peroxidation memory. Information is stored in the oxidation state of Hyperkinetic's nicotinamide adenine dinucleotide phosphate (NADPH) cofactor, which changes when lipid-derived carbonyls10-13, such as 4-oxo-2-nonenal or an endogenous analogue generated by illuminating a membrane-bound photosensitizer9,14, abstract an electron pair. NADP+ remains locked in the active site of KVβ until membrane depolarization permits its release and replacement with NADPH. Sleep-inducing neurons15-17 use this voltage-gated oxidoreductase cycle to encode their recent lipid peroxidation history in the collective binary states of their KVβ subunits; this biochemical memory influences-and is erased by-spike discharges driving sleep. The presence of a lipid peroxidation sensor at the core of homeostatic sleep control16,17 suggests that sleep protects neuronal membranes against oxidative damage. Indeed, brain phospholipids are depleted of vulnerable polyunsaturated fatty acyl chains after enforced waking, and slowing the removal of their carbonylic breakdown products increases the demand for sleep.


Conflict of interest statement

Competing interests: M.A.M. and S.G. are employees of and B.S. is a consultant for TransMIT GmbH. The other authors declare no competing interests.

Figures

Fig. 1
Fig. 1. Information storage by KVβ.
a, The bits 0 (left) and 1 (centre) are stored in the cofactor oxidation state of the KVβ subunit. The memory is read out when the membrane potential across KVα depolarizes and KVβ discharges NADP+ (right). b, The bits 0 (left) and 1 (centre) are stored in the electrical charge on the capacitor of a DRAM cell. The memory is read out when the voltage across the access transistor gate goes high and the capacitor discharges (right).
Fig. 2
Fig. 2. Sleep deprivation depletes brain phospholipids of polyunsaturated fatty acids.
a, Example fluorescence (top) and positive-ion SMALDI-MS images (bottom) of cryosections containing dFBNs marked with mCD8::GFP. The sections were cut from rested (left) or sleep-deprived brains (right). SMALDI-MS images show, from top to bottom, the spatial distributions of phosphatidylinositol 18:2/20:2 (m/z 887.5612, [M+Na]+), phosphatidylserine 18:3/20:5 (m/z 826.4618, [M+Na]+), phosphatidylcholine 18:0/18:1 (m/z 788.6140, [M + H]+), phosphatidylcholine 18:3/18:3 (m/z 778.5345, [M + H]+), phosphatidylethanolamine 18:1/18:1 (m/z 744.5536, [M + H]+) and phosphatidic acid 18:2/20:3 (m/z 723.4932, [M + H]+). Scale bar, 200 μm. b, Hierarchical clustering of rested and sleep-deprived brains according to their glycerophospholipid profiles. Heat maps show the z-scored intensities of m/z signals differing with sleep history at an FDR-adjusted P < 0.05 (two-sided t-test). Lipids detected in MS2 fragmentation experiments are annotated in green in the list of molecular assignments on the left. Each column represents a different cryosection (n = 9 per condition); sections of the same brain (n = 3 per condition) are grouped by grey bars on top. c, Volcano plot of sleep history-dependent changes in 380 m/z signals annotated as glycerophospholipids. Signals with more than twofold intensity changes and FDR-corrected P < 0.05 (two-sided t-test) are indicated in black. Numerical labels reference data points to lipid annotations in b. d, Features overrepresented in the subset of 51 differentially abundant lipids against the background set of all 380 glycerophospholipids. Asterisks indicate significant enrichment scores (FDR-corrected P < 0.05, Fisher’s exact test). Because phosphatidylcholine and phosphatidylethanolamine lipids cannot be distinguished by exact mass alone, they are grouped as a single feature. LPC, lysophosphatidylcholine; LPE, lysophosphatidylethanolamine; LPI, lysophosphatidylinositol; PA, phosphatidic acid; PC, phosphatidylcholine; PE, phosphatidylethanolamine; PG, phosphatidylglycerol; PI, phosphatidylinositol; PS, phosphatidylserine; O-, alkyl ether linkage. Source Data
Fig. 3
Fig. 3. Lipid peroxidation products are intermediates in the signalling chain that couples mitochondrial electron transport to sleep.
a, The nSyb-GAL4- or R23E10-GAL4-driven expression of AOX in hemizygous sni1 mutant males fully or partially restores wild-type sleep (two-way repeated-measures ANOVA with Holm–Šídák test; sample sizes in c). The sleep profiles of sni1 mutants with pan-neuronal expression of AOX differ from those of sni1 mutants (P < 0.0001) but not of wild-type flies (P = 0.0589), whereas the sleep profiles of sni1 mutants with dFBN expression of AOX differ from those of both sni1 mutants (P < 0.0001) and wild-type flies (P = 0.0007). b, nSyb-GAL4- or R23E10-GAL4-restricted interference with the expression of Hyperkinetic in hemizygous sni1 mutant males partially or fully restores wild-type sleep (two-way repeated-measures ANOVA with Holm–Šídák test; sample sizes in c). The sleep profiles of sni1 mutants with pan-neuronal expression of HkRNAi differ from those of both sni1 mutants (P < 0.0001) and wild-type flies (P < 0.0001), whereas the sleep profiles of sni1 mutants with dFBN expression of HkRNAi differ from those of sni1 mutants (P < 0.0001) but not of wild-type flies (P = 0.1344). c, Sleep in hemizygous males carrying the sni1 allele differs from wild-type (P < 0.0001; Kruskal–Wallis ANOVA with Dunn’s test) but returns to or below control level if carriers also express sniffer (sni), AOX or HkRNAi pan-neuronally under the control of nSyb-GAL4 (sni: P = 0.1128; AOX: P > 0.9999; HkRNAi: P = 0.0601) or in dFBNs under the control of R23E10-GAL4 (sni: P = 0.1151; AOX: P = 0.6694; HkRNAi: P > 0.9999). Note that the expression of the UAS-sni transgene appears leaky, as the sleep phenotype of sni1 mutants is rescued in the absence of a GAL4 driver (P > 0.9999). Data are mean ± s.e.m.; n, number of flies; asterisks indicate significant differences (P < 0.05) from wild type in planned pairwise comparisons. For statistical details see Supplementary Table 1. Source Data
Fig. 4
Fig. 4. Lipid peroxidation products alter the inactivation kinetics of IA via the active site of KVβ.
a,b, The sni1 allele increases the fast and slow inactivation time constants of IA in dFBNs of hemizygous carriers (turquoise) relative to wild-type males (grey) (b; τfast: P = 0.0060, two-sided t-test; τslow: P = 0.0253, two-sided Mann–Whitney test; examples of peak-normalized IA evoked by voltage steps to +30 mV in a). c,d, dFBNs expressing miniSOG were held at –80 mV, except during the voltage protocols required to measure IA. A 9-min exposure to blue light between the 0- and 10-min time points (d; blue) increases the fast and slow inactivation time constants of IA above their pre-illumination baselines (d; τfast: P = 0.0133; τslow: P = 0.0041; repeated-measures ANOVA; examples of peak-normalized IA evoked in the same dFBN by voltage steps to +30 mV in c). e,f, dFBNs were held at −80 mV, except during the voltage protocols required to measure IA. The inclusion of 50 µM 4-ONE in the intracellular solution (f) increases the fast and slow inactivation time constants of IA above the baselines recorded immediately after break-in (f; τfast: P = 0.0015; τslow: P = 0.0010; mixed-effects model; examples of peak-normalized IA evoked in the same dFBN by voltage steps to +30 mV in e). g, dFBNs were held at –80 mV, except during the voltage protocols required to measure IA. At 10 min after break-in, the inclusion of 50 µM 4-ONE, but not of 200 µM 4-HNE, in the intracellular solution increases the fast and slow inactivation time constants of IA from control to sleep-deprived levels, provided dFBNs express catalytically competent Hyperkinetic (τfast: P < 0.0001; τslow: P < 0.0001; Kruskal–Wallis ANOVA). Columns show population averages; dots represent individual cells; n, number of cells; asterisks indicate significant differences (P < 0.05) relative to the 0-min time point or control levels in planned pairwise comparisons by Holm–Šídák or Dunn’s test. For statistical details see Supplementary Table 1. Source Data
Fig. 5
Fig. 5. Lipid peroxidation products increase the excitability of dFBNs via axonal KVβ.
ac, Example voltage responses to current steps (left) and voltage-spike frequency functions (right; mean ± s.e.m.) of dFBNs. In each neuron, the size of the unitary current step was adjusted to produce a 5-mV deflection from a resting potential of −60 ± 5 mV. The sni1 mutation steepens the voltage-spike frequency function of hemizygous carriers (turquoise, n = 11 cells) relative to wild-type males (grey, n = 10 cells) (a; genotype effect: P = 0.0003; current × genotype interaction: P < 0.0001; two-way repeated-measures ANOVA). Blue illumination for 9 min steepens the voltage-spike frequency function of dFBNs expressing miniSOG (blue, n = 6 cells) relative to controls kept in darkness (grey, n = 7 cells) (b; illumination effect: P = 0.0235; current × illumination interaction: P = 0.0008; two-way repeated-measures ANOVA). The inclusion of 50 µM 4-ONE in the intracellular solution (turquoise, n = 12 cells) does not steepen the voltage-spike frequency function relative to controls at the 10-min time point (grey, n = 10 cells) (c; 4-ONE effect: P = 0.9052; current × 4-ONE interaction: P = 0.7846; two-way repeated-measures ANOVA). df, Summed intensity projection of a stack of 22 confocal image planes (axial spacing 0.7973 µm) through the fan-shaped body of a fly carrying the HkFlag allele (d) and single confocal image planes through the somatic regions of flies carrying the HkFlag allele (e) or an unmodified Hk locus (f). Specimens were stained with anti-Flag antibody (left); native R23E10-GAL4-driven mCD8::GFP fluorescence (yellow) is overlaid on the anti-Flag channel (turquoise) on the right. Scale bars, 50 μm. For statistical details see Supplementary Table 1. Source Data
Fig. 6
Fig. 6. Membrane depolarization clears the lipid peroxidation memory.
a,b, dFBNs expressing miniSOG were held at –80 mV in the intervals of 0–10 and 30–40 min (except during the voltage protocols required to measure IA) and repeatedly step-depolarized to +10 mV (3 ms, 10 Hz) between 10 and 30 min. Nine-minute exposures to blue light (between the 0- and 10-min and the 30- and 40-min time points) increase the fast and slow inactivation time constants of IA above their pre-illumination baselines (b; blue versus grey shading); a series of depolarization steps between 10 and 30 min reverses this increase (b; yellow shading; τfast: P < 0.0001; τslow: P = 0.0008; mixed-effects model; examples of peak-normalized IA evoked in the same dFBN by voltage steps to +30 mV in a). c,d, dFBNs were held at −80 mV in the intervals of 0–10 and 30–40 min (except during the voltage protocols required to measure IA) and repeatedly step-depolarized to +10 mV (3 ms, 10 Hz) between 10 and 30 min. The inclusion of 50 µM 4-ONE in the intracellular solution increases the fast and slow inactivation time constants of IA above the baselines recorded immediately after break-in (d; turquoise versus grey shading); a series of depolarization steps between 10 and 30 min counteracts this increase despite the continuous presence of 4-ONE (d; yellow shading; τfast: P = 0.0053; τslow: P = 0.0012; mixed-effects model; examples of peak-normalized IA evoked in the same dFBN by voltage steps to +30 mV in c). Columns show population averages; dots represent individual cells; n, number of cells; asterisks indicate significant differences (P < 0.05) relative to the 0-min time point in planned pairwise comparisons by Holm–Šídák test. For statistical details see Supplementary Table 1. Source Data
Extended Data Fig. 1
Extended Data Fig. 1. Sleep architecture and waking locomotor activity of sni1 mutants.
a, The nSyb-GAL4- or R23E10-GAL4-driven overexpression of sniffer (over)corrects the altered sleep profile of hemizygous sni1 mutant males (P < 0.0001 for all pairwise comparisons, two-way repeated-measures ANOVA with Holm-Šídák test; sample sizes in b). b, The average sleep bout duration in hemizygous sni1 mutant males differs from wild-type (P < 0.0001; Kruskal-Wallis ANOVA with Dunn’s test) but returns to control level if carriers also express sniffer or AOX pan-neuronally under the control of nSyb-GAL4 (sni: P > 0.9999; AOX: P > 0.9999) or sniffer, AOX, or HkRNAi in dFBNs under the control of R23E10-GAL4 (sni: P > 0.9999; AOX: P = 0.1462; HkRNAi: P > 0.9999). The average sleep bout durations of 6 sni1 mutants exceeding 360 min are plotted at the top of the graph; mean and s.e.m. are based on the actual values. c, The number of sleep bouts in hemizygous sni1 mutant males differs from wild-type (P < 0.0001; Kruskal-Wallis ANOVA with Dunn’s test) but returns to control level if carriers also express sniffer or AOX pan-neuronally under the control of nSyb-GAL4 (sni: P > 0.9999; AOX: P > 0.9999) or sniffer, AOX, or HkRNAi in dFBNs under the control of R23E10-GAL4 (sni: P > 0.9999; AOX: P = 0.1492; HkRNAi: P > 0.9999). d, Hemizygous sni1 mutant males show elevated waking locomotor activity relative to wild-type (P < 0.0001; Kruskal-Wallis ANOVA with Dunn’s test). Data are means ± s.e.m.; n, number of flies; asterisks, significant differences (P < 0.05) from wild-type in planned pairwise comparisons. For statistical details see Supplementary Table 2. Source Data
Extended Data Fig. 2
Extended Data Fig. 2. Measurement of the inactivation time constants of IA.
a, Voltage steps from a holding potential of –110 mV (top) elicit the full complement of potassium currents in a dFBN (Itotal, bottom). b, Stepping the same neuron from a holding potential of –10 mV (top) elicits potassium currents lacking the A-type component (Inon-A, bottom). c, Digital subtraction of Inon-A (b, bottom) from Itotal (a, bottom) yields IA. Note the expanded timescale. d, Estimates of τfast and τslow are obtained from a double-exponential fit (red line) to the A-type current evoked by step depolarization to +30 mV.
Extended Data Fig. 3
Extended Data Fig. 3. Inactivation kinetics and amplitudes of potassium currents, series resistances, and steady-state activation and inactivation curves of IA during the course of a 30-minute recording.
a, dFBNs were held at –80 mV, except during the voltage protocols required to measure IA. In the absence of 4-ONE, the fast and slow inactivation time constants of IA (τfast: P = 0.2499; τslow: P = 0.5968; mixed-effects model), the amplitude of Inon-A (P = 0.3527; mixed-effects model), input resistance (P = 0.6543; mixed-effects model), and membrane time constant (P = 0.5196; mixed-effects model) remain unchanged, but the amplitude of IA runs down during the course of the recording (P = 0.0004; mixed-effects model). Columns, population averages; dots, individual cells; n, number of cells; asterisks, significant differences (P < 0.05) relative to baseline in planned pairwise comparisons. b, c, dFBNs were held at –80 mV in the interval of 0–10 min (except during the voltage protocols required to measure IA) and repeatedly step-depolarized to +10 mV (3 ms, 10 Hz) between 10 and 30 min. The inclusion of 50 µM 4-ONE in the intracellular solution increases the fast and slow inactivation time constants of IA above the baselines recorded immediately after break-in (b, turquoise vs. grey shading); a series of depolarization steps between 10 and 30 min counteracts this increase despite the continuous presence of 4-ONE (b, yellow shading; τfast: P = 0.0054; τslow: P = 0.0014; mixed-effects model). The amplitude of IA runs down during the course of the recording (b, P = 0.0008; mixed-effects model); Inon-A (b, P = 0.3120; mixed-effects model), input resistance (b, P = 0.4961; mixed-effects model), and membrane time constant (b, P = 0.2282; mixed-effects model) remain unchanged. Series resistance increases gradually (c, P = 0.0399; mixed-effects model) but remains within <20% of baseline and below 50 MΩ. Columns, population averages; dots, individual cells; n, number of cells; asterisks, significant differences (P < 0.05) relative to the 0-minute time point in planned pairwise comparisons by Holm-Šídák test. d, Steady-state activation and inactivation curves of IA in dFBNs immediately after break-in (0 min), after 10 min of dialysis with intracellular solution containing 50 µM 4-ONE (turquoise), and after a series of depolarization steps to +10 mV (3 ms, 10 Hz) between 10 and 30 min (yellow). Data are means ± s.e.m; solid lines, Boltzmann fits. The half-activation voltages and activation slope factors are identical at all time points (P = 0.5378, F test) but the half-inactivation voltages and inactivation slope factors differ (P < 0.0001, F test). For statistical details see Supplementary Table 2. Source Data
Extended Data Fig. 4
Extended Data Fig. 4. Potassium current amplitudes and membrane properties of dFBNs in Fig. 4.
a, dFBNs of hemizygous sni1 mutant (turquoise) and wild-type males (grey) do not differ with respect to the amplitudes of IA (P = 0.4023, two-sided Mann-Whitney test) and Inon-A (P = 0.6276, two-sided t-test), input resistance (P = 0.3014, two-sided t-test), and membrane time constant (P = 0.5267, two-sided Mann-Whitney test). b, dFBNs expressing miniSOG were held at –80 mV, except during the voltage protocols required to measure IA, and exposed to blue light between the 0- and 10-minute time points (blue shading). The amplitude of IA runs down during the course of the recording (P = 0.0003; Friedman test); Inon-A (P = 0.1116; Friedman test), input resistance (P = 0.4361; repeated-measures ANOVA), and membrane time constant (P = 0.3265; mixed-effects model) remain unchanged. c, dFBNs were held at –80 mV, except during the voltage protocols required to measure IA, and dialyzed with 50 µM 4-ONE (turquoise shading). The amplitude of IA runs down during the course of the recording (P = 0.0024; mixed-effects model); Inon-A (P = 0.2067; mixed-effects model), input resistance (P = 0.2942; mixed-effects model), and membrane time constant (P = 0.0783; mixed-effects model) remain unchanged. Columns, population averages; dots, individual cells; n, number of cells; asterisks, significant differences (P < 0.05) relative to the 0-minute time point in planned pairwise comparisons by Holm-Šídák or Dunn’s test. For statistical details see Supplementary Table 2. Source Data
Extended Data Fig. 5
Extended Data Fig. 5. Memory storage and erasure requires catalytically active KVβ.
a, b, dFBNs expressing a catalytically defective Hk(K289M) ‘rescue’ transgene in a homozygous Hk1 mutant background. The cells were held at –80 mV between 0 and 10 min (except during the voltage protocols required to measure IA) and repeatedly step-depolarized to +10 mV (3 ms, 10 Hz) between 10 and 30 min. The inclusion of 50 µM 4-ONE in the intracellular solution fails to increase the fast and slow inactivation time constants of IA above the baselines recorded immediately after break-in (b, turquoise vs. grey shading); a series of depolarization steps between 10 and 30 min is similarly without effect (b, yellow shading; τfast: P = 0.6841, repeated-measures ANOVA; τslow: P = 0.7852, Friedman test; examples of peak-normalized IA evoked in the same dFBN by voltage steps to +30 mV in a). The amplitude of IA runs down during the course of the recording (b, P = 0.0087; repeated-measures ANOVA); Inon-A (b, P = 0.6730; repeated-measures ANOVA), input resistance (b, P = 0.2615; repeated-measures ANOVA), and membrane time constant (b, P = 0.8143; repeated-measures ANOVA) remain unchanged. c, d, dFBNs expressing a catalytically competent Hk rescue transgene in a homozygous Hk1 mutant background. The cells were held at –80 mV between 0 and 10 min (except during the voltage protocols required to measure IA) and repeatedly step-depolarized to +10 mV (3 ms, 10 Hz) between 10 and 30 min. The inclusion of 50 µM 4-ONE in the intracellular solution increases the fast and slow inactivation time constants of IA above the baselines recorded immediately after break-in (d, turquoise vs. grey shading); a series of depolarization steps between 10 and 30 min counteracts this increase despite the continuous presence of 4-ONE (d, yellow shading; τfast: P = 0.0020; τslow: P < 0.0001; Friedman test; examples of peak-normalized IA evoked in the same dFBN by voltage steps to +30 mV in c). The amplitude of IA runs down during the course of the recording (d, P < 0.0001; repeated-measures ANOVA); Inon-A (d, P = 0.4334; repeated-measures ANOVA), input resistance (d, P = 0.5984; mixed-effects model), and membrane time constant (d, P = 0.9761; Friedman test) remain unchanged. Columns, population averages; dots, individual cells; n, number of cells; asterisks, significant differences (P < 0.05) relative to the 0-minute time point in planned pairwise comparisons by Holm-Šídák or Dunn’s test. For statistical details see Supplementary Table 2. Source Data
Extended Data Fig. 6
Extended Data Fig. 6. Potassium current amplitudes and membrane properties of dFBNs in Fig. 6.
a, dFBNs expressing miniSOG were held at –80 mV in the intervals of 0–10 and 30–40 min (except during the voltage protocols required to measure IA) and repeatedly step-depolarized to +10 mV (3 ms, 10 Hz) between 10 and 30 min. Nine-minute exposures to blue light (between the 0- and 10-minute and the 30- and 40-minute time points) leave Inon-A (P = 0.1673; mixed-effects model), input resistance (P = 0.0688; mixed-effects model), and membrane time constant (P = 3058; mixed-effects model) unchanged, but the amplitude of IA runs down during the course of the recording (P < 0.0001, mixed-effects model). b, dFBNs were held at –80 mV in the intervals of 0–10 and 30–40 min (except during the voltage protocols required to measure IA) and repeatedly step-depolarized to +10 mV (3 ms, 10 Hz) between 10 and 30 min. The cells were dialyzed with 50 µM 4-ONE in the intracellular solution (turquoise shading). The amplitude of IA runs down during the course of the recording (P < 0.0001; mixed-effects model); input resistance decreases after the series of depolarization steps (P = 0.0008; mixed-effects model); Inon-A (P = 0.6240; mixed-effects model) and membrane time constant (P = 0.1258; mixed-effects model) remain unchanged. Columns, population averages; dots, individual cells; n, number of cells; asterisks, significant differences (P < 0.05) relative to the 0-minute time point in planned pairwise comparisons by Holm-Šídák test. For statistical details see Supplementary Table 2. Source Data
Extended Data Fig. 7
Extended Data Fig. 7. Lipid peroxidation products alter the inactivation kinetics of IA in non-dFB neurons and cultured cells expressing mammalian KV1.4 and KVβ2.
a, Examples of peak-normalized transmembrane currents evoked by 1-s voltage pulses from –80 mV to +30 mV in a dFBN (grey) and a neuron of the pars intercerebralis (PI neuron) (black). A slowly activating outward current in the PI neuron interferes with an accurate measurement of τslow. b, c, PI neurons were held at –80 mV between 0 and 10 min (except during the voltage protocols required to measure IA) and repeatedly step-depolarized to +10 mV (3 ms, 10 Hz) between 10 and 30 min. The inclusion of 1 µM 4-ONE in the intracellular solution increases the fast inactivation time constant of IA above the baseline measured immediately after break-in (c, turquoise vs. grey shading); a series of depolarization steps between 10 and 30 min counteracts this increase despite the continuous presence of 4-ONE (c, yellow shading; P = 0.0009; Friedman test; examples of peak-normalized IA evoked in the same PI neuron by voltage steps to +30 mV in b). The amplitude of IA runs down during the course of the recording (c, P = 0.0075; repeated-measures ANOVA); Inon-A (c, P = 0.1035; repeated-measures ANOVA), input resistance (c, P = 0.4532; mixed-effects model), and membrane time constant (c, P = 0.4861; Friedman test) remain unchanged. d, e, PI neurons were held at –80 mV between 0 and 10 min (except during the voltage protocols required to measure IA) and repeatedly step-depolarized to +10 mV (3 ms, 10 Hz) between 10 and 30 min. In the absence of 4-ONE, the fast inactivation time constant of IA (e, P = 0.3416; mixed-effects model; examples of peak-normalized IA evoked in the same PI neuron by voltage steps to +30 mV in d), the amplitude of Inon-A (e, P = 0.3712; mixed-effects model), input resistance (e, P = 0.1304; mixed-effects model), and membrane time constant (e, P = 0.2109; mixed-effects model) remain unchanged, but the amplitude of IA runs down during the course of the recording (P = 0.0496; mixed-effects model). f, Examples of peak-normalized transmembrane currents evoked by 1-s voltage pulses from –80 mV to +30 mV in HEK-293 cells expressing mouse KV1.4 and KVβ2 (grey), or in untransfected HEK-293 cells (black). gj, HEK-293 cells expressing mouse KV1.4 and KVβ2. A 1-h exposure to 12 mM methylglyoxal, followed by three washes with methylglyoxal-free solution, increases the fast and slow inactivation time constants of transmembrane currents relative to those of cells maintained in the absence of methylglyoxal (h, j, turquoise vs. grey shading; τfast: P < 0.0001; τslow: P < 0.0001; two-sided Mann-Whitney test). In cells held at –80 mV (except during the voltage protocols required to measure IA), the time constants remain stably elevated for 20 min (h, τfast: P = 0.4375; τslow: P = 0.1875; two-sided Wilcoxon test; examples of peak-normalized currents in g), but a series of depolarization steps (3 ms, 10 Hz, 20 min) to +10 mV reverses the increase (j, yellow shading; τfast: P = 0.0294, two-sided paired t-test; τslow: P = 0.0137, two-sided Wilcoxon test; examples of peak-normalized currents in i). The amplitude of IA runs down during the course of the recording (P = 0.0429, two-sided paired t-test). Columns, population averages; dots, individual cells; n, number of cells; asterisks, significant differences (P < 0.05) relative to the 0-minute time point by Holm-Šídák or Dunn’s test. For statistical details see Supplementary Table 2. Source Data
Extended Data Fig. 8
Extended Data Fig. 8. SMALDI-MSI analysis of 4-ONE.
a, Mirror plot of mass spectra of 100 µM 4-ONE standard on a blank slide (top) or a brain cryosection (bottom). Spectra were acquired in single-ion-monitoring mode at the calculated m/z of the [4-ONE+GirT-H2O]+ ion (268.2020); peaks with a mass deviation <5 ppm are labelled in green type. b, The intensity of the [4-ONE+GirT-H2O]+ signal is decreased in cryosections of sleep-deprived brains (P = 0.0179, Kruskal-Wallis ANOVA) but not significantly altered in hemizygous sni1 mutant males (P = 0.0560). Intensities on the left are normalized to a 100 µM 4-ONE standard on a blank slide; the scale is expanded on the right. Columns, population averages; dots, individual cryosections; n, number of cryosections; asterisks, significant differences (P < 0.05) relative to rested wild-type flies in planned pairwise comparisons by Dunn’s test. For statistical details see Supplementary Table 2. Source Data

References

    1. Rehm, H. & Lazdunski, M. Purification and subunit structure of a putative K+-channel protein identified by its binding properties for dendrotoxin I. Proc. Natl Acad. Sci. USA85, 4919–4923 (1988). - PMC - PubMed
    1. Parcej, D. N., Scott, V. E. & Dolly, J. O. Oligomeric properties of α-dendrotoxin-sensitive potassium ion channels purified from bovine brain. Biochemistry31, 11084–11088 (1992). - PubMed
    1. Nakahira, K., Shi, G., Rhodes, K. J. & Trimmer, J. S. Selective interaction of voltage-gated K+ channel β-subunits with α-subunits. J. Biol. Chem.271, 7084–7089 (1996). - PubMed
    1. Long, S. B., Campbell, E. B. & MacKinnon, R. Crystal structure of a mammalian voltage-dependent Shaker family K+ channel. Science309, 897–903 (2005). - PubMed
    1. Pongs, O. & Schwarz, J. R. Ancillary subunits associated with voltage-dependent K+ channels. Physiol. Rev.90, 755–796 (2010). - PubMed

MeSH terms

LinkOut - more resources