. 2025 May;641(8062):465-475.
doi: 10.1038/s41586-025-08724-6. Epub 2025 Mar 19.

Dynamic cytoskeletal regulation of cell shape supports resilience of lymphatic endothelium

Affiliations

Dynamic cytoskeletal regulation of cell shape supports resilience of lymphatic endothelium

Hans Schoofs et al. Nature. 2025 May.

Abstract

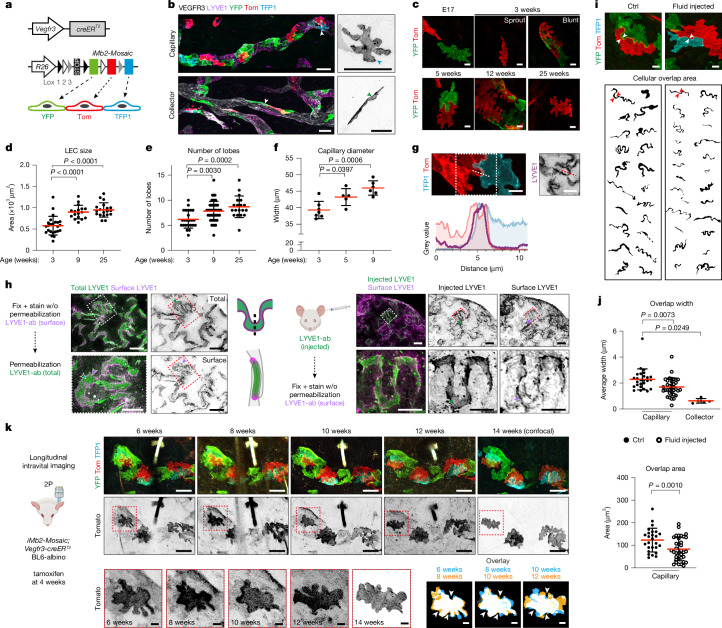
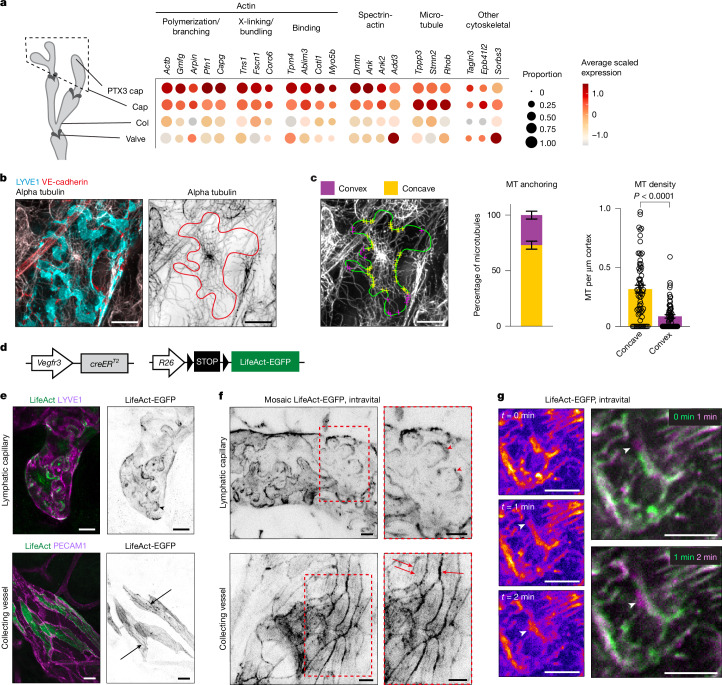
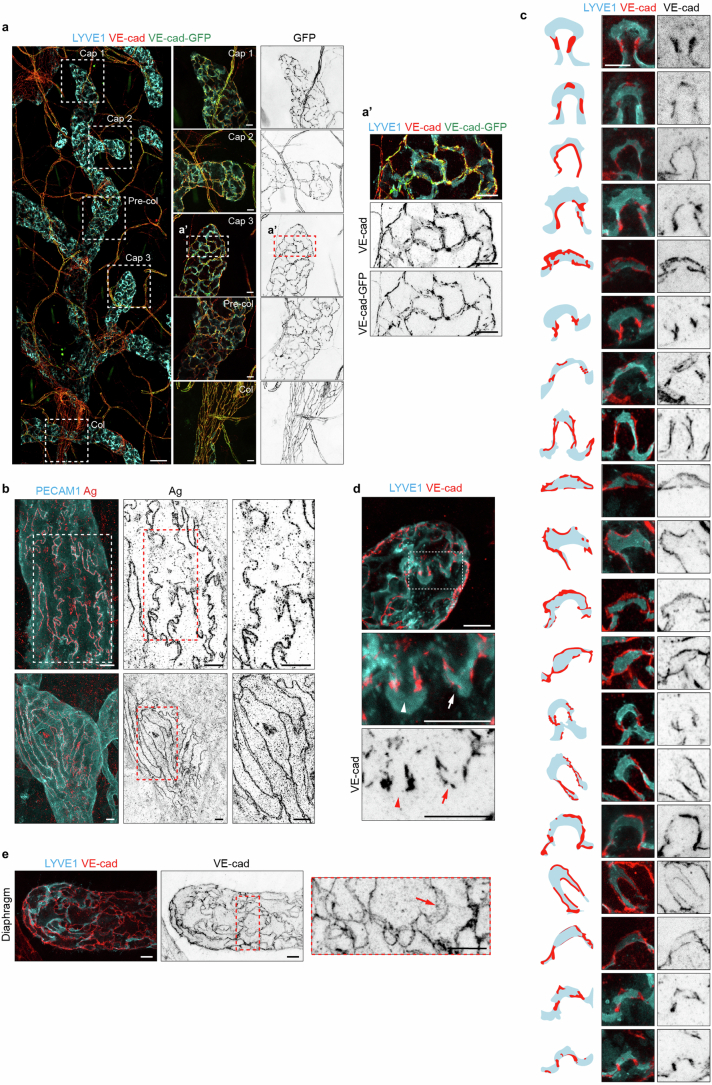
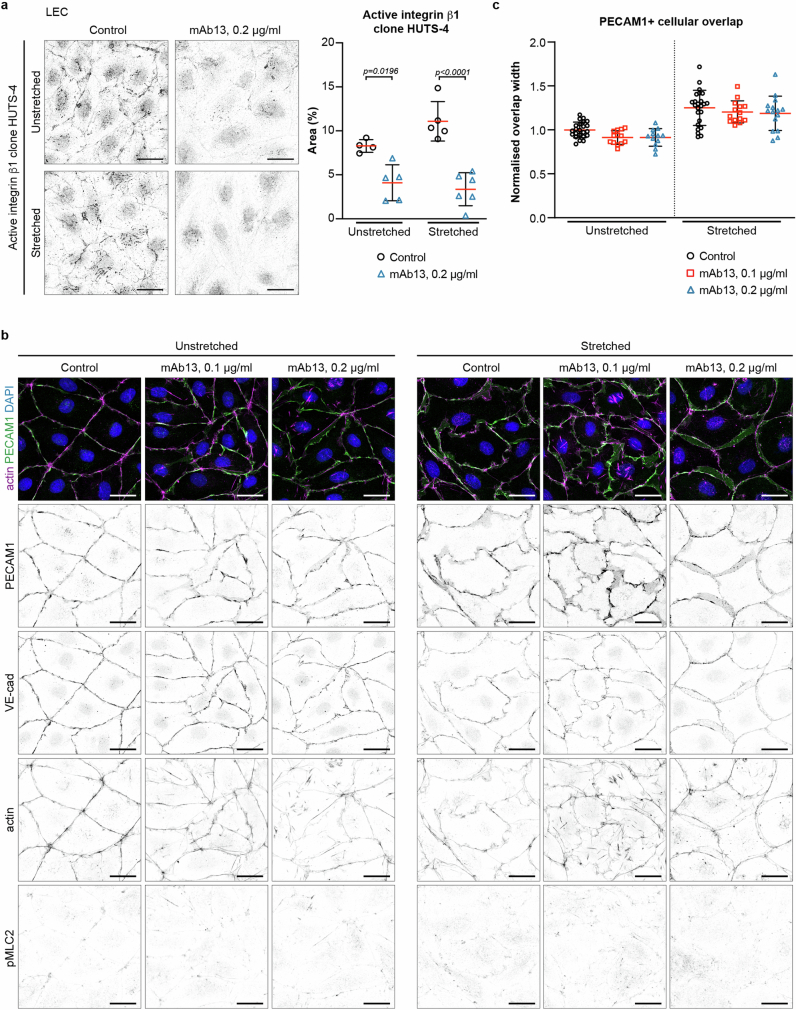
Lymphatic capillaries continuously take up interstitial fluid and adapt to resulting changes in vessel calibre1-3. The mechanisms by which the permeable monolayer of loosely connected lymphatic endothelial cells (LECs)4 maintains mechanical stability remain elusive. Here we identify dynamic cytoskeletal regulation of LEC shape, induced by isotropic stretch, as crucial for the integrity and function of dermal lymphatic capillaries. We found that the oak leaf-shaped LECs showed a spectrum of VE-cadherin-based junctional configurations at the lobular intercellular interface and a unique cytoskeletal organization, with microtubules at concave regions and F-actin at convex lobes. Multispectral and longitudinal intravital imaging of capillary LEC shape and actin revealed dynamic remodelling of cellular overlaps in vivo during homeostasis and in response to interstitial fluid volume increase. Akin to puzzle cells of the plant epidermis5,6, LEC shape was controlled by Rho GTPase CDC42-regulated cytoskeletal dynamics, enhancing monolayer stability. Moreover, cyclic isotropic stretch increased cellular overlaps and junction curvature in primary LECs. Our findings indicate that capillary LEC shape results from continuous remodelling of cellular overlaps that maintain vessel integrity while preserving permeable cell-cell contacts compatible with vessel expansion and fluid uptake. We propose a bellows-like fluid propulsion mechanism, in which fluid-induced lumen expansion and shrinkage of LEC overlaps are countered by actin-based lamellipodia-like overlap extension to aid vessel constriction.


Conflict of interest statement

Competing interests: F.L., S. Schurmann and O.F. have filed a patent application related to the MultiStretcher device as inventors (DPMA 10 2023 205 399.3). The other authors declare no competing interests.

Figures

Fig. 1
Fig. 1. Junctional heterogeneity in capillary LECs.
a, Whole-mount immunofluorescence of ear skin from a 25-week-old Cdh5-GFP mouse expressing VE-cadherin-GFP fusion protein (VE-cad). Boxed areas magnified below show unsegmented (arrows) and focal (arrowheads) VE-cadherin+ junctions in lymphatic capillary (left) and precollecting vessel (middle), and continuous zipper junctions in LYVE1 collecting vessel (right). b, Immunofluorescence in 12-week-old mouse ear skin showing VE-cadherin colocalization with CLDN5 at junctions. Line intensity profiles through lines 1 and 2 of respective stainings are depicted. c, Immunofluorescence at the indicated ages depicting junctional heterogeneity. Boxed areas are magnified. d,e, Quantification of lymphatic vessel sprouting (percentage of spiky ends of all lymphatic capillary ends, n = 7, 12 per respective stage, mean ± s.e.m.; d) and LEC proliferation (percentage Ki67+ of all LECs by flow cytometry, n = 3, 6, 8, 6 mice per respective stage, mean ± s.e.m.; e). f, Whole-mount silver nitrate (Ag) staining of ear dermis showing deposits around cell perimeter, including the lobe tips (arrow), with discontinuities (arrowhead). g, Immunofluorescence images of dermal capillary LEC lobes and schematics depicting idealized junctional categories (top), with frequencies within a terminal capillary end (bottom) represented as SuperPlot (n = 4–5 vessels each mouse, five mice per stage, in total n = 1,785 junctions, Supplementary Information). Mean (red line and percentage) of all measurements, large boxed colour-coded shapes represent weighted average for individual mice, smaller shapes individual frequencies at capillary ends from the respective animal. No significant differences between stages, analysed by one-way analysis of variance (ANOVA). Intensity plots of curvilinear and double junctions corresponding to lines across cell–cell contacts are depicted on the right. h, Frequency of junction types in 25-week-old mouse ear skin with or without intradermal (i.d.) injection of 20 µl of PBS. Data represent the percentage of all junctions (Ctrl, control, n = 468 from five mice; fluid injected: n = 118 from four mice). Scale bars, 10 µm (ac,f), 5 µm (g). Illustration in h created using BioRender (https://biorender.com). Source data
Fig. 2
Fig. 2. Morphology and remodelling of intercellular overlaps between capillary LECs.
a, Constructs for mosaic multicolour labelling of LECs using membrane-localized fluorescent proteins. b, Whole-mount immunofluorescence of mosaically labelled dermal LECs in a 6-week-old iMb2-Mosaic;Vegfr3-creERT2 mouse after 4-OHT treatment at 3 weeks, showing lobate shape in LYVE1+ capillaries and elongated shape in LYVE1 collectors (arrowheads). c, Whole-mount immunofluorescence of embryonic back skin (E17) or ear skin at indicated postnatal stages in iMb2-Mosaic;Vegfr3-creERT2 mice. df, Dermal LEC and vessel parameters, represented as mean ± s.d.: cell size (d, n = 24, 17 and 20 cells per respective stage), lobe number (e, n = 24, 48 and 20 cells per respective stage) and average lymphatic capillary width (f, n = 7, 5 and 9 mice per respective stage). Ordinary one-way ANOVA. g, Immunofluorescence of ear skin of a 12-week-old iMb2-Mosaic;Vegfr3-creERT2 mouse showing LYVE1 at LEC overlaps, with corresponding intensity plot. h, Double staining for cell surface and total LYVE1 (left), or with intradermally injected LYVE1 antibody (right) to visualize intercellular overlaps. w/o, without. i,j, Visualization (i) and quantification (j) of cellular overlap width (top, j) and area (bottom, j) in control and PBS-injected ears in iMb2-Mosaic;Vegfr3-creERT2 mice. Two individual cells and their overlap (arrowheads) are shown as binary images. In j, n = 26 overlaps from four mice (Ctrl capillary), 35 overlaps from four mice (Fluid injected capillary), five overlaps from two mice (collector), represented as mean ± s.d. Ordinary one-way ANOVA (width), two-sided Mann–Whitney U-test (area). k, Intravital imaging of capillary LECs in adult iMb2-Mosaic;Vegfr3-creERT2 BL6-albino mice showing remodelling of LEC lobes over time. Cell magnified below (left, red boxes) shown by two-colour overlay of indicated time points (right) show changes in lobes whereas concave areas (arrowheads) show minimal changes. Scale bars, 50 µm (b,k(top)), 10 µm (c,g,h,i,k(bottom)). Credits: schematic in a adapted from ref. under a CC BY 4.0 licence; illustrations in h and k created using BioRender (https://biorender.com). Source data
Fig. 3
Fig. 3. Cytoskeletal organization in lobate capillary LECs.
a, Dot plot showing differential expression of cytoskeletal genes between capillary and collecting vessel LECs. Dot size illustrates percentage of cells with transcript counts, colour illustrates average expression (log2-fold difference). Cap, lymphatic capillary; Col, collecting vessel. b, Whole-mount immunofluorescence of adult ear skin showing microtubule network in dermal capillary LECs. Cell outline, based on VE-cadherin and LYVE1 staining, in red. c, Quantification of microtubule (MT) anchoring and density in capillary LECs in 9–12-week-old mice. Cell outline from c in green, with MT endpoints shown by yellow (concave) and purple (convex) dots. Data represent the percentage of MT anchoring (left; n = 5 LECs from five mice, 20–53 MT per cell), or MTs per µm of cortex in concave (right; n = 156 MTs, 5 LECs from five mice) versus convex (n = 56 MTs, 5 LECs from five mice) regions (mean ± s.e.m.). Two-sided Mann–Whitney U-test. d, Constructs for LEC-specific visualization of F-actin using LifeAct-EGFP. e,f, Actin cytoskeleton in LECs from tamoxifen-treated adult LifeAct-EGFP;Vegfr3-creERT2 mice after tissue fixation (e) and intravital imaging (f). Tamoxifen was administered at 6 weeks and ears analysed at 8 weeks of age. Note the enrichment of LifeAct-EGFP in capillary LEC lobes (arrowheads), and cortical actin and stress fibres in collecting vessel LECs (arrows). Boxed areas in f are magnified. g, Intravital imaging of actin dynamics in Lifeact-EGFP;Vegfr3-creERT2 BL6-albino mice. Individual stills (left) and two-colour overlay of stills (right) from Supplementary Videos 3 and 4 show actin remodelling in LEC lobe borders (arrowheads) at the indicated time points (min). Scale bars, 10 µm (b,c,eg). Source data
Fig. 4
Fig. 4. CDC42 in the homeostatic maintenance of LEC cytoskeleton, cell shape and vessel integrity.
a, Scheme for LEC-specific Cdc42 deletion in mature vasculature using Prox1-creERT2 mice. b, Actin (LifeAct-EGFP) and microtubule (alpha-tubulin staining) networks in ear skin whole-mounts from Cdc42flox;LifeAct-EGFP;Prox1-creERT2 mice. c,d, Quantification of microtubule (MT) anchoring (c) and density (d) in capillary LECs in control (Ctrl) and Cdc42-deficient (Mut) mice, mean ± s.e.m. (Ctrl, n = 100 MTs (9 weeks) or n = 112 (12 weeks); Mut, n = 154 MTs (9 weeks) or n = 281 (12 weeks) from 5–7 LECs/2–3 mice each (Supplementary Information). Two-tailed Fisher’s exact test (c); two-tailed unpaired Student’s t-test (d). eh, Visualization (e,g) and quantification (f,h) of cell morphology, cellular overlaps and junctions in control and Cdc42-deficient mice, showing intercellular separations in the latter (arrowhead). Images in g are from mice carrying the iMb2-Mosaic reporter and Cdc42flox/+ control (top), or without a reporter and wild-type control (bottom). In f, n = 25 overlaps from four mice (Ctrl), n = 30 overlaps from four mice (Mut); in h n = 8 (139) (Ctrl) and n = 13 (231) (Mut) vessels (total junctions). Two-sided Mann–Whitney U-test. i, LYVE1 staining in lymphatic capillaries of control and Cdc42-deficient mice without permeabilization (cell surface LYVE1, cyan arrowheads) and with permeabilization (total LYVE1, red arrowheads). Boxed areas are magnified below. In f, h, data represent mean ± s.d. Two-sided Mann–Whitney U-test. Scale bars, 10 µm (b,e,g,i(overviews)), 5 µm (i(magnifications)). Source data
Fig. 5
Fig. 5. Modelling the effects of mechanical stress on LEC monolayers.
a, Morphological dimensions of a vessel used for FEM simulations. Ext, external wall pressure; int, internal wall pressure. b, FEM simulations of cellular stresses on a puzzle-shaped cell template from confocal data (top), or simple-shaped template with equivalent cells size and connectivity (bottom). c, Cellular stress patterns from FEM simulations under external pressure. Colour scale shows stress levels (kPa). d, Schematic of the isotropic stretching device with elastic PDMS chambers and area change (ΔA, dotted line). e,f, Immunofluorescence of human dermal LECs showing stretch-induced increase in PECAM1+ overlaps (arrow) compared to unstretched control (Ctrl), blocked by CDC42 inhibitor ML141. Actin (SPY-555), nuclear (DAPI) (e,f) and VE-cadherin (f) stainings are shown. Arrowheads indicate intercellular separations. g, Prolonged (22 h) stretch-induced changes in LEC shape with magnified views below. hj, Quantification of junction linearity index (ratio of junction contour length to straight-line junction length; n = 38, 43 images; 1 experiment) (h), cellular overlaps (n = 13, 19, 12, 16 images; 2–3 experiments) (i) and intercellular separations (n = 32, 34, 6, 8, 24, 29 images; 2–3 experiments) (j). Data represent mean ± s.d. Ordinary one-way ANOVA. k, Optogenetic CDC42 activation using improved light-induced dimer (iLID) for membrane recruitment of catalytically active RhoGEF ITSN1 (left) and cell area changes in LECs with and without photoactivation (10 min, dashed blue box), quantified on the right. Data represent mean ± s.e.m. (n = 5 cells, no activation; n = 6 cells, photoactivation). Two-tailed unpaired Student’s t-test. l, Electrical resistance measurements of LEC monolayers with (pink) or without (green) OptoITSN1 photoactivation (cyan bar), using ECIS. Thick lines represent mean (n = 4 wells), with 95% CI. Scale bars, 20 µm (b,c(vessels)), 10 µm (c(cross sections),k), 50 µm (e,f), 25 µm (g(overviews)), 5 µm (g(magnifications)). Schematic in k adapted from ref. under a CC BY 4.0 licence. Source data
Extended Data Fig. 1
Extended Data Fig. 1. Junctional heterogeneity in capillary LECs.
(a) Whole-mount immunofluorescence of lymphatic vessels in the ear skin of a 25-week-old Cdh5-GFP mouse expressing VE-cadherin-GFP fusion protein. Boxed areas are magnified on the right (Cap 2, Pre-col and Col also in Fig. 1a) and in a’ as indicated. Note the overlap of VE-cadherin-GFP signal with VE-cadherin immunostaining. Similar results were obtained from 5 mice in two independent experiments. (b) Whole-mount silver nitrate (Ag) staining of mouse ear dermis showing depositis around cell perimeter in lymphatic capillaries (top) and collecting vessels (bottom). Boxed areas are magnified on the right. Similar results were obtained from 4 mice in two independent experiments. (c) Whole-mount immunofluorescence of individual dermal capillary LEC lobes with corresponding schematic drawings, showing a spectrum of VE-cadherin+ junctional arrangements within initial regions of adult lymphatic capillaries. Similar results were obtained from 15 mice in three independent experiments. (d, e) Whole-mount immunofluorescence of ear skin (3 wk, d) and diaphragm (25 wk, e) of a wild-type mouse showing junctional heterogeneity, with buttons (arrowheads) as well as curvilinear and double junctions (arrows). Similar results were obtained from 15 mice in three independent experiments. Boxed areas are magnified below (d) and on the right (e). Scale bar: 50 µm (a, overview), 10 µm (a, a’, b, c, d, e).
Extended Data Fig. 2
Extended Data Fig. 2. Analysis of LEC overlaps.
(a, b) Whole-mount immunofluorescence of lymphatic capillaries in iMb2-Mosaic;Vegfr3-CreERT2 mice, showing a transition in LYVE1 expression, cell shape and junction morphology within a sprout tip (a, 3-week-old), and large intercellular overlaps between neighboring capillary LECs (b, 9-week-old). Similar results were obtained from 4 mice in two independent experiments (a) or 5 mice in three independent experiments (b). (c) Minimum and maximum perpendicular width of extracted overlaps from control mice (from Fig. 2i), represented as mean ± s.d. (left) or as minimum/maximum range within individual overlaps (right) (n = 16 overlaps from 4 mice in two independent experiments). No statistical testing was performed. (d) TEM analysis of LEC contacts showing variable morphology and junctional organization. Red arrowheads point to electron dense junctions. Boxed areas are magnified below. Similar results were obtained from 3 mice. (e) Quantification of the length of overlaps from TEM data, below a 4 µm cut off, represented as mean ± s.d. (n = 34 overlaps from 3 mice). Scale bar: 10 µm (a, b), 500 nm (d). Source data
Extended Data Fig. 3
Extended Data Fig. 3. Extended longitudinal intravital imaging of capillary LECs.
(a) Longitudinal intravital imaging of an iMb2-Mosaic;Vegfr3-CreERT2 BL6-albino mouse over an extended observational period of 29 weeks. Boxed areas are magnified below. Similar results were obtained from 5 mice over a follow-up period of 8 weeks in two independent experiments, and one mouse over a follow-up period of 35 weeks. (b) Intravital imaging of collecting vessel LECs in an iMb2-Mosaic;Vegfr3-CreERT2 BL6-albino mouse showing no noticeable cell shape changes. Similar findings were obtained from 5 mice in two independent experiments. Scale bar: 50 µm (a, b). Illustration in a created using BioRender (https://biorender.com).
Extended Data Fig. 4
Extended Data Fig. 4. F-actin localisation in LECs of lymphatic capillaries and collecting vessels.
(a) Visualization of F-actin in LECs from adult iMb2-Mosaic;LifeAct-EGFP;Vegfr3-CreERT2 mice with intensity plots corresponding to the boxed areas. Note F-actin enrichment in LYVE1+ lobe of capillary LEC and narrow actin peaks colocalised with VE-cadherin in collecting vessel LECs. Similar results were obtained from 3 mice in two independent experiments. (b) Comparison of actin and microtubule organization in lobate puzzle cells of plant epidermis and capillary LECs. Scale bar: 10 µm (a).
Extended Data Fig. 5
Extended Data Fig. 5. Characterisation of cellular defects in Cdc42-deficient lymphatic capillaries.
(a) Whole-mount immunofluorescence of lymphatic capillaries in control (flox/+) and Cdc42-deficient (flox/flox) mice expressing the iMb2-Mosaic reporter. Tamoxifen was administered at 6 weeks and ears analyzed at 9 or 12 weeks of age as indicated. Similar findings were obtained from n = 8 mice (flox/+), n = 4 mice (flox/flox 9 weeks) and n = 4 mice (flox/flox 12 weeks). (b) Whole-mount immunofluorescence of LEC overlaps and junctions, showing LYVE1 areas within the overlap regions (arrowheads) in Cdc42-deficient vessels. Similar results were obtained from 3 mice in two independent experiments. (c-e) TEM analysis of LEC overlaps in Cdc42-deficient mice two weeks after tamoxifen administration. Whole vessel overview (c, left) and high magnification of a cell-cell contact in boxed area, showing intercellular separation at the overlap region (c, right; d, asterisks), quantified in (e). Red arrowheads in (d) point to electron dense junctions. Mean ± s.d., n = 18 junctions from 4 mice (Ctrl) and n = 10 junctions from 4 mice (Mut) in two independent experiments. Ordinary one-way ANOVA. (f) Clearance of intradermally injected tracer (1 µl, 150 kDa TRITC-dextran) in 11-week-old control (Ctrl) and Cdc42 deficient (Mut) mice 5 weeks post-tamoxifen, normalized to initial intensity at timepoint 0 (mean ± s.d., n = 8 mice (Ctrl) and n = 6 mice (Mut) in two independent experiments). Two-sided Mann Whitney U test. Scale bar: 50 µm (a), 1 µm (b, c, magnification), 20 µm (c, overview), 0.5 µm (d), 1 mm (f). Source data
Extended Data Fig. 6
Extended Data Fig. 6. Characterisation of collecting lymphatic vessels in Cdc42-deficient mice.
(a-c) Whole-mount immunofluorescence of control (flox/+) and Cdc42-deficient (flox/flox) collecting vessels in 12-week-old Cdc42flox;LifeAct-EGFP;Prox1-CreERT2 mice (6 weeks after tamoxifen treatment). Overall vessel morphology (n = 4 mice per genotype in two independent experiments) (a), as well as junctional VE-cadherin organization (n = 4 mice per genotype in two independent experiments) (b) and microtubule cytoskeleton (n = 2 mice (flox/+) and n = 3 mice (flox/flox)) (c) of LECs are unaltered upon Cdc42 deletion, while more diffuse localization of actin and loss of cortical actin are observed in both fixed (a, b) and intravitally imaged samples (bottom panel in b, n = 4 mice (flox/+) and n = 2 mice (flox/flox)). (d) Immunofluorescence analysis of cell shape in 9- and 12-week-old Cdc42flox;iMb2-Mosaic;Prox1-CreERT2 mice (3 or 6 weeks after tamoxifen treatment) showing overall normal LEC morphology but presence of small membrane protrusions in mutant mice. Similar findings were obtained from n = 8 mice (flox/+), n = 4 mice (flox/flox 9 weeks) and n = 4 mice (flox/flox 12 weeks). Scale bar: 50 μm (a, b, d), 10 μm (c).
Extended Data Fig. 7
Extended Data Fig. 7. LEC-specific deletion of Cldn5 or Itgb1 in adult mice does not disrupt the integrity of lymphatic capillaries.
(a) Experimental scheme for LEC-specific deletion of Cldn5 in mature vasculature using the Prox1-CreERT2 mice. (b) Whole-mount immunofluorescence of ear skin from a 11-week-old Cldn5flox;Prox1-CreERT2 mice (5 weeks after tamoxifen treatment). Cldn5 mutant mice show efficient depletion of CLDN5 in LECs, but no effects on their lobate shape (LYVE1 staining) or organization of cell-cell junctions (VE-cadherin staining) compared to a control. Similar results were obtained from 3 mice per genotype in two independent experiments. (c) Experimental scheme for LEC-specific deletion of Itgb1 in mature vasculature using the Vegfr3-CreERT2 mice. (d) Whole-mount immunofluorescence of ear skin from 12- and 16-week-old Itgb1flox;Vegfr3-CreERT2 mice (6 or 10 weeks after tamoxifen treatment). Itgb1 mutant mice (n = 3 per stage) show efficient depletion of active integrin β1 in LECs, but no effects on their lobate shape (LYVE1 staining) or organization of cell-cell junctions (VE-cadherin staining) compared to a Cre- littermate control (n = 3 per stage) (e). Scale bar: 10 µm (b, d, e).
Extended Data Fig. 8
Extended Data Fig. 8. Modelling of cellular stresses on LECs.
(a) Model of lymphatic vessel used for finite element method (FEM) simulations of cellular stresses on a puzzle-shaped cell template extracted from confocal data (upper panel), or simple shaped template with the same average cells size and the same connectivity of the neighbours with cell area matching in vivo measurements (lower panel). Cellular stress patterns from FEM simulations in the absence of wall pressure are shown on the right. Color scale indicated mechanical stress in kPa. (b) Immunofluorescence of primary LECs showing a spectrum of VE-cadherin+ junctional arrangements after isotropic stretching for 14 h. Similar results were obtained in 11 independent experiments. Scale bar: 20 µm (a, vessels), 10 µm (a, cross sections), 5 µm (b).
Extended Data Fig. 9
Extended Data Fig. 9. Effect of CDC42 silencing on isotropic stretch-induced cellular changes in LECs in vitro.
(a) Immunoblotting of protein lysates from unstretched LECs cultured in PDMS stretch chambers, showing reduced CDC42 levels 48 h after siRNA-mediated silencing compared to control siRNA (siScramble). Graph on the right depicts quantification of CDC42 levels relative to GAPDH (n = 2 independent experiments). For gel source data, see Supplementary Fig. 1. No statistical test was performed. (b) Experimental scheme for assessing the effect of isotropic stretch on CDC42-silenced LECs. (c) Representative brightfield images of LECs cultured in PDMS chambers without stretching before siRNA transfection, and 34 h and 48 h post transfection, showing maintenance of monolayer integrity in unstretched CDC42-silenced LECs during the experimental time frame. (d) Immunofluorescence of primary LECs showing isotropic stretch-induced monolayer disruption selectively in CDC42-silenced LECs, quantified in Fig. 5j. Similar results were obtained in 4 independent experiments. Scale bar: 100 µm (c), 50 µm (d). Source data
Extended Data Fig. 10
Extended Data Fig. 10. Effect of integrin β1 inhibition on isotropic stretch-induced cellular changes in LECs in vitro.
(a) Immunofluorescence staining (left) and quantification (right) of active integrin β1 (visualized using antibody clone HUTS-4) in unstretched and stretched (14 h) primary LECs, showing successful integrin β1 inhibition using a function-blocking antibody (mAb13, 0.2 μg/ml). Data on the right represent area of positive signal, shown as mean ± s.d. (Unstretched ctrl: n = 4 [2], Unstrectched mAb13: n = 5 [2], Stretched ctrl: n = 5 [1], Stretched mAb13: n = 6 [2] images [independent stretch holders] from one experiment). Ordinary one-way ANOVA. (b) Immunofluorescence of primary LECs showing the effect of isotropic stretch (14 h) on PECAM1+ cellular overlaps and the curvature of VE-cadherin+ cell-cell junctions compared to unstretched controls, not inhibited by integrin β1 blockade. Actin (SPY-555) and pMLC2 staining reveal no apparent stretch-induced changes. (c) Quantification of PECAM1+ overlap width after functional blockage of integrin β1 (0.1 μg/ml or 0.2 μg/ml mAb13) in unstretched and stretched HDLECs. Data represent mean ± s.d. (Unstretched ctrl: n = 23 [3], mAb13 0.1 µg/ml: n = 13 [3], mAb13 0.2 µg/ml: n = 12 [3]; Stretched ctrl: n = 24 [3] mAb13 0.1 µg/ml: n = 14 [3], mAb13 0.2 µg/ml: n = 15 [3], images [independent stretch holders] from three independent experiments), Brown-Forsythe and Welch ANOVA. Scale bar: 25 µm (a, b). Source data
Extended Data Fig. 11
Extended Data Fig. 11. Effect of isotropic stretch on HUVECs in vitro.
(a) Immunofluorescence of primary HUVECs showing isotropic stretch (14 h)-induced VE-cadherin+ finger-like protrusions (red arrows) compared to unstretched control. Note that the VE-cadherin staining in HUVECs extends across the entire overlap region under both unstretched and stretched conditions, in contrast to the narrow line of VE-cadherin observed in LECs (Extended Data Fig. 10). (b) Quantification of PECAM1+ cellular overlap width. Dots represent quantified images (Unstretched n = 4, Stretched n = 6) from one experiment, including two independent stretch chambers per condition, shown as mean ± s.d., two-tailed Unpaired t-test. Scale bar: 50 µm (a). Source data
Extended Data Fig. 12
Extended Data Fig. 12. Proposed mechanism of lymphatic capillary function driven by dynamic remodelling of LEC overlaps.
Puzzle-shaped capillary LECs have dynamic LYVE1+ cellular overlaps associated with a spectrum of junctional configurations organized as punctate buttons, as well as segmented or unsegmented double junctions and curvilinear junctions. Increase in interstitial fluid results in shortening of LEC overlaps to facilitate the expansion of vessel lumen upon fluid uptake. This is countered by CDC42-mediated cytoskeletal remodelling that drives the extension of lamellipodia-like cellular overlaps and consequent increase in monolayer integrity and barrier strength. Further potential implication of this model is a bellows-like mechanism, where an increase in capillary LEC overlaps aids in compressing the vessel to facilitate fluid propulsion.

References

    1. Stritt, S., Koltowska, K. & Mäkinen, T. Homeostatic maintenance of the lymphatic vasculature. Trends Mol. Med.27, 955–970 (2021). - PubMed
    1. Petrova, T. V. & Koh, G. Y. Biological functions of lymphatic vessels. Science369, eaax4063 (2020). - PubMed
    1. Grimm, L. & Hogan, B. M. Network patterning, morphogenesis and growth in lymphatic vascular development. Curr. Top. Dev. Biol.143, 151–204 (2021). - PubMed
    1. Baluk, P. et al. Functionally specialized junctions between endothelial cells of lymphatic vessels. J. Exp. Med.204, 2349–2362 (2007). - PMC - PubMed
    1. Liu, S., Jobert, F., Rahneshan, Z., Doyle, S. M. & Robert, S. Solving the puzzle of shape regulation in plant epidermal pavement cells. Annu. Rev. Plant Biol.72, 525–550 (2021). - PubMed