. 2025 May;641(8061):240-249.
doi: 10.1038/s41586-025-08766-w. Epub 2025 Mar 19.

Structural dynamics of DNA unwinding by a replicative helicase

Affiliations

Structural dynamics of DNA unwinding by a replicative helicase

Taha Shahid et al. Nature. 2025 May.

Abstract

Hexameric helicases are nucleotide-driven molecular machines that unwind DNA to initiate replication across all domains of life. Despite decades of intensive study, several critical aspects of their function remain unresolved1: the site and mechanism of DNA strand separation, the mechanics of unwinding propagation, and the dynamic relationship between nucleotide hydrolysis and DNA movement. Here, using cryo-electron microscopy (cryo-EM), we show that the simian virus 40 large tumour antigen (LTag) helicase assembles in the form of head-to-head hexamers at replication origins, melting DNA at two symmetrically positioned sites to establish bidirectional replication forks. Through continuous heterogeneity analysis2, we characterize the conformational landscape of LTag on forked DNA under catalytic conditions, demonstrating coordinated motions that drive DNA translocation and unwinding. We show that the helicase pulls the tracking strand through DNA-binding loops lining the central channel, while directing the non-tracking strand out of the rear, in a cyclic process. ATP hydrolysis functions as an 'entropy switch', removing blocks to translocation rather than directly powering DNA movement. Our structures show the allosteric couplings between nucleotide turnover and subunit motions that enable DNA unwinding while maintaining dedicated exit paths for the separated strands. These findings provide a comprehensive model for replication fork establishment and progression that extends from viral to eukaryotic systems. More broadly, they introduce fundamental principles of the mechanism by which ATP-dependent enzymes achieve efficient mechanical work through entropy-driven allostery.


Conflict of interest statement

Competing interests: The authors declare no competing interests.

Figures
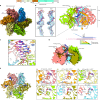
Fig. 1
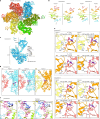
Fig. 1. Helicase encircles forked DNA to initiate internal strand separation.
a, Cryo-EM reconstruction of the LTag hexamer bound to forked DNA and ATP viewed from below, coloured by subunit. Domain organization of LTag monomer shown above. b, Cartoon representation sliced to show DNA-binding loops intruding into minor groove at fork junction. Inset compares extended DNA density in consensus and variability maps. DNA substrate sequence is shown below with modelled region shaded. c, Close-up of the DNA fork highlighting key interactions. H513 residues (labelled) form hydrogen bonds with nucleobases (green dotted lines), whereas K512 and R456 contact the phosphate backbone. Loops from subunits D, E and F create an internal separation wedge below base P2 of the passive strand. d, Surface representation sectioned to reveal internal architecture. The tracking (pink) and passive (blue) strands are shown as sticks. Dashed line indicates the predicted path of the 5′ tail of the passive strand, which is not modelled in the map, through the gap between the C tiers of subunits A and F. e, Interface analysis. Left, bottom view highlighting ATP density (blue) at subunit interfaces. Right, close-up views of nucleotide-binding pockets showing distinct ATP type (BA, CB) and ADP type (DC, ED, FE) configurations on the basis of buried surface area (BSA) and residue interactions (dotted lines). Crystal structure overlays (transparent) showing chain C from the LTag–ATP structure (PDB 1SVM) superimposed on chain A of the cryo-EM model at the AB interface, with chain B from the LTag–ADP structure (PDB 1SVL) overlaying chain C at the CD interface.
Fig. 2
Fig. 2. ATP hydrolysis triggers coordinated C-tier rotations and DNA translocation.
a, Overlay of initial (frame 1) and final (frame 5) states from the first variability component, showing the magnitude and direction of C-tier rotations in each subunit. b, Overlay of DNA conformations and DNA-binding residues K512 and/or H513 across the trajectory, demonstrating coordinated movements. c, Side-by-side comparison of initial and final DNA states, including H513 interactions. Nucleotides are coloured by associated subunit; hydrogen bonds are shown as red dotted lines. Green arrows indicate backbone phosphate bound to the loop of subunit D, highlighting the net translocation of one base along the trajectory. d, Superposition of subunit B from initial and final frames of the trajectory showing C-tier rotation, resulting in a downward shift of both the DNA-binding loop and bound DNA. e, Top, interactions at nucleotide-binding pocket between subunits B and C in the initial and final frames. The calculated BSA is shown, alongside the assigned interface type. Hydrogen bonds are shown as black dotted lines. The analysis shows disruption at the BC interface, indicating a catalytic event at the hydrolysis site. Middle, map density around nucleotide and DNA. Bottom, cryo-EM maps without postprocessing, depicting the helicase channel region, showing weak but persistent density for the passive strand at the DNA nexus. f, Atomic models coloured by B factor, showing increased overall mobility in the final state.
Fig. 3
Fig. 3. Sequential subunit motions drive continuous DNA unwinding.
a, Overlay of initial and final states of the second variability component, showing magnitude and direction of C-tier rotations in each subunit. b, Side-by-side comparison of initial and final DNA–H513 conformations from the second and third components. Component 2 shows one-base translocation between states, whereas component 3 shows no movement. Red dotted lines indicate hydrogen bonds; green arrows mark the phosphate group interacting with the DNA-binding loop of subunit D. c, Superposition of subunit F from initial and final frames of component 2, demonstrating upward C-tier and loop movement and DNA release. d, C-tier interfaces between subunits A and F over second principal trajectory, highlighting progressive narrowing of the AF gap, with the BC interface shown for comparison. e, Interface analysis showing concurrent BC and AB disruption in component 2, whereas BC remains intact in component 3, tying breakage of this interface to translocation. BSA, P values, interface types and hydrogen bonds (black dotted lines) are shown. f, Conformational changes at the fork nexus over a full translocation cycle. The duplex DNA segment is modelled as in the prehydrolytic structure (Fig. 1); the third panel is as the first but with LTag subunits rotated one step around the N-tier six-fold axis. Loop staircase restoration drives nexus rotation and base unpairing at the fork junction (black).
Fig. 4
Fig. 4. Origin DNA melting initiates bidirectional fork formation.
a, SV40 replication origin sequence highlighting EP and AT-rich regions with PEN elements. b, Cryo-EM reconstructions of LTag bound to EP and AT half origins with atomic models. The bottom-left panel shows DNA-binding loop interactions with the nexus. Hydrogen bonds are shown as black dotted lines. Loops of D and E create a wedge, disrupting base-pairing below P2, promoting local DNA melting. In the next panel, the three-dimensional class of LTag–EP shows double-stranded DNA (dsDNA) not engaged to flexible OBDs. The bottom-right panels show alignments of LTag–EP or LTag–AT models with fork-DNA-bound LTag (this work). c, Model of LTag dimer bound to EP (PDB 4GDF) showing the predicted region of initial melting, aligned with the model of LTag–EP (this work) to show the matching base pairs at the nexus. The alignment predicts local melting in the EP sequence and shows that OBD binding to two PEN sequences hinders hexamer assembly. Inset illustrates loops of subunits D and E intruding into the minor groove to prevent base-pairing. The EP sequence shows the predicted melted bases. d, Assay of EP half-origin DNA unwinding by LTag. DNA was incubated with increasing LTag concentrations (50–500 nM) and ATP for 45 min. Controls included unboiled (first lane) and boiled (second lane) substrates. Substrate mobility shifts indicate unwinding. For gel source data, see Supplementary Fig. 10. e, Cryo-EM analysis of LTag bound to the full-origin core. The top panel shows two-dimensional class averages of the double hexameric assembly. The bottom-left panel shows a Gaussian-filtered 3.7 Å-resolution map of the assembly, showing an ordered hexamer, flexible OBDs and DNA, and a second low-resolution hexamer. Duplex DNA density near OBDs is visible at higher map thresholds. The bottom-right panel shows the LTag double hexamer model, sliced to reveal the DNA substrate (yellow) in the helicase channel. r.m.s.d., root mean square deviation.
Fig. 5
Fig. 5. A general model for bidirectional fork unwinding.
a, Mechanism of internal fork unwinding by LTag, combining insights from the prehydrolytic structure of LTag bound to forked DNA and ATP and an actively translocating LTag incorporating Mg2+. The model outlines a single translocation cycle whereby ATP hydrolysis at the tightest hexamer interface (BC) acts as an ‘entropy switch’. Hydrolysis initiates synchronized rotations of the C tiers across different subunits and rearrangements of the DNA-binding loops, facilitating longitudinal movement of the tracking strand and DNA nexus within the helicase inner chamber. Following exchange of ADP–Pi for ATP by the F subunit, a new series of C-tier rotations occurs. This shifts the DNA-binding loop of the F subunit to the top of the staircase, concurrently establishing the ATP interface between the F and A subunits. Reconstitution of the staircase structure leads to melting of one base pair at the nexus, progressing the unwinding process. b, Model of bidirectional origin unwinding facilitated by dual LTag helicases: assembly of two hexamers in a head-to-head configuration at the origin causes melting at the EP and AT-rich regions. ATP-hydrolysis-driven traction on the tracking strand by each hexamer leads to shearing of the DNA between the hexamers and creation of single-stranded loops at the rear of the helicase. When the unwound DNA strands spanning the hexamers are fully elongated, they exit their respective hexamers. This results in the passive strands being routed around the exterior of the hexamers with concurrent release of the tracking-strand loops formed at the back of the helicase, culminating in separation of the helicases.
Extended Data Fig. 1
Extended Data Fig. 1. Cryo-EM of the LTag-ATP-DNA complex.
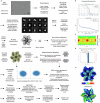
a, Workflow schematics for cryo-EM data collection, processing, and modelling. Flows continue from left hand side of following row unless otherwise indicated. b, Gold-standard Fourier shell correlation and Gunier plots. c, Angular distribution of projections. Resolution is estimated using the 0.143 criterion. d, Map isotropy analysis computed by 3DFSC. e, Two views of the cryo-EM map colored by local resolution.
Extended Data Fig. 2
Extended Data Fig. 2. Cryo-EM of the LTag−ATP/Mg2+−DNA complex.
a, Workflow schematics for cryo-EM data collection, processing, and modelling. Flows continue from left hand side of following row unless otherwise indicated. b, Gold-standard Fourier shell correlation and Gunier plots for the consensus reconstruction. c, Angular distribution of projections. Resolution is estimated using the 0.143 criterion. d, Map isotropy analysis computed by 3DFSC. e, Two views of the cryo-EM map colored by local resolution.
Extended Data Fig. 3
Extended Data Fig. 3. Cryo-EM of the LTag−EP origin DNA complex.
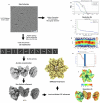
a, Schematic workflow outlining the steps for cryo-EM data collection and processing. b, Gold-standard Fourier shell correlation. c, Guinier plots. d, Angular distribution of projections. e, Map isotropy analysis computed by 3DFSC. e, Two views of the cryo-EM map, colored by local resolution.
Extended Data Fig. 4
Extended Data Fig. 4. Structure of LTag bound to EP- and AT-half origin DNA.
a, Structure surface representation, indicating predicted melted bases of the passive strand (gray cartoon) as they exit through the bottom opening between subunits A and F. Bottom view showcasing the nucleotide (AMPPNP) at inter-subunit interfaces and DNA-binding loops engagement of AT tracking strand (Lower panels). b and c, Analysis of inter-subunit interactions at nucleotide-binding pockets, including Buried Surface Area (BSA) and hydrogen bonds (depicted as black dotted lines).
Extended Data Fig. 5
Extended Data Fig. 5. Cryo-EM of the LTag−AT origin DNA complex.
a, Schematic workflow outlining the steps for cryo-EM data collection and processing. b, Gold-standard Fourier shell correlation. c, Guinier plots. d, Angular distribution of projections. e, Map isotropy analysis computed by 3DFSC. f, Two views of the cryo-EM map, colored by local resolution.
Extended Data Fig. 6
Extended Data Fig. 6. Cryo-EM of the LTag−full origin DNA complex.
a, Schematic workflow outlining the steps for cryo-EM data collection and processing. b, Gold-standard Fourier shell correlation. c, Guinier plots. d, Angular distribution of projections. e, Map isotropy analysis computed by 3DFSC. f, Two views of the cryo-EM map, colored by local resolution.
Extended Data Fig. 7
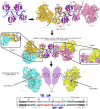
Extended Data Fig. 7. Model of LTag double hexamer assembly starting from dimeric intermediates.
The top right panel shows the alignment of the LTag OBD model (PDB ID: 2ITL) bound to the SV40 origin PEN sequences with two LTag dimers (PDB ID: 4GDF). This alignment reveals that OBDs bound to the pseudo-PEN sequences cannot reach PEN2 or PEN4, as their linkers are too short; therefore, the OBDs must detach to allow the hexamerization of either hexamer (middle panel). Consequently, LTag double hexamers assemble with their OBDs floating, which explains the disordered OBD density observed in this study. The assembly of each hexamer triggers local melting of at least five bases (bottom panel), priming the helicase for ATP-coupled translocation.
Extended Data Fig. 8
Extended Data Fig. 8. Conservation of DNA melting mechanisms between LTag and CMG helicases.
This figure highlights the internal DNA separation mechanism within the LTag helicase bound to forked DNA and its resemblance to the yeast CMG double hexamer structure during DNA melting at the origin (dCMGE; PDB 7z13). In both cases, the formation of a separation wedge is facilitated by ATP binding, the staircase arrangement of DNA binding loops, and the engagement of these loops with the tracking strand. These elements collectively drive strand separation within the helicase inner chamber, positioning the helicase for ATP-powered translocation. This configuration is mirrored in the translocating CMG structure (PDB 6u0m), showcasing the conserved mechanism of action. Conversely, the pre-CMG formation MCM double hexamer (dMCM; PDB 7p30) displays planar DNA binding loops and a disengaged tracking strand, indicative of a state not yet primed for ATP-dependent movement.

Similar articles

Cited by

  • Structure of the human CTF18-RFC clamp loader bound to PCNA.
    Briola GR, Tehseen M, Al-Amodi A, Young G, Danazumi AU, Nguyen PQ, Savva CG, Hedglin M, Hamdan SM, De Biasio A. Briola GR, et al. bioRxiv [Preprint]. 2025 Jul 24:2024.05.08.593111. doi: 10.1101/2024.05.08.593111. bioRxiv. 2025. PMID: 40777363 Free PMC article. Preprint.

References

    1. Fernandez, A. J. & Berger, J. M. Mechanisms of hexameric helicases. Crit. Rev. Biochem. Mol. Biol.56, 621–639 (2021). - PMC - PubMed
    1. Punjani, A. & Fleet, D. J. 3D variability analysis: resolving continuous flexibility and discrete heterogeneity from single particle cryo-EM. J. Struct. Biol.213, 107702 (2021). - PubMed
    1. Gao, Y. & Yang, W. Different mechanisms for translocation by monomeric and hexameric helicases. Curr. Opin. Struct. Biol.61, 25–32 (2020). - PMC - PubMed
    1. Fanning, E. Simian virus 40 large T antigen: the puzzle, the pieces, and the emerging picture. J. Virol.66, 1289–1293 (1992). - PMC - PubMed
    1. Stillman, B. Smart machines at the DNA replication fork. Cell78, 725–728 (1994). - PubMed

LinkOut - more resources