. 2025 May;641(8063):740-748.
doi: 10.1038/s41586-025-08741-5. Epub 2025 Mar 19.

Matrix-producing neutrophils populate and shield the skin

Affiliations

Matrix-producing neutrophils populate and shield the skin

Tommaso Vicanolo et al. Nature. 2025 May.

Erratum in

  • Author Correction: Matrix-producing neutrophils populate and shield the skin.
    Vicanolo T, Özcan A, Li JL, Huerta-López C, Ballesteros I, Rubio-Ponce A, Dumitru AC, Nicolás-Ávila JÁ, Molina-Moreno M, Reyes-Gutierrez P, Johnston AD, Martone C, Greto E, Quílez-Alvarez A, Calvo E, Bonzon-Kulichenko E, Álvarez-Velez R, Chooi MY, Kwok I, González-Bermúdez B, Malleret B, Espinosa FM, Zhang M, Wang YL, Sun D, Zhen Chong S, El-Armouche A, Kim KK, Udalova IA, Greco V, Garcia R, Vázquez J, Dopazo A, Plaza GR, Alegre-Cebollada J, Uderhardt S, Ng LG, Hidalgo A. Vicanolo T, et al. Nature. 2025 May;641(8065):E10. doi: 10.1038/s41586-025-09082-z. Nature. 2025. PMID: 40335705 No abstract available.

Abstract

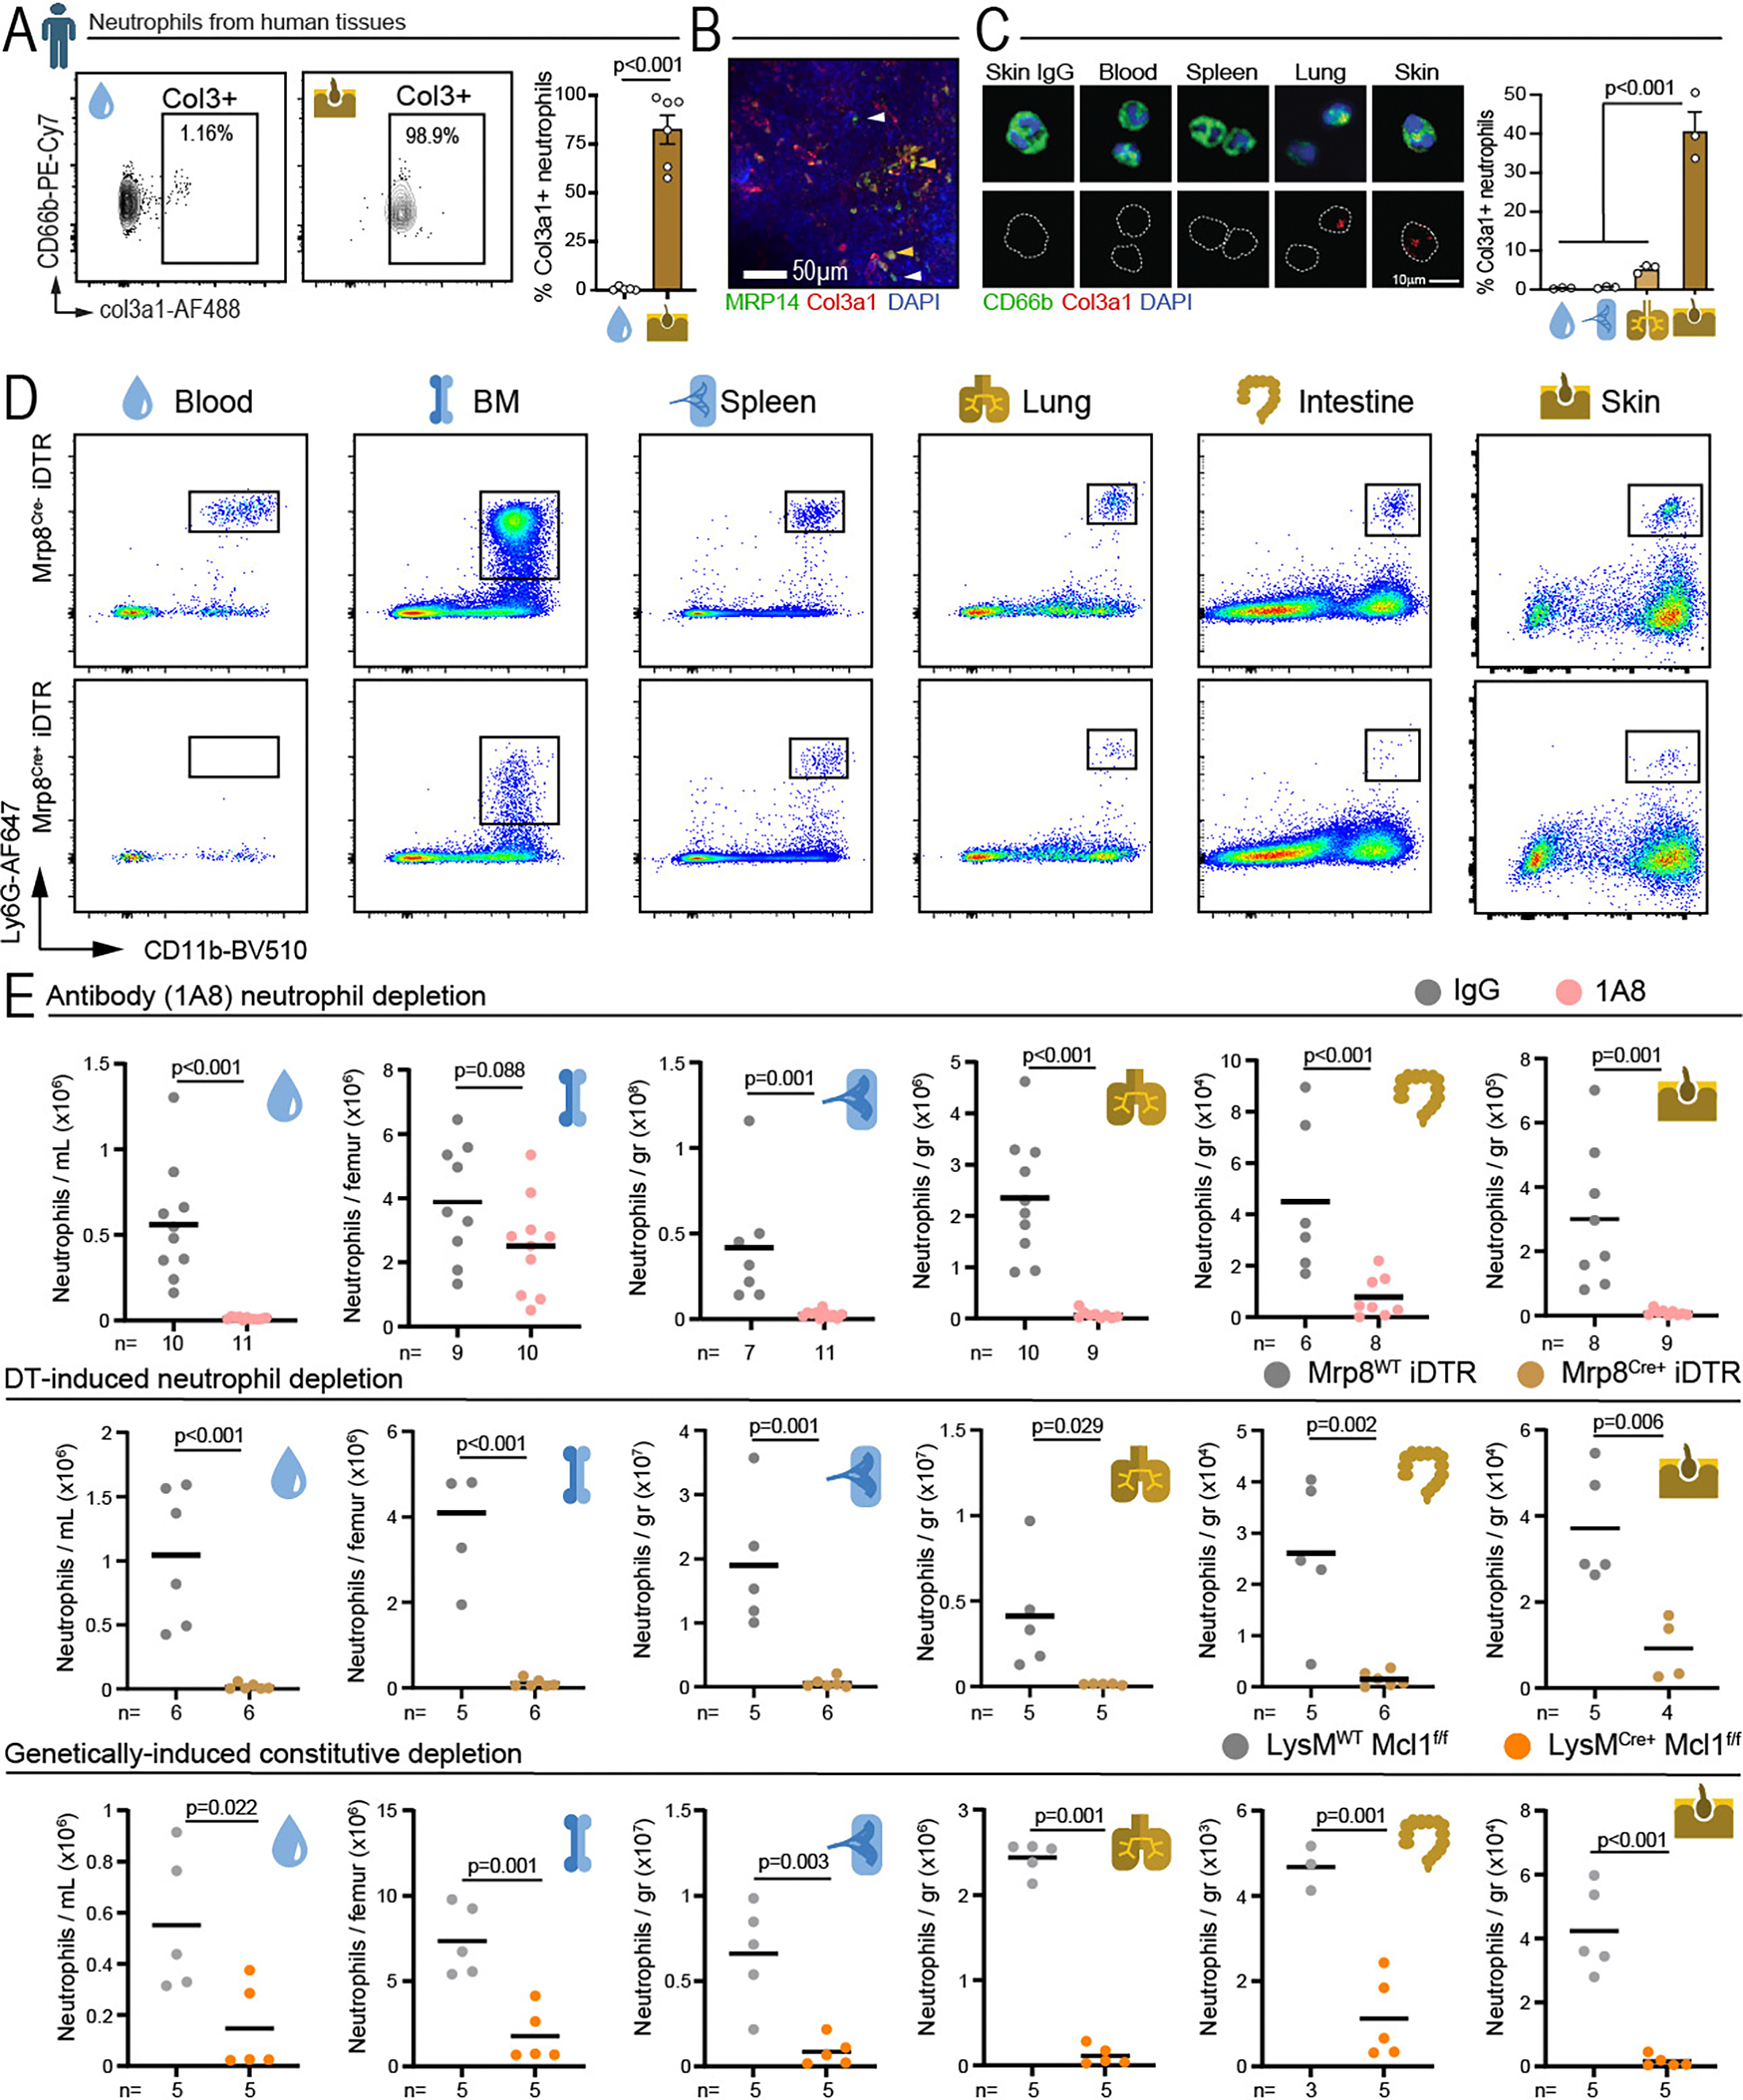
Defence from environmental threats is provided by physical barriers that confer mechanical protection and prevent the entry of microorganisms1. If microorganisms overcome those barriers, however, innate immune cells use toxic chemicals to kill the invading cells2,3. Here we examine immune diversity across tissues and identify a population of neutrophils in the skin that expresses a broad repertoire of proteins and enzymes needed to build the extracellular matrix. In the naive skin, these matrix-producing neutrophils contribute to the composition and structure of the extracellular matrix, reinforce its mechanical properties and promote barrier function. After injury, these neutrophils build 'rings' of matrix around wounds, which shield against foreign molecules and bacteria. This structural program relies on TGFβ signalling; disabling the TGFβ receptor in neutrophils impaired ring formation around wounds and facilitated bacterial invasion. We infer that the innate immune system has evolved diverse strategies for defence, including one that physically shields the host from the outside world.


Conflict of interest statement

Competing interests: The authors declare no competing interests.

Figures

Extended data Fig.1.
Extended data Fig.1.. Matrix-producing neutrophils in barrier organs.
(A) Isolation gates for sorting Ly6GHI neutrophils from the indicated tissues, with representative images of cytospins of the sorted cells and purities from a representative experiment; scale bar, 10 μm. (B) Volcano plots showing transcript enrichment in lung, skin and intestine relative to the levels found in the three sterile tissues. Data from the transcriptome shown in Fig.1A. (C) Computational validation in single cell datasets showing that cells sorted for the analyses shown in Fig.1A retain a neutrophil transcriptional identity. A signature score of the cells sorted and sequenced in Fig.1A (top 500 genes) was projected over a map of multiple cell types from the Tabula muris dataset and show strongest identity with the neutrophil cluster. (D) Left, ROS production after vehicle or PMA stimulation by blood or skin neutrophils, measured by fluorescence of the probe DHR123. Right, frequency of neutrophils from blood and skin that phagocytose fluorescent beads, using CD11bNEG cells as negative control. Skin data is from 7 mice and blood data is from 8 mice and shown as mean ± SEM. P-value determined by two-sided two-tailed Studentś t-test (ROS) or one-way ANOVA with multiple comparison test (phagocytosis). (E) Immunofluorescence analysis of barrier tissues to score the abundance of Col3a1+ (green) neutrophils in Ly6GTomato mice (red) stained for vessels with L. esculentum lectin (grey). Left, representative images of neutrophils in lungs; right, 3D reconstructions showing the presence of Col3a1 inside the neutrophils (F) Pie charts show the frequencies of Col3a1+ Mrp14+ cells in the indicated tissues; data from 8–9 images per tissue from 4 mice. (G) Number of all neutrophils or only Col3a1+ neutrophils per imaged volume area in the indicated tissues; data from 8–9 areas from 4 mice. Note that in lung the calculated neutrophil densities were lower due to the much greater tissue volumes compared to skin and gut, despite having higher absolute total counts. (H) Representative immunofluorescence micrographs of the indicated matrix proteins in neutrophils from blood and lungs. Images are representative of 300 cells from 3 mice. (I) Production of collagen by neutrophils ex vivo. Neutrophils sort-purified from blood, lung or skin of wild-type and Col3ΔN (Mrp8CRE; Col3a1fl/fl) mice were set in culture for the indicated times and stained for the presence of Col3a1. Graphs show the kinetics of the frequency of Col3a1+ neutrophils. Data are shown as mean ± SEM and from 3 independent experiments; n=4 wild-type and n=3 Col3ΔN mice. Statistical comparison of every time point versus time zero was calculated by a two-sided unpaired Student’s t-test. (J) Percentage of Col3a1+ neutrophils extracted from the indicated skin regions. Data from 3 mice. Bars show mean ± SEM analyzed by two-way ANOVA with Tukey’s multiple comparisons test.
Extended Data Fig.2.
Extended Data Fig.2.. Human neutrophils and neutropenia mouse models.
(A) Cytometry plots showing the frequency of Col3+ neutrophils of human skin and blood. Right, quantification of percentages. Bars show mean ± SEM from 5 blood and 6 skin samples. P-value determined by two-sided unpaired Student’s t-test. (B) Image of a cleared human skin sample stained for neutrophils and Col3a1. White arrowheads show Col3-negative neutrophils, and yellow arrowheads Col3+ neutrophils. The image is representative of 3 donors. (C) Representative images of Col3a1 staining in sorted neutrophils from human blood, spleen, lungs, and skin. Negative control IgG staining is shown for human skin neutrophils. Right, percent Col3a1+ neutrophils in barrier and non-barrier human tissues. Data is from 3 human specimens per tissue. P-value determined by one-way ANOVA with multigroup comparison test. (D) Representative cytometry plots and gating strategy for neutrophils across the indicated tissues (iDTR model). (E) Neutrophil numbers in tissues by flow cytometry of the three neutropenia mouse models and their respective controls (IgG, MRP8WT; iDTR and LyzMWT; Mcl1flox, respectively). Mice were treated intraperitoneally with either anti-Ly6G (1A8, 3 μg/g) or control IgG (3 μg/g) antibodies or diphtheria toxin (DT, 10 μg/kg) for two consecutive days and tissues were collected on the third day. The number of mice (n) is displayed in the figure. P-values were determined by a two-sided unpaired Student’s t-test.
Extended Data Fig.3.
Extended Data Fig.3.. Circadian patterns of the matrix transcriptome in the skin.
Circadian expression pattern of total skin mRNA in neutrophil-depleted (iDTR, orange) or control (gray) mice. For each gene, total tissue RNA levels were smoothed and normalized to the ZT where control curve was at minimum as baseline to focus on showing the variations in gene expression. (raw data available through this paper). Empty boxes represent undetected genes. See Fig.2A–B for the experimental scheme and general representation of the data.
Extended Data Fig.4.
Extended Data Fig.4.. Structure and mechanics of the skin.
(A) Second Harmonic Generation (SHG) in the ear skin to determine average fiber width using CT-FIRE (see Methods). (B) Measure of fiber “vesselness” to detect potential changes in fiber structure using the Frangi score (colored as shown in the scale). More signal in the control group (Cre-negative Rosa26iDTR littermates) shows loss of fibrous matrix structure in the iDTR and TGFbRΔN mice, as shown in the quantifications below. The number of replicates is indicated in the plot. P-value determined by two-sided multiple t-test. (C) Experimental design and schematics of the tensile tester used to measure the passive force of tissues at defined strains (see Methods). (D) Skin stiffness at different times of day (zeitgeber or ZT), which display marked circadian variations; the numbers of replicates (n) are displayed in the figure; p-value was calculated using the amplitude vs. zero test . Neutrophil depletion using anti-Ly6G antibody (1A8) (E) caused loss of diurnal variations in skin stiffness (F) measured at the trough and peak times (ZT9 and ZT17). The number of replicates for each group is displayed in the figure. P-value determined by one-way ANOVA with multiple comparison test (E, F). Boxplots show median ± interquartile; the whiskers show the range from minimum to maximum.
Extended Data Fig.5.
Extended Data Fig.5.. Collagen-producing neutrophils localize near sub-epidermal fibers.
(A) Multiphoton sectional imaging of ear skin explants of LysMGFP mice with anti-Ly6G (for neutrophils) and wheat germ agglutinin (WGA, for vasculature), combined with SHG to show the position of the subepidermal collagen layer and, at right, SHG imaging of this layer above looser collagen in the rest of dermis, with several neutrophils shown from a side view. (B) Reconstruction of a 1.5 × 1.5 mm region of the ear skin imaged from the top by two-photon imaging showing the network of CD31+ vessels as well as intravascular (yellow) and extravasated (pink) neutrophils as also shown in the inset at right. Images are representative of 4 mice. (C) Distribution of distances for neutrophils to sup-epidermal and dermal collagen compared with random dots, illustrating the preferential localization of neutrophils near the sub-epidermal layer of collagen. Data are from 193 cells and 3 mice. P values were calculated using the two sample Kolmogorov–Smirnov tests comparing the sample distributions of the empirical distances against the simulated randomly generated dots. (D) scRNA-seq of the ear skin, with UMAP showing the main identified clusters corresponding to the indicated cell types and distribution of the cells in control and neutrophil-depleted (anti-Ly6G, 2 days) skins. (E) Violin plots showing expression of the Col3a1 gene across the different cell types in the skin and (F) expression of the matrix signature (genes from Fig.1A) in the different clusters, showing the strongest expression in fibroblasts. (G) Representative images of one neutrophil and one fibroblast stained for Col3 and specific markers (Mrp14 and Podoplanin, respectively). Right, quantification of Col3+ frequencies and Col3 signal intensity per cell area or in total cells from the immunofluorescence images. Data is shown as mean ± SEM from 3 mice, with the number of cells (n) displayed in the figure. P-value determined by unpaired two-sided Student’s t-test.
Extended Data Fig.6.
Extended Data Fig.6.. Neutrophils deposit collagen and regulate collagen fibers in the skin.
(A) Mechanism of collagen tagging by CNA35-mCherry inside cells. This strategy was used to generate the Rosa26LSL; CNA35-mCherry reporter model, which allows Cre-dependent expression of a fluorescent form of CNA35, a collagen-binding protein of bacterial origin. Cell-specificity in this model is permitted because the fluorescent protein lacks an export signal and cannot be sorted out of the endoplasmic reticulum unless it binds trimeric collagen, thereby preventing unspecific labeling of collagen produced by other cells. (B) Neutrophils sorted from naïve lungs were cultured overnight for 16 hours on fibronectin-coated glass coverslips. Left, representative images (top) and reconstructions (bottom) of a Col+ lung neutrophil stained for DAPI, Col1/3, and wheat germ agglutinin (WGA). White arrows show deposits of extracellular collagen. In contrast ColNEG neutrophils do not show extracellular deposits (middle panels). Right, quantification of extracellular collagen signal area (top) and the number of collagen specks, within a 100μm perimeter of individual neutrophils (n=5 ColNEG cells, 7 Col+ cells). Data are presented as mean values ± SEM. (C) Representative images (top) and reconstructions (bottom) of a Col+ lung neutrophil (determined by positive CNA35-GFP signal). White arrowheads indicate the extracellular deposits positive for CNA35-mCherry and CNA35-GFP, indicating collagen deposition by the cell. These deposits are not found around CNA35-GFPNEG neutrophils (middle panels). Right, quantification of extracellular CNA35-mCherry+ area (top) and number of specks in a 100μm x 100μm perimeter around individual neutrophils. Data shows mean ± SEM from 4 GFPNEG cells and 4 GFP+ cells. P-values were determined by a two-sided unpaired Student’s t-test. (D) Representative image from the skin of Ly6GCRE; Rosa26LSL/CNA35-mCherry mice showing extracellular deposits of CNA35-mCherry. (E) Top and side views of the skin from Rosa26LSL/CNA35-mCherry reporter mice crossed with CreNEG control mice (n=7), and Ly6GCRE (n=11) or DptCreERT2 (n=4) driver lines to induce CNA35-mCherry expression in neutrophils and fibroblasts. Ly6GCRE targets mature neutrophils, while DptCreERT2 is expressed by 60% of fibroblasts. Arrows show distances of CNA35-collagen to the epidermis. (F) Volume percent of CNA35-mCherry in the naive skin of the neutrophil (n=3) and fibroblast (n=3) reporter lines, and (G) distance to the epidermis of collagen produced by neutrophils or fibroblasts. P-value determined by two-way ANOVA.
Extended Data Fig.7.
Extended Data Fig.7.. Characterization of TGFbRΔN mice.
(A) Blood counts in control and TGFbRΔN mice showing normal values for mice lacking neutrophil-specific TGFβ signaling. Data from 10 mice per group. (B) Characterization of granulopoiesis in TGFbRΔN mice showing segmented, banded and metamyelocytic stages as percentages defined by imaging of Giemsa stains of bone marrow samples. (C) Differential expression of genes associated with blood, bone marrow (BM), spleen and lung signatures as defined in (3), as well as genes associated with the matrix signature (ECM) as defined in Fig1A. Comparisons are for neutrophils extracted from blood and lungs of wild-type control and TGFbRΔN mice. Data is from 3 mice per group. (D) Representative reconstruction of neutrophils from the different tissues (top), and frequency of Col3a1+ neutrophils (bottom) extracted from tissues of wild-type control (n=3) and TGFbRΔN mice (n=3). (E) Col3a1 expression in neutrophils imaged directly in the skin of wild-type control (822 cells from 5 images, 2 mice) and TGFbRΔN mice (1419 cells from 9 images, 3 mice). Representative images (left), showing neutrophils detected using Mrp14 which was used to normalize Col3a1 expression across samples (normalized intensity, middle dot plot). Using relative Col3a1+ levels >2000 arbitrary units we stratified cells in tissues as Col3a1lo/hi and calculated the percent of Col3a1hi cells in each group, where bars show median values. (F) Representative images of Col3a1 expression inside and outside neutrophils imaged in the steady-state skin of Ly6GCreNEG control and Ly6G Cre+; TGFbRfl/fl mice, showing neutrophils detected using Mrp14 (green), Col3a1 inside neutrophils (red) and Col3a1 outside neutrophils (magenta). (G) Quantification of Col3a1 protein inside Tgfbr2fl/fl (143 cells, 2 mice) and Ly6GCRE; Tgfbr2fl/fl neutrophils (275 cells, 3 mice); bars show median values. Right, boxplots show extracellular Col3a1 protein signal in the same images from Tgfbr2fl/fl (143 cells from 11 images, 2 mice) and Ly6GCRE; Tgfbr2fl/fl mice (275 cells from 17 images, 3 mice). P-values determined by two-tailed Student’s t-test. All controls here are Cre-negative TGFbRflox littermates. Boxplots show median ± interquartile; the whiskers show the range from minimum to maximum.
Extended Data Fig.8.
Extended Data Fig.8.. Characterization of the skin of TGFbRΔN mice.
(A) Representative images of neutrophils (green) stained for Col3a1 (red) in the skin of WT control (CreNEG TGFbRflox littermates, 5 images from 2 mice) and TGFbRΔN mice (9 images from 3 mice), which we used to quantify the number of neutrophils per volume area is shown at right. Data are presented as mean values ± SEM, compared by two-tailed unpaired Student’s t-test. (B) Histological characterization of the skin of wild-type control (n=3) and TGFbRΔN mice (n=3) by hematoxylin-eosin staining for cell and tissue structure, Masson’s trichrome for collagen-rich structures, and Ki67 staining for dermal and epidermal proliferation. Images are quantified in the dot plot graphs. P-values were determined by a two-sided unpaired Student’s t-test. (C) Examples of SHG and fiber reconstruction using CT-FIRE for estimation of fiber width in control and TGFbRΔN mice also shown as distribution of widths in the histogram below (and in Fig.S5A for control vs. iDTR mice). P-values were determined by a two-sided unpaired Student’s t-tests. (D) Schematics of the atomic force microscopy (AFM) setup used to measure the stiffness of tissue samples (left) and its quantification in the form of elastic Young’s modulus in lung, intestine and skin of CreNEG;TGFbRflox control (referred to here as WT; n=5) and TGFbRΔN littermates (n=5 mice). Each dot represents the median Young’s modulus value calculated from ∼250 individual force-distance analyzed curves per mouse. Data was compared by two-sided unpaired Student’s t-test. Right, representative height images and corresponding Young’s modulus maps of skin from control (n=5) and TGFbRΔN littermates (n=5) acquired by AFM indentation experiments. (E) TEM images of the ear skin transversal sections showing collagen fibers in the subepidermal and lower dermis regions, which were automatically segmented for analysis (colored fibers). Yellow circles highlight large collagen fibers (>0.2μm2) in the subepidermal region. (F) Quantification of fiber size in the skin of TGFbRΔN mice (19825 fibers) and CreNEG littermate controls (62279 fibers); data is from 2 independent experiments. P-values determined by Kruskal-Wallis non-parametric test. (G) Percent of “large” fibers in the subepidermis and lower dermis from the images in (F). Data are presented as mean values ± SEM, and p-values were determined by Kruskal-Wallis non-parametric test. (H) Permeability assays in control (n=7) and TGFbRΔN mice (n=7) measured by FITC-dextran injected either intratracheally (for lung), or by oral gavage (for gut) in CreNEG control (n=8) and TGFbRΔN mice (n=8). Evans blue given intravenously to control (n=11) and TGFbRΔN mice (n=5) and then measured in the indicated tissues. All controls here were Cre-negative TGFbRflox littermates. (I) Stiffness and (J) permeability assay using Evans blue in the ear skin of Mrp8CRE; Tgfbr2flox and Ly6GCRE; Tgfbr2flox mice, as well as CreNEG; Tgfbr2flox littermates, or mice treated with anti-Ly6G to deplete neutrophils or isotype control antibody. The numbers of replicates are displayed in the figure. P-values determined by two-sided Student’s t-test comparing each depletion method with their controls (left panels), or one-way ANOVA with multiple comparison test (right panels). Boxplots in (D-H-I-J) show median ± interquartile; the whiskers show the range from minimum to maximum. Boxplots in (F) show median ± interquartile; whiskers are defined with percentiles and IQR (interquartile range, P75-P25); the points outside this range are the outliers.
Extended Data Fig.9.
Extended Data Fig.9.. Dynamics of the skin needle wound model.
(A) Imaging of puncture-induced wound healing (days 0 to 9; D0-D9) as visualized by SHG acquired by multiphoton imaging of the ear skin from control (WT), iDTR and TGFbRΔN mice. Wound area is highlighted with yellow dotted lines. Note the different stages indicated on top. For simplicity, only Cre-negative Tgfbr2flox littermates are shown as representative controls. (B) Kinetics of neutrophil counts in the wound estimated by confocal imaging and wound size (dotted areas in (A)) in control mice. (C) Kinetics of wound healing in controls and matched iDTR (left) or TGFbRΔN mice (right). Controls refer to the respective Cre-negative floxed littermates. Data from 2 ears per mouse and 3 mice per group, analyzed by two-sided unpaired t-test between the same time-points. (D) Left, scheme of in vivo neutrophil labeling in iLy6G mice to assess transit between tissues. Right, frequencies of CD11b+ Ly6G+ Tomato+ neutrophils of iLy6GtdTom mice at the indicated times after tamoxifen injection (days 0 to 3; D0-D3) in the BM (n of mice: D0= 6, D1=8, D2=2, D3=7), blood (n of mice: D0= 8, D1=9, D2=2, D3=7), and wounded skin(n of mice: D0= 5, D1=8, D2=2, D3=7). Data are mean ± SEM and p values are 0.015 for BM vs blood comparison and p=0.029 for BM vs skin comparison at day 1, determined by mixed effect model with Tukey’s multiple comparison test. (E) Representative images of the skin at different times after generating a needle wound, showing the kinetics of neutrophils that express or not Col3. The quantification of these images are shown in Fig.4B. (F) Staining for the indicated matrix proteins around wounds on day 3. Images representative of 4 mice per group. (G) Representative images and quantification of Col3+ matrix rings around skin wounds in CreNEG control and Ly6GCRE; Tgfbr2fl/fl mice at day 3, with quantification of Col3+ areas shown in the box and whisker plot at right. Data are from 4 CreNEG control and 3 Ly6GCRE; Tgfbr2fl/fl mice. (H) Image of a day 3 needle wound from the skin of iDTR mice with incomplete neutrophil depletion, showing the spatial correlation between Col3a1 deposition and the presence of residual neutrophils. (I) Heatmap of proteomic analysis of wounded skin from control, iDTR and TGFbRΔN mice, with color scales showing z-scores. Control represents combined data from 2 Cre-negative floxed littermates for iDTR and TGFbRΔN mice, for a total of 4 mice per group. P-values determined by two-tailed Student’s t-test comparing the same time points between groups (C) or the two experimental groups (G).
Extended Data Fig.10.
Extended Data Fig.10.. Characterization of Col3a1ΔN mice.
(A) Schematic representation of the Col3a1fl/fl mouse gene construct. Exons 2–3-4 are flanked by loxP sites which are recognized as targets of DNA cleavage by Cre recombinase. Primers 1 and 2 are used for the genotyping. Primers 3 and 4 are used for detection of depletion of gene construct after crossing with the Mrp8CRE driver line. (B) Genotypes of Mrp8CRE Col3a1fl/fl (Col3a1ΔN) mice determined by PCR of genomic DNA using primers 1 and 2 that target the inserted loxP site (left). Deletion of the Col3a1 gene was confirmed by PCR of genomic DNA of lung neutrophils using primers 3 and 4 (right). Controls are CreNEG floxed neutrophils. DNA from lung fibroblasts was used as control for driver specificity. Blots are from 3 experiments. (C) Representative 3D reconstructions of MRP14+ neutrophils and PDPN+ fibroblasts stained for Col3a1, with Col3a1+ cells indicated with asterisks (left). Percentage of Col3a1+ neutrophils and fibroblasts extracted from lungs of Cre-negative controls and Mrp8CRE; Col3a1fl/fl (Col3a1ΔN) mice (right). Data are presented as mean values ± SEM and from 4 Cre-negative mice (455 neutrophils and 106 fibroblasts) and 5 Col3a1ΔN mice (505 neutrophils and 142 fibroblasts). (D) Representative images and quantification of Col3+ matrix rings around day 3 skin wounds in the same control and Col3a1ΔN mice. Right, quantification of Col3+ and laminin+ areas (from Fig.4H) is shown in the box and whisker plot. The number of replicates are displayed in the figure. P-values determined by two-tailed Student’s t-test. Boxplots show median ± interquartile; the whiskers show the range from minimum to maximum.
Figure 1.
Figure 1.. Matrix-producing neutrophils populate the skin.
(A) Top, parabiosis strategy to analyze blood-borne neutrophils that infiltrate internal (blood, bone marrow and spleen) and barrier tissues (lung, skin and gut). Bottom, heatmap showing the relative expression of genes associated with the ECM, with increases for most collagens and other ECM proteins, metalloproteases (MMP) and enzymes involved in fibril formation and maturation. Data is from 3 mice per tissue. (B) Volcano plots of data from (A) showing paired comparison of matrix genes from skin neutrophils versus combined blood, BM and spleen, indicating the genes most differentially expressed in each tissue. (C) Pie charts showing the frequency of neutrophils positive for matrix protein (Col3a1) across tissues, as determined by immunofluorescence of isolated cells. Data are averages of 3 mice. (D) Top and transversal views of a representative immunofluorescence of the naïve skin of a Ly6GCRE; Tomato mouse, showing neutrophils (red, marked by triangles), vessels (blue), nuclei (grey) and Col3 protein (green). Insets show raw (left) and corresponding segmented images (right) of representative neutrophils with or without intracellular Col3. The dashed line indicates the region chosen for the transversal view. Image is representative of 5 mice. HF, hair follicles. See also Supplementary Video 1.
Figure 2.
Figure 2.. Neutrophils control matrix composition, structure, and mechanics of the naïve skin.
(A) Experimental strategy to assess expression of circadian matrix genes by neutrophils. Right, neutrophil dynamics in blood versus tissues, from . (B) Effect of neutrophil depletion in the circadian transcription of 124 matrix-related genes (Extended Data Fig.3). Data show transcript read values for each gene and time-point in control mice minus values in neutropenic mice. (C) Examples of matrix genes that lose circadian expression patterns in the skin of neutropenic mice. Data is from three mice, with confidence intervals shown as dotted lines. (D) Matrix proteome of the skin from control and neutropenic mice (Mcl1ΔN and iDTR mice; collected at ZT7) and CreNEG Mcl1fl/fl littermate controls. Boxes show average values from 3 mice. (E) Representative scanning electron microscopy images of the ear skin from CreNEG control (n=4) and iDTR mice (7-day depletion; n=4). (F) Multiphoton microscopy imaging and SHG showing individual fibers whose widths are shown at right. Data is from 26–36 z-slices per location from 4 different locations per mouse, from 5 control and 5 iDTR mice per group. Controls were Cre-negative littermates treated with DT. (G) Representative force-strain curves for the indicated tissues in control CreNEG Mcl1fl/fl (n=7) and Mcl1ΔN mice (n=10). Shown is one example for each group and tissue. Stiffness (in mN) is quantified as the slope of the force-strain curves in the box and whiskers plots at right. (H) Force-strain analyses in iDTR neutropenic (n=12) compared with control CreNEG mice (n=11), both treated with DT. Analyses in (F-H) are compared by two-sided unpaired Student’s t-test. All boxplots show median ± interquartile; the whiskers show the range from minimum to maximum.
Figure 3.
Figure 3.. TGFβ signaling drives the matrix program of barrier neutrophils.
(A) In vivo screening in mice treated with the indicated inhibitors or neutrophil-specific mutant mice compared with flox-negative control mice. The heatmap represents the mean differential expression in treated lung neutrophils versus controls for each gene. Data from 3 independent mice per group, with p-values calculated by One-sample location t-test. (B) Left, enrichment of transcription factor recognition sequences in ATAC-seq peaks in the lung cluster based on HOMER. Right, occurrence of Smad2/3 motifs in the different tissues. P-values were calculated with HOMER. (C) Phosphorylated Smad3 protein in blood (n=4 mice) and lung (n=4 mice) neutrophils. (D) Bubble plot of Gene Ontology pathways identified from the PCA analysis of lung neutrophils from CreNEG;TGFbRflox control versus TGFβRΔN littermates. Only pathways with adjusted p-values below 0.01 are plotted. P-values were calculated with PANTHER Overrepresentation Test. ECM-related pathways are in orange. See Source Data Fig.3. (E) Scanning electron microscopy of skin from CreNEG;TGFbRflox control (n=4) and TGFβRΔN littermates (n=4) mice. (F) Width of collagen fibers in the skin of control CreNEG;TGFbRflox (WT; n=60 slices, 4 mice) and TGFβRΔN littermates (n=60 slices, 4 mice) measured by SHG and automated analysis. (G) Representative force-strain curves of ear skin from CreNEG;TGFbRflox control (n=9 mice) and TGFβRΔN littermates (n=8 mice), which are quantified in the box and whiskers plot. (H) Scheme of the permeability assay. Evans blue was allowed to diffuse for 1h. Middle, representative images of ears from CreNEG;TGFbRflox control (n=13 mice) and TGFβRΔN littermates (n=10 mice). Right, quantification of Evans blue signal in the skin. Data in (C) and (F-H) are compared by two-sided unpaired Student’s t-test. All boxplots show median ± interquartile; the whiskers show the range from minimum to maximum.
Figure 4.
Figure 4.. Neutrophils shield skin wounds by building matrix-rich rings.
(A) Kinetics of neutrophil recruitment to wounds in Ly6GTomato mice. (B) Quantification of Col3a1NEG and Col3a1+ neutrophils at D0 (n=9), D0.5 (n=4), D1 (n=3), D2 (n=3) and D3 (n=3). Data are mean values ± SEM. (C) Multiphoton imaging of neutrophils around D2 wounds in TGFbRflox (n=6) and TGFβRΔN littermates (n=4). (D) Col3a1 signal intensity (748 cells from 6 mice for TGFbRflox, 640 cells from 4 mice for TGFβRΔN) and neutrophil number (7 images for TGFbRflox and 6 for TGFβRΔN mice). Bars show mean ± SEM. (E) 3D reconstruction of a collagen ring in a wound (Supplementary Video 3). (F) Kinetics of Col3a1+ rings. (G) Ring-areas in neutropenic iDTR (n=5 wounds, 3 mice) and TGFβRΔN mice (n=5 wounds, 3 mice) at D3, and their respective CreNEG (n=6 wounds, 3 mice) and floxed littermates (n=4 wounds, 3 mice). (H) Col3 and Laminin deposits in D3 rings (dashed lines) from Col3a1ΔN (n=5) and CreNEG littermates (n=3). Areas are quantified in Extended Data Fig. 10D. (I) Permeability assay and images showing dye diffusion (dotted lines) in wound from floxed-littermate controls (n=10), iDTR neutropenic (n=10) and TGFβRΔN mice (n=10). (J) Bacteria (S. aureus) penetration in wounded skin of TGFβRflox/flox-littermate controls (n=7) and TGFβRΔN mice (n=6), scored as CFU 3 days after exposure (images at bottom). (K) Spatial distribution of S. aureus 4 hours after exposure to the wound. Bottom, distance distribution of individual bacteria to the wound edge. Right, mean distance values ± SEM. Data from 3 wildtype, 3 neutropenic (anti-Ly6G) and 7 TGFbRΔN mice. Data were compared using two-sided unpaired Student’s t-test (D, G, I, J) or one-way ANOVA with Tukey’s multiple comparison test (K). All boxplots show median ± interquartile; the whiskers show the range from minimum to maximum.

References

    1. De Veer MJ, Kemp JM & Meeusen ENT The innate host defence against nematode parasites. Parasite Immunology vol. 29 1–9 at 10.1111/j.1365-3024.2006.00910.x (2007). - DOI - PubMed
    1. Hickey MJ & Kubes P Intravascular immunity: The host-pathogen encounter in blood vessels. Nature Reviews Immunology vol. 9 364–375 at 10.1038/nri2532 (2009). - DOI - PubMed
    1. Hohl TM, Rivera A & Pamer EG Immunity to fungi. Current Opinion in Immunology vol. 18 465–472 at 10.1016/j.coi.2006.05.003 (2006). - DOI - PubMed
    1. Erin Chen Y, Fischbach MA & Belkaid Y Skin microbiota-host interactions. Nature 553, 427–436 (2018). - PMC - PubMed
    1. Driskell RR et al. Distinct fibroblast lineages determine dermal architecture in skin development and repair. Nature 504, 277–281 (2013). - PMC - PubMed

MeSH terms

Substances

LinkOut - more resources