. 2025 Apr;640(8060):1062-1071.
doi: 10.1038/s41586-025-08732-6. Epub 2025 Mar 19.

VDAC2 loss elicits tumour destruction and inflammation for cancer therapy

Affiliations

VDAC2 loss elicits tumour destruction and inflammation for cancer therapy

Sujing Yuan et al. Nature. 2025 Apr.

Abstract

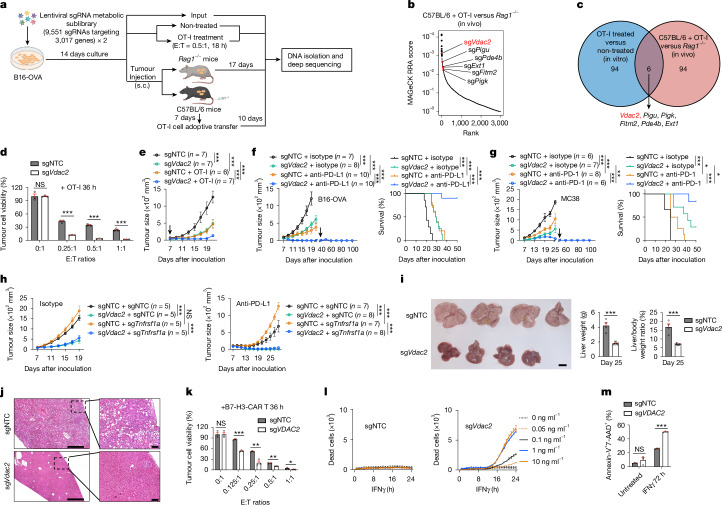
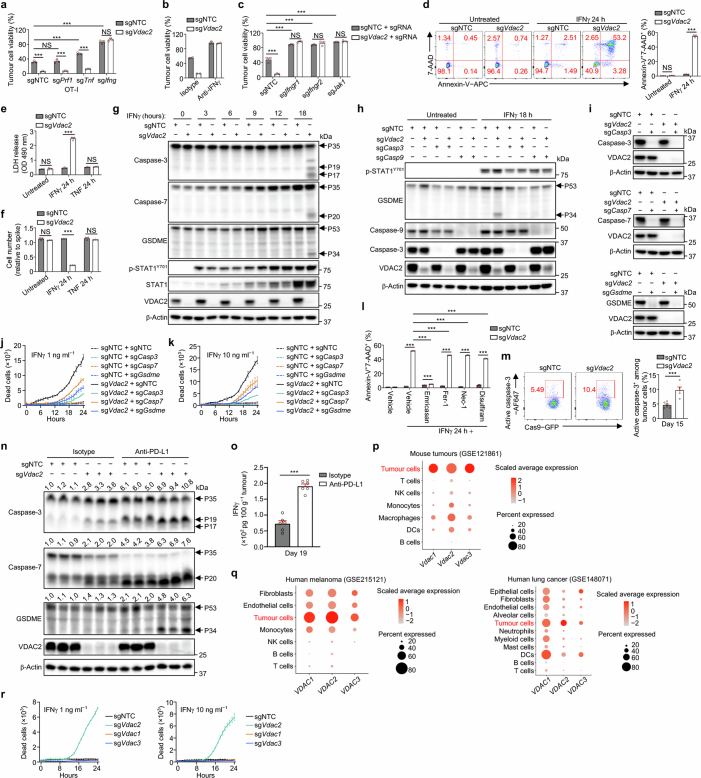
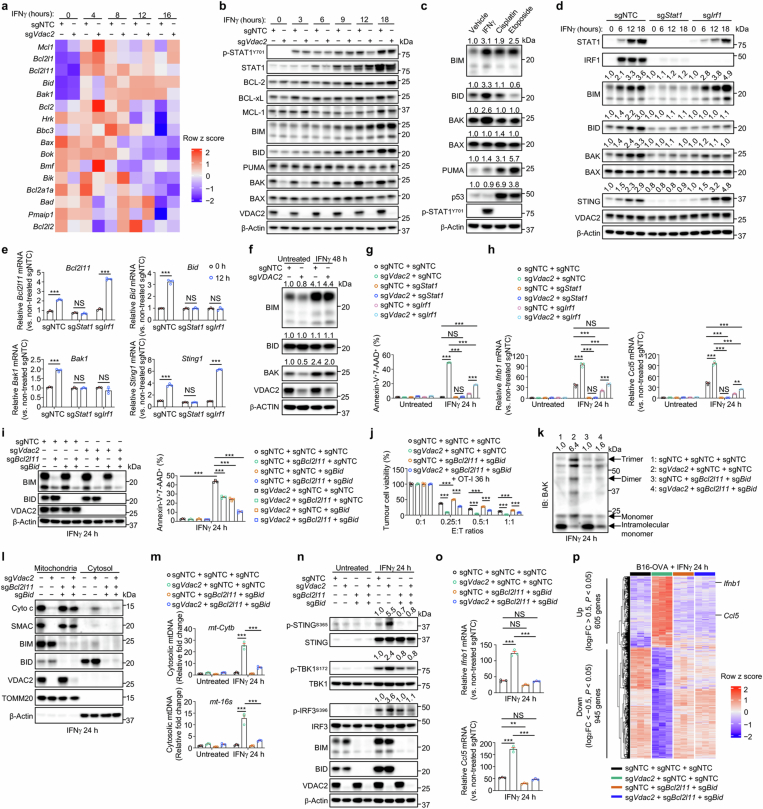
Tumour cells often evade immune pressure exerted by CD8+ T cells or immunotherapies through mechanisms that are largely unclear1,2. Here, using complementary in vivo and in vitro CRISPR-Cas9 genetic screens to target metabolic factors, we established voltage-dependent anion channel 2 (VDAC2) as an immune signal-dependent checkpoint that curtails interferon-γ (IFNγ)-mediated tumour destruction and inflammatory reprogramming of the tumour microenvironment. Targeting VDAC2 in tumour cells enabled IFNγ-induced cell death and cGAS-STING activation, and markedly improved anti-tumour effects and immunotherapeutic responses. Using a genome-scale genetic interaction screen, we identified BAK as the mediator of VDAC2-deficiency-induced effects. Mechanistically, IFNγ stimulation increased BIM, BID and BAK expression, with VDAC2 deficiency eliciting uncontrolled IFNγ-induced BAK activation and mitochondrial damage. Consequently, mitochondrial DNA was aberrantly released into the cytosol and triggered robust activation of cGAS-STING signalling and type I IFN response. Importantly, co-deletion of STING signalling components dampened the therapeutic effects of VDAC2 depletion in tumour cells, suggesting that targeting VDAC2 integrates CD8+ T cell- and IFNγ-mediated adaptive immunity with a tumour-intrinsic innate immune-like response. Together, our findings reveal VDAC2 as a dual-action target to overcome tumour immune evasion and establish the importance of coordinately destructing and inflaming tumours to enable efficacious cancer immunotherapy.


Conflict of interest statement

Competing interests: S.G. is a member of the Scientific Advisory Board of Be Biopharma and CARGO and the Data and Safety Monitoring Board (DSMB) of Immatics, and is a co-inventor on patents/patent applications in the fields of immunotherapy and gene therapy. H.C. consults for Kumquat Biosciences and TCura Bioscience, and is a co-inventor on patents/patent applications in the field of immunotherapy. The remaining authors declare no competing interests.

Figures

Fig. 1
Fig. 1. VDAC2 deficiency sensitizes tumours to IFNγ-induced cell death and immunotherapy.
a, Schematic for CRISPR screening in B16-OVA tumour cells. Created in BioRender. Sun, R. (2025) https://BioRender.com/g06b183. b, The top depleted genes in tumour cells from C57BL/6 + OT-I cell versus Rag1−/− condition. RRA, robust rank aggregation. c, The overlap between the top 100-ranked gene candidates from CRISPR screens. d, Control or VDAC2-deficient tumour cell viability after co-culture with OT-I cells. n = 3 per group. E:T, effector:target ratio. e, Control or VDAC2-deficient B16-OVA tumour growth without or with (indicated by arrow) adoptive transfer of activated OT-I cells. f, Control and VDAC2-deficient B16-OVA tumour growth after the indicated treatments. Arrow indicates tumour rechallenge of sgVdac2 and anti-PD-L1 group (left). Right, the survival of mice after primary tumour challenge. g, Control and VDAC2-deficient MC38 tumour growth after the indicated treatments. Arrow indicates tumour rechallenge of sgVdac2 and anti-PD-1 group (left). Right, the survival of mice after primary tumour challenge. h, Indicated sgRNA-transduced B16-OVA tumour growth after the indicated treatments. i,j, Liver tumour burden (i) and histological analyses (j) at day 25. n = 4 (sgNTC) and n = 8 (sgVdac2). Scale bars, 1 cm (i), 500 μm (j, left) and 100 μm (j; high-magnification inset, right). k, Control or VDAC2-deficient LoVo tumour cell viability after co-culture with B7-H3-CAR T cells. n = 3 per group. l,m, Control or VDAC2-deficient B16-OVA (l, n = 2 per group) or LoVo (m, n = 3 per group) tumour cell death after IFNγ treatment. Data are mean ± s.e.m., representative of three (f, i, j and m), two (d, e, g, k and l) or one (h) independent experiments. Statistical analysis was performed using two-tailed unpaired Student’s t-tests (d, i and k), two-way analysis of variance (ANOVA) (e; f and g (tumour size); h and m) and Mantel−Cox tests (f and g (survival)); NS, not significant; *P < 0.05; **P < 0.01; ***P < 0.001. Source Data
Fig. 2
Fig. 2. VDAC2-deficiency-induced TME inflammatory reprogramming requires IFNγ.
a, UMAP plot of the indicated cell clusters from scRNA-seq profiling of control and VDAC2-deficient tumours. n = 2 biological replicates per group. cDC, conventional dendritic cell; mregDC, mature dendritic cell enriched in immunoregulatory molecules; pDC, plasmacytoid dendritic cell. b, The frequencies of the indicated intratumoural immune cell populations among CD45+ cells in each genotype. ce, CD45+ cells (c), CD8+ T cells (d) and the ratio of CD8+ T cells to Treg cells (e) in control (n = 8) and VDAC2-deficient (n = 7) B16-OVA tumours. f, The frequencies of CD8+ T cells grouped by clonotype sizes, as assessed by scTCR-seq. N/A, TCR type not detected. g, Activity scores of early activation and effector/cytokine production-related gene signatures in intratumoural CD8+ T cells from control (n = 710 cells) and VDAC2-deficient (n = 2,295 cells) B16-OVA tumours. The box plots show the median (centre line) and the interquartile range (25% to 75%; box limits). h,i, IFNγ+TNF+ (h) and GZMB+ (i) CD8+ T cells from B16-OVA tumours. n = 7 (sgNTC) and n = 6 (sgVdac2). j, Control and VDAC2-deficient tumour growth after the indicated treatments. k,l, CD45+ cells (k, left) and CD8+ T cells (k, right) or IFNγ+TNF+ (l, left) and GZMB+ (l, right) CD8+ T cells from the indicated B16-OVA tumours. n = 5 (sgNTC + isotype and sgVdac2 + isotype) and n = 7 (sgNTC + anti-IFNγ and sgVdac2 + anti-IFNγ). Data are mean ± s.e.m., representative of three (ce, h and i) or two (jl) independent experiments. Statistical analysis was performed using two-tailed unpaired Student’s t-tests (ce, h and i), one-way ANOVA (k and l), two-way ANOVA (j) and two-tailed Wilcoxon rank-sum tests (g). Source Data
Fig. 3
Fig. 3. VDAC2 loss enables IFNγ-induced mtDNA release and STING activation.
a, Hallmark IFNα and IFNγ response signatures. FDR, false-discovery rate; NES, normalized enrichment score. b, Gene expression profiles in IFNγ-treated B16-OVA tumour cells, with selective upregulated (red) and downregulated (blue) genes labelled. c,d, The relative levels of IFN-responsive genes (c) or Ifnb1 (d) in IFNγ-treated B16-OVA tumour cells. n = 3 per group. e,f, IFNβ levels in culture supernatants from IFNγ-treated B16-OVA tumour cells (e; n = 3 per group) or from tumour lysates after inoculation into wild-type mice (f; n = 6 per group). g, Overlap of activated IPA-predicted upstream regulators from transcriptome profiling of OT-I- or IFNγ-treated B16-OVA tumour cells. The numbers indicate uniquely activated regulators. h, Motif enrichment analysis of differentially accessible chromatin profiled by ATAC–seq (n = 4 per group), with selective upregulated (red) and downregulated (blue) motifs labelled and black-labelled genes being unaltered. i,j, Immunoblot analysis of B16-OVA tumour cells after IFNγ treatment, with densiometric quantification of phosphorylated STING (p-STING), p-TBK1 or p-IRF3 shown (i), and p-TBK1 or p-IRF3 shown (j). k,l, The relative levels of Ifnb1 in indicated cells (k; n = 3 per group) and IFNβ in culture supernatants of indicated cells (l; n = 3 per group). m, The relative expression of IFN-responsive genes repressed by VDAC2 in the indicated IFNγ-treated B16-OVA tumour cells. n = 3 per group. n, The growth of B16-OVA tumours. The same sgNTC and sgVdac2 groups are shown on the left and right. o, dsDNA and TOMM20 co-localization in IFNγ-treated B16-OVA tumour cells. n = 4,525 (sgNTC) and 5,948 (sgVdac2). Scale bar, 20 μm. MFI, mean fluorescence intensity. p, Relative cytosolic mtDNA levels (versus non-treated control cells) in IFNγ-treated B16-OVA tumour cells. n = 2 per group. q, Relative Ifnb1 levels in IFNγ-treated B16-OVA tumour cells that lack (ρ0 cells) or contain mtDNA (n = 3 per group). r, The relative IFNB1 and CCL5 levels in IFNγ-treated LoVo tumour cells. n = 3 per group. s, Immunoblot analysis of LoVo tumour cells before and after IFNγ treatment, with densiometric quantification of p-STING, p-TBK1 or p-IRF3 shown. Data are mean ± s.e.m., representative of three (c, d, i, k and l), two (e, j and os) or one (f and n) independent experiments. Statistical analysis was performed using two-tailed unpaired Student’s t-tests (cf and o), one-way ANOVA (k, l and q), two-way ANOVA (n and r) and two-tailed Fisher’s exact test (h). Source Data
Fig. 4
Fig. 4. BAK mediates VDAC2-deficiency-driven effects in response to IFNγ.
a, Schematic of the secondary genome-scale CRISPR screen. Created in BioRender. Sun, R. (2025) https://BioRender.com/g06b183. b, Enriched (red) and depleted (blue) sgRNAs targeting mitochondria-associated genes in IFNγ-treated versus non-treated VDAC2-deficient B16-OVA tumour cells. c, Immunoblot analysis of the indicated sgRNA-transduced B16-OVA tumour cells after IFNγ treatment for indicated times; densiometric quantification of p-STING, p-TBK1, p-IRF3 or total BAK is shown. d, The relative cytosolic mtDNA levels (versus non-treated control cells) in the indicated B16-OVA tumour cells treated with or without IFNγ. n = 3 per group. e, IFNβ levels in the culture supernatants from the indicated B16-OVA tumour cells after IFNγ treatment. n = 4 per group. f, The relative gene expression in the indicated B16-OVA tumour cells after IFNγ treatment. n = 3 per group. g, Cell death of the indicated B16-OVA tumour cells treated with IFNγ. n = 3 per group. EV, empty vector. h, Relative Ifnb1 and Ccl5 levels (versus non-treated control cells) in the indicated B16-OVA tumour cells treated with IFNγ. n = 3 per group. i, Control, VDAC2-deficient, BAK-deficient, or VDAC2 and BAK co-deficient B16-OVA tumour growth (left) and survival of tumour-bearing mice (right). j, Lung tumour burden in mice that received intravenous injection of the indicated B16-OVA tumour cells. n = 5 per group. Scale bar, 1 cm. Data are mean ± s.e.m., representative of three (c and i), two (d, e, g and h) or one (j) independent experiments. Statistical analysis was performed using one-way ANOVA (d, e, g, h and j), two-way ANOVA (i (tumour size)) and Mantel−Cox test (i (survival)). Source Data
Extended Data Fig. 1
Extended Data Fig. 1. (related to Fig. 1). VDAC2 targeting overcomes tumour immune evasion and enhances ICB effectiveness in a TNFR-deficient melanoma model.
a, MAGeCK analysis of top depleted genes (ranked by RRA score) in tumour cells with OT-I cell treatment versus those without OT-I cell treatment in the in vitro CRISPR screen (depicted in Fig. 1a). b, Immunoblot analysis of VDAC2 expression in control and VDAC2-deficient B16-OVA, MC38-OVA, and MC38 tumour cells. c, Control or VDAC2-deficient (two different sgRNAs were used to target Vdac2; sgVdac2 and sgVdac2 #2) B16-OVA tumour cell viability after co-culture with OT-I cells for 24 h (n = 2 per group). d, Control and VDAC2-deficient B16-OVA tumour cell viability at indicated timepoints, as assessed by MTT assay (n = 6 per group). e, Control and VDAC2-deficient MC38-OVA tumour cell viability after co-culture with OT-I cells for 24 h (n = 2 per group). f, Control or VDAC2-deficient B16-OVA tumour cell growth in C57BL/6 mice (left). Survival of tumour-bearing C57BL/6 mice (right) (n = 8 per group). g, Control or VDAC2-deficient B16-OVA tumour growth in Rag1–/– mice (left). Survival of tumour-bearing Rag1–/– mice (right) (n = 8 for sgNTC and sgVdac2; 9 for sgVdac2 #2). Experiments described in (f) and (g) were performed in parallel. h, C57BL/6 mice were inoculated with control or VDAC2-deficient B16-OVA tumour cells. On day 7 after tumour inoculation, cohorts of these mice received adoptive transfer of activated OT-I cells (indicated by arrow) or PBS. Mouse survival was monitored (n = 7 for PBS treated groups; 6 for sgNTC + OT-I; 7 for sgVdac2 + OT-I). i, j, Cas9+ transgenic mice received control or VDAC2-deficient B16-OVA tumour cells by tail vein injection to induce lung metastasis (n = 6 mice per group). Tumour burden (i) and histological analyses (j) in lung on day 21 after injection. Scale bar, 1 cm in (i) or 2 mm in (j). k, l, Survival of Cas9+ transgenic mice (n = 7 for sgNTC; 8 for sgVdac2) (k) or Rag1–/– mice (n = 11 per group) (l) that received i.v. injection of control and VDAC2-deficient B16-OVA tumour cells. m, Control, VDAC2-deficient, TNFR-deficient, or VDAC2 and TNFR co-deficient B16-OVA tumour cell viability after co-culture with OT-I cells for 36 h (n = 3 per group). n, Indicated B16-OVA tumour cell viability after treatment with IFNγ (10 ng ml–1) plus TNF (10 ng ml–1) for 24 h (n = 4 per group). o, Survival of C57BL/6 mice inoculated with indicated B16-OVA tumour cells, followed by injection with anti-PD-L1 (or isotype) on days 7, 10, and 13 after tumour inoculation. See also Fig. 1h (n = 5 for isotype treated groups; 7 for sgNTC + sgNTC + anti-PD-L1 and sgNTC + sgTnfrsf1a + anti-PD-L1; 8 for sgVdac2 + sgNTC + anti-PD-L1 and sgVdac2 + sgTnfrsf1a + anti-PD-L1). p, C57BL/6 or Rag1–/– mice received AKT and NRASG12V oncogenic vectors in combination with Cas9- and sgNTC- or sgVdac2-expressing plasmids via hydrodynamic injection (HDI) to induce liver tumorigenesis. Survival of tumour-bearing C57BL/6 mice (see also Fig. 1i,j) and Rag1–/– mice (see also Extended Data Fig. 1q,r) were monitored (n = 9 per group for C57BL/6 mice; n = 8 per group for Rag1–/– mice). q, Rag1–/– mice received AKT and NRASG12V oncogenic vectors in combination with Cas9- and sgNTC- (n = 6) or sgVdac2- (n = 6) expressing plasmids via HDI to induce liver tumorigenesis. Mice were euthanized for analysis of liver tumour burden on day 21 after HDI. Scale bar, 1 cm. r, H&E staining of livers from mice (described in q) to detect liver tumour burden. Scale bar, 500 μm. s, Perturbation effects of VDAC2 among tumour lines in DepMap were visualized by Chronos dependency scores. t, Analysis of public CRISPR screen dataset of human melanoma cells treated with TILs in vitro. sgVDAC2 ranks in the top 10% (at the gene level) among a sgRNA library targeting 248 genes to deplete tumour cells in TIL versus control (culture medium alone) treatment groups. u, Immunoblot analysis of VDAC2 expression in control and VDAC2-deficient LoVo cells. Data are representative of two (bf, hk, m, n, p, q, u, r) or one (g, l, o) independent experiments and are mean ± s.e.m. Two-tailed unpaired Student’s t-test (i, q). One-way ANOVA (m, n). Two-way ANOVA (d, tumour size of f, g). Mantel−Cox test (survival of f, g; h, k, l, o, p). Source Data
Extended Data Fig. 2
Extended Data Fig. 2. (related to Fig. 1). VDAC2 deficiency sensitizes tumour cells to IFNγ-induced cell death.
a, Control or VDAC2-deficient tumour cell viability after co-culture with sgNTC-, sgIfng-, sgTnf- or sgPrf1-transduced OT-I cells at E:T ratio of 0.5:1 for 24 h (n = 3 per group). b, Control or VDAC2-deficient B16-OVA tumour cell viability after co-culture with OT-I cells (at E:T ratio of 0.5:1) and anti-IFNγ blocking antibody (or isotype; 10 μg ml–1) for 24 h (n = 2 per group). c, Indicated B16-OVA tumour cell viability after co-culture with OT-I cells at E:T ratio of 0.5:1 for 24 h (n = 3 per group). d, Control and VDAC2-deficient B16-OVA tumour cell death after treatment with or without IFNγ (10 ng ml–1) for 24 h (n = 3 per group). e, LDH release from control and VDAC2-deficient B16-OVA tumour cells treated with or without IFNγ (10 ng ml–1) or TNF (10 ng ml–1) for 24 h (n = 3 per group). f, Ametrine+ control or VDAC2-deficient B16-OVA tumour cells were mixed at a 1:1 ratio with mCherry+ spike B16-OVA cells and treated with or without indicated cytokines for 24 h. The relative number of control or VDAC2-deficient cells compared with internal spike cell control is shown (n = 3 per group). g, Immunoblot analysis of pro- (P35) and cleaved (P19 and P17) caspase-3; pro- (P35) and cleaved (P20) caspase-7; or pro- (P53) and activated (P34) GSDME in control or VDAC2-deficient B16-OVA tumour cells treated with IFNγ for indicated timepoints. h, Immunoblot analysis of pro- (P53) and activated (P34) GSDME in indicated B16-OVA tumour cells treated with or without IFNγ for 18 h. i, Expression of caspase-3, caspase-7 and GSDME in indicated B16-OVA tumour cells. j, k, Real-time survival analysis of indicated B16-OVA tumour cells after treatment with 1 ng ml–1 (j) or 10 ng ml–1 (k) of IFNγ (n = 2 per group). l, Control and VDAC2-deficient B16-OVA tumour cell death before or after treatment with IFNγ (10 ng ml–1) plus pan-caspase inhibitor emricasan, ferroptosis inhibitor ferrostatin-1 (Fer-1), necroptosis inhibitor necrostatin-1 (Nec-1) or GSDMD-mediated pyroptosis inhibitor disulfiram for 24 h (n = 3 per group). m, Activated caspase-3+ cells among control (n = 7) and VDAC2-deficient (n = 5) B16-OVA tumours. n, Immunoblot analysis of indicated proteins in control or VDAC2-deficient B16-OVA tumour lysates at day 19 after tumour inoculation. Tumour-bearing mice were treated with isotype IgG or anti-PD-L1 antibody at days 7, 10 and 13 after tumour inoculation (n = 3 per group). Densiometric quantification of cleaved (P19) caspase-3, cleaved (P20) caspase-7 and activated (P34) GSDME is shown. o, IFNγ levels in B16-OVA tumour lysates at day 19 after tumour inoculation. Tumour-bearing mice were treated with isotype IgG or anti-PD-L1 antibody at days 7, 10 and 13 after tumour inoculation (n = 6 per group). p, Relative expression of Vdac1, Vdac2 and Vdac3 in indicated mouse cells from publicly available scRNA-seq dataset (GSE121861), which profiled six syngeneic tumour models including B16-F10 melanoma, EMT6 breast mammary carcinoma, LL2 Lewis lung carcinoma, CT26 colon carcinoma, MC38 colon carcinoma and Sa1N fibrosarcoma. q, Relative expression of VDAC1, VDAC2 and VDAC3 in indicated human cell populations (from melanoma (GSE215121, left) and lung cancer (GSE148071, right) datasets). r, Real-time survival analysis of indicated B16-OVA tumour cells after treatment with 1 ng ml–1 (left; n = 2 per group) or 10 ng ml–1 (right; n = 2 per group) of IFNγ. The same control and VDAC2-deficient B16-OVA tumour cells are presented in Fig. 1l. Data are representative of three (d, m), two (a, c, fl, n) or one (b, e, o, r) independent experiments and are mean ± s.e.m. Two-tailed unpaired Student’s t-test (m, o). Two-way ANOVA (a, cf, l). Source Data
Extended Data Fig. 3
Extended Data Fig. 3. (related to Fig. 1). Targeting PTPN2 in VDAC2-deficient tumour cells enhanced anti-tumour immunity.
a, Control, VDAC2-deficient or PTPN2-deficient B16-OVA tumour cell viability after co-culture with OT-I cells at indicated E:T ratios for 36 h (n = 3 per group). b, Real-time survival analysis of indicated B16-OVA tumour cells after treatment with 1 ng ml–1 (left) or 10 ng ml–1 (right) of IFNγ (n = 5 for sgNTC in 1 ng ml–1 treatment group; n = 6 for other groups for both panels). c, C57BL6 mice were inoculated with indicated B16-OVA tumour cells, followed by treatment of tumour-bearing mice with isotype control (left panels) or anti-PD-L1 antibody (right panels) at days 7, 10, and 13 after tumour inoculation (n = 7 for isotype-treated groups; n = 8 for anti-PD-L1-treated groups). Tumour growth (first and third panels) and mouse survival (second and fourth panels) were monitored. d, Immunoblot analysis of VDAC2 and PTPN2 expression in control, VDAC2-deficient, PTPN2-deficient or VDAC2 and PTPN2 co-deficient B16-OVA tumour cells. e, Real-time survival analysis of indicated B16-OVA tumour cells after treatment with 1 ng ml–1 of IFNγ (n = 2 per group). f, C57BL/6 mice were inoculated with indicated B16-OVA tumour cells (n = 8 for sgNTC + sgNTC; 9 for all other groups). Tumour growth (left) and mouse survival (right) were monitored. Data are representative of three (a), two (b, e, f) or one (c, d) independent experiments and are mean ± s.e.m. One-way ANOVA (a). Two-way ANOVA (b; tumour size of c, f). Mantel−Cox test (survival of c, f). Source Data
Extended Data Fig. 4
Extended Data Fig. 4. (related to Fig. 2). VDAC2 deficiency reshapes TME and improves anti-tumour responses.
a, Numbers of conventional CD4+FOXP3 T cells, CD4+FOXP3+ Treg cells and B cells in control (n = 8) or VDAC2-deficient (n = 7) B16-OVA tumours on day 15 after tumour inoculation into C57BL/6 mice. b, Expression of Ifng and Prf1 in intratumoral CD8+ T cells from control (n = 710 cells) or VDAC2-deficient (n = 2,295 cells) B16-OVA tumours, from scRNA-seq profiling described in Fig. 2a. c, Quantification of the geometric mean fluorescence intensities (gMFIs) of IFNγ, TNF and IL-2 in intratumoral CD8+ T cells from control (n = 7) or VDAC2-deficient (n = 5) B16-OVA tumour-bearing C57BL/6 mice on day 15 after tumour inoculation. df, Intratumoral CD8+ T cells from control and VDAC2-deficient B16-OVA tumours were profiled by scRNA-seq plus scTCR-seq as described in Fig. 2a (n = 2 biological replicates per group). UMAP plots coloured based on stem-like, effector-like and terminally differentiated CD8+ T cells among intratumoral CD8+ T cells (left), genotype (middle), or clonal expansion (right) (d). Relative expression of stem-like, effector-like and terminally differentiated CD8+ T cell-associated genes used to annotate the populations described in d (e). Frequencies of stem-like, effector-like and terminally differentiated CD8+ T cells from control and VDAC2-deficient B16-OVA tumours as described in d (f). g, PD-1 or PD-1+ CD8+ T cells were sort-purified from control and VDAC2-deficient B16-OVA tumours at day 14 after tumour inoculation and profiled by ATAC-seq (n = 4 each group). Bubble plot showing the top upregulated (Up) and downregulated (Down) pathways enriched in intratumoral PD-1 (upper) or PD-1+ (lower) CD8+ T cells from VDAC2-deficient versus control tumours. h, Frequencies of effector-like PD-1+Ki67+CD8+ T cells in control or VDAC2-deficient B16-OVA tumours as described in a (n = 6 per group). i, Schematic for long-term VDAC2 deficiency analysis (primary inoculation) and tumour re-inoculation (secondary inoculation) assay. Created in BioRender. Sun, R. (2025) https://BioRender.com/g06b183. j, Expression (based on gMFIs) of PD-L1, TNFRSF14, MHC-II, LGALS9 and CD86 on control (n = 6) or VDAC2-deficient (n = 6) B16-OVA tumour cells on day 15 (left) or 21 (right) after tumour inoculation as described in i. k, Expression (based on gMFIs) of PD-L1, TNFRSF14, MHC-II, LGALS9 and CD86 on control (n = 3) or VDAC2-deficient (n = 3) B16-OVA tumours on day 15 after tumour re-inoculation in secondary hosts as described in i. l, C57BL/6 mice were inoculated with control (n = 5) or VDAC2-deficient (n = 6) MC38-OVA tumours. Tumour growth (left) and endpoint tumour weight (on day 29, right) were monitored. m–q, Control or VDAC2-deficient MC38-OVA tumours were isolated as described in l (n = 5 per group). Frequencies and numbers of CD45+ cells (m), total CD8+ T cells (n), IFNγ+TNF+ CD8+ T cells (o), or GZMB+ CD8+ T cells (p) in tumours. Numbers of conventional CD4+FOXP3 T cells, CD4+FOXP3+ Treg cells and B cells (q). r, s, Activity scores of upregulated (first and third panels) or downregulated (second and fourth panels) gene signatures in intratumoral CD8+ T cells from VDAC2-deficient versus control B16-OVA tumours. Signatures were derived from published datasets of CD8+ T cells from anti-PD-1-treated versus isotype control-treated B16-OVA (r) or anti-PD-1-treated versus isotype control-treated MC38 (s) tumours. Box plots show the median with interquartile range of 25% to 75%. t, Correlation between VDAC2 expression with tumour inflammation signature (left), CCL5 expression (middle), or CD3D expression (right) in 33 cancer types from the TCGA database. P values were obtained by comparing the t-statistic to the t-distribution with n–2 degrees of freedom. u, v, Box plots showing the median with interquartile range of 25% to 75% of CIBERSORTx-inferred frequencies of infiltrated CD8+ T cells (left) and CD4+ T cells (left) in the RNA-seq analysis of skin cutaneous melanoma (SKCM) (u), and non-small cell lung cancer (NSCLC) (v) stratified by high (≥ median) or low (<median) VDAC2 expression. w, The overall survival of individuals with SKCM (from the TCGA database) stratified by high and low VDAC2-suppressed gene signature (see Methods). x, Survival of melanoma patients treated with anti-PD-1 ICB therapy stratified by high and low activity of VDAC2-suppressed gene signature (see Methods). Data are representative of three (a, c, h), two (j, lq) or one (k) independent experiments and are mean ± s.e.m. Two-tailed unpaired Student’s t-test (a, c, h, j, k; tumour weight of l; mq). Two-way ANOVA (tumour size of l). Two-tailed Wilcoxon rank sum test (b, r, s, u, v). Fisher’s exact test (g). Mantel−Cox test (w). Two-sided Wald test (x). Source Data
Extended Data Fig. 5
Extended Data Fig. 5. (related to Fig. 2). VDAC2 deficiency-associated improvement of anti-tumour immunity depends on CD8+ T cell-derived IFNγ.
a, b, C57BL/6 mice inoculated with control or VDAC2-deficient B16-OVA tumours were treated with anti-IFNγ (or isotype) on days –1, 3, 7 after tumour challenge (a, n = 6 for isotype-treated groups; 6 for sgNTC + anti-IFNγ; 5 for sgVdac2 + anti-IFNγ), or on days 7, 11, 15 after tumour challenge (b, n = 6 for isotype-treated groups; 6 for sgVdac2 + anti-IFNγ; 5 for sgNTC + anti-IFNγ). Tumour growth was monitored. c, Relative expression of Ifng in indicated cell populations from control or VDAC2-deficient B16-OVA tumours from scRNA-seq profiling described in Fig. 2a. d, Frequency of CD8+ T cells in peripheral blood of mice receiving anti-CD8α depleting antibody (or isotype control) on days –1, 2, 5, 8 and 11 after tumour inoculation (n = 5 per group). e, C57BL/6 mice were inoculated with control or VDAC2-deficient B16-OVA tumours, followed by treatment with anti-CD8α (or isotype control) as described in d. Tumour growth (left) and mouse survival (right) were monitored (n = 10 per group). f, Frequencies of IFNγ+ CD8+ T cells in the peripheral blood of B16-OVA tumour-bearing control Ifngfl/fl or Cd8CreIfngfl/fl chimeras (n = 13 per group). g, Control and VDAC2-deficient B16-OVA tumour growth in Ifngfl/fl (n = 10 per group) and Cd8CreIfngfl/fl (n = 5 for sgNTC; 7 for sgVdac2) chimeras. Data are representative of two (f, g) or one (a, b, d, e) independent experiments and are mean ± s.e.m. Two-tailed unpaired Student’s t-test (f). Two-way ANOVA (a, b, d; tumour size of e; g). Mantel−Cox test (survival of e). Source Data
Extended Data Fig. 6
Extended Data Fig. 6. (related to Fig. 3). VDAC2 loss boosts IFNγ-triggered STING activation and type-I IFN response.
a, b, Bubble plots depicting upregulated (Up; red) and downregulated (Down; blue) pathways in VDAC2-deficient versus control B16-OVA tumour cells after treatment with IFNγ for 16 h (a) or OT-I cells for 24 h (b) (n = 4 samples per group). Pathways of interest are labelled in red. c, Overlapping upregulated Hallmark pathways in VDAC2-deficient versus control B16-OVA tumour cells from the indicated transcriptome profiling datasets. In vivo tumour denotes the scRNA-seq profiling data from Fig. 2a. d, Differential gene expression profiles in OT-I-treated VDAC2-deficient versus OT-I-treated control B16-OVA tumour cells (as described in b; n = 4 per group). Selective upregulated (red) and downregulated (blue) genes are annotated. e, Relative Ifnb1 and Ccl5 levels (versus non-treated control cells) in control or VDAC2-deficient B16-OVA tumour cells treated with IFNγ for indicated timepoints (n = 3 per group). f, Immunoblot analysis of indicated proteins in control and VDAC2-deficient B16-OVA tumour cells treated with or without IFNγ for indicated timepoints. Densiometric quantification of p-STING, p-TBK1 or p-IRF3 is shown. g, Immunoblot analysis of IRF3 and VDAC2 expression in control, VDAC2-deficient, IRF3-deficient or VDAC2 and IRF3 co-deficient B16-OVA tumour cells (left). Relative Ifnb1 levels (versus non-treated control cells; middle) and IFNβ levels (right) in culture supernatants of indicated B16-OVA tumour cells treated with IFNγ for 24 h (n = 3 per group). h, Immunoblot analysis MAVS and VDAC2 expression in control, VDAC2-deficient, MAVS-deficient or VDAC2 and MAVS co-deficient B16-OVA tumour cells (left). Relative Ifnb1 levels (versus non-treated control cells; middle) and IFNβ levels (right) in culture supernatants of indicated B16-OVA tumour cells treated with IFNγ for 24 h (n = 3 per group). The same control and VDAC2-deficient samples are presented in right panels of g and h. i, LDH release from control, VDAC2-deficient, cGAS-deficient, STING-deficient, IRF3-deficient, MAVS-deficient, VDAC2 and cGAS co-deficient, VDAC2 and STING co-deficient, VDAC2 and IRF3 co-deficient or VDAC2 and MAVS co-deficient B16-OVA tumour cells treated with IFNγ for 24 h (n = 3 per group). NS indicates no statistical differences in all groups versus sgNTC + sgNTC (left) or sgVdac2 + sgNTC (right). j, Cell death analysis of control or VDAC2-deficient B16-OVA tumour cells treated with or without IFNγ (10 ng ml–1) in the presence of anti-IFNαR1 antibody (or isotype control; 20 μg ml–1) for 24 h (n = 3 per group). k, Control (n = 8), VDAC2-deficient (n = 8), STING-deficient (n = 7), IRF3-deficient (n = 8), VDAC2 and STING co-deficient (n = 9), or VDAC2 and IRF3 co-deficient (n = 9) B16-OVA tumour cells were inoculated into C57BL/6 mice. Mouse survival was monitored. The same sgNTC and sgVdac2 groups are shown in left and right panels. ln, Relative Ccl5 levels (versus non-treated control cells) in indicated B16-OVA tumour cells treated with IFNγ for 24 h (n = 3 per group). The same control and VDAC2-deficient B16-OVA tumour cells are shown in m and n. o, Relative Ccl5 levels (versus non-treated control cells) in control or VDAC2-deficient B16-OVA tumour cells co-cultured with or without OT-I cells for 24 h (n = 4 per group). p, q, Ccl5 expression in control (n = 3,264 cells) or VDAC2-deficient (n = 3,290 cells) B16-OVA tumour cells (p) and Ccr5 expression in intratumoral CD8+ T cells from control (n = 710 cells) or VDAC2-deficient (n = 2,295 cells) B16-OVA tumours (q), as profiled by scRNA-seq as described in Fig. 2a. r, Numbers of total (left), IFNγ+TNF+ (middle), or GZMB+ (right) CD8+ T cells in control (n = 8 for total number; 7 for IFNγ+TNF+ and GZMB+ cell number), VDAC2-deficient (n = 7), CCL5-deficient (n = 8 for total number; 7 for IFNγ+TNF+ and GZMB+ cell number) or VDAC2 and CCL5 co-deficient (n = 8 for total number; 7 for IFNγ+TNF+ or GZMB+ cell number) B16-OVA tumours on day 14 after tumour inoculation. s, Representative images and Pearson’s correlation coefficient of HA-VDAC2 (based on HA staining; red) co-localization with mitochondria (based on TOMM20 staining; green). Scale bar, 100 μm (wide field) and 25 μm (3D zoom inset), n = 5. t, Representative images and quantification (n = 3,665 for sgNTC; 3,353 for sgVdac2) of dsDNA (red) co-localization with mitochondria (based on TOMM20 staining; green) in control and VDAC2-deficient B16-OVA tumour cells. Scale bar, 20 μm. The same assay was used in Fig. 3o for IFNγ-treated samples. u, Relative cytosolic mtDNA levels (versus control at 0 h) in control and VDAC2-deficient B16-OVA tumour cells after treatment IFNγ for indicated timepoints (n = 3 per group). v, Cytosolic mtDNA levels in control and VDAC2-deficient B16-OVA tumour cells treated with ethidium bromide (EtBr, 200 ng ml–1; denoted as “ρ0” cells) for mtDNA depletion (n = 4 per group). wy, Control and VDAC2-deficient B16-OVA tumour cells that lack or contain mtDNA were treated with or without IFNγ for 24 h. Immunoblot analysis of the indicated proteins, with densiometric quantification of phosphorylated p-TBK1 shown (w). IFNβ levels in culture supernatants (x, n = 4 per group) and relative Ccl5 levels (versus non-treated control cells) (y, n = 3 per group). z, Bubble plot depicting upregulated pathways in VDAC2-deficient versus control LoVo tumour cells after treatment with IFNγ for 48 h (n = 3 samples per group). Data are representative of three (h, left panel), two (f; middle panel in g; middle and right panels of h; mo, ry) or one (e; left panel of g, h) independent experiments and are mean ± s.e.m. Two-tailed unpaired Student’s t-test (e, t, u). One-way ANOVA (middle and right panels of g, h; i, j, l–n, r, v, x, y). Two-way ANOVA (o). Mantel−Cox test (k). Two-tailed Wilcoxon rank sum test (p, q). One sample t-test (s). Source Data
Extended Data Fig. 7
Extended Data Fig. 7. (related to Fig. 4). BAK-mediated MOMP occurs in the absence of VDAC2 and elicits tumour cell death and inflammation in response to IFNγ.
a, Enriched (red) and depleted (blue) sgRNAs in IFNγ-treated versus non-treated VDAC2-deficient B16-OVA tumour cells in genome-scale genetic interaction CRISPR screen described in Fig. 4a. b, Real-time survival analysis control, VDAC2-deficient, BAK-deficient, BAX-deficient, VDAC2 and BAK co-deficient or VDAC2 and BAX co-deficient B16-OVA tumour cells after treatment with 1 ng ml–1 (left; n = 2 per group) and 10 ng ml–1 (right; n = 2 per group) of IFNγ. c, LDH release from indicated B16-OVA tumour cells treated with or without IFNγ (10 ng ml–1) for 24 h (n = 3 per group). d, Control and VDAC2-deficient B16-OVA tumour cell death upon overexpression of BAK or BAX (as indicated) for 48 h (n = 3 per group). EV, empty vector. e, Relative Ifnb1 levels (versus non-treated control cells) in indicated B16-OVA tumour cells treated with IFNγ treatment for 24 h (n = 3 per group). f, Relative levels (versus non-treated control cells) of indicated IFN-responsive genes in indicated B16-OVA tumour cells treated with IFNγ for 24 h (n = 3 per group). g, Principal component analysis (PCA) plot of each sample in the microarray data from Fig. 4f, with the percentage of variance shown (n = 3 per group). h, FLAG-BAK or FLAG-BAX were stably co-expressed with HA-VDAC2 (or EV) in B16-OVA cells. The interaction between HA-VDAC2 and FLAG-BAK or FLAG-BAX was analysed by anti-HA or anti-FLAG immunoprecipitation (IP) and immunoblot (IB) analysis for FLAG and HA as indicated. i, Control or VDAC2-deficient B16-OVA tumour cells were treated with or without IFNγ (in the presence of the pan-caspase inhibitor Q-VD-OPh to inhibit cell death of VDAC2-deficient cells) for 24 h, or control cells were treated with ABT-737 (BCL-2 inhibitor) + S63845 (MCL-1 inhibitor) + Q-VD-OPh (pan-caspase inhibitor) (A + S group) for 6 h. Mitochondrial fractions were isolated, followed by treatment with sulfhydryl reactive cysteine crosslinker (1,6-bis-maleimidohexane, BMH) to promote formation of intramolecularly linked monomers and intermolecularly linked dimers and trimers. BAK and BAX molecules without cross-linked cysteines are labelled as monomers. Samples were separated by SDS-PAGE under reducing conditions to resolve these different BAK and BAX complexes. Densiometric quantification of BAK trimers and BAX dimers is shown. j, Time-lapsed fluorescence microscopy images of VDAC2-deficient B16-OVA tumour cells (with stable Omi-mCherry expression, which localizes to mitochondria inter-membrane space and is released upon MOMP) following IFNγ treatment for 16 h. Images were acquired immediately at 16 h and for 2 additional 15-minute timepoints thereafter (labelled as 16 h + 0 min, 16 h + 15 min and 16 h + 30 min). Scale bar, 20 μm. k, Immunoblot analysis of cytochrome c (Cyto c) and SMAC protein levels in cytosolic and mitochondrial fractions of control or VDAC2-deficient B16-OVA tumour cells treated with or without IFNγ for 24 h. Densiometric quantification of BAK is shown. l, Interaction between HA-VDAC2 (wild-type (WT) or mutants) and FLAG-BAK in indicated B16-OVA tumour cells was analysed by anti-HA or anti-FLAG IP and IB analysis for FLAG and HA. m, Immunoblot analysis of HA-VDAC2 and total VDAC2 in indicated B16-OVA tumour cells, with densiometric quantification of total VDAC2 shown. n, Immunoblot analysis of indicated proteins in control, VDAC2-deficient, MCL-1-deficient, or BCL-2-deficient B16-OVA tumour cells treated with or without IFNγ for 24 h. Densiometric quantification of p-TBK1 is shown. o, Real-time survival analysis of control (sgNTC), VDAC2-deficient (sgVdac2), MCL-1-deficient (sgMcl1 #1 or sgMcl1 #2) and BCL-2-deficient (sgBcl2 #1 or sgBcl2 #2) B16-OVA tumour cells treated with indicated concentrations of IFNγ (n = 4 per group). p, Relative Ifnb1 and Ccl5 levels (versus non-treated control cells) in control, VDAC2-deficient, BCL-2-deficient or MCL-1-deficient B16-OVA tumour cells treated with or without IFNγ (10 ng ml–1) for 24 or 48 h (n = 2 per group). q, Indicated B16-OVA tumour cells were treated with IFNγ (in the presence of the pan-caspase inhibitor Q-VD-OPh to block cell death) for 24 or 48 h. Mitochondrial fractions were isolated, followed by treatment with sulfhydryl reactive cysteine crosslinker (1,6-bis-maleimidohexane, BMH) to promote formation of dimers and trimers as described in i. r, Indicated B16-OVA tumour cell viability after co-culture with OT-I cells for 36 h at the indicated E:T ratios (n = 2 per group for 0:1; 3 per group for other E:T ratios). Similar statistics were observed for the second sgRNA as the first sgRNA targeting Mcl1 or Bcl2 in indicated comparisons (not depicted for clarity). Data are representative of three (h, i, k) or two (bf, j, lr) independent experiments and are mean ± s.e.m. One-way ANOVA (c, e, f, r). Two-way ANOVA (d, o). Source Data
Extended Data Fig. 8
Extended Data Fig. 8. (related to Fig. 4). IFNγ-mediated coordinated upregulation of BIM, BID and BAK contributes to cell death of VDAC2-deficient cells.
a, Relative gene expression of BCL-2 family proteins in control or VDAC2-deficient B16-OVA tumour cells after treatment with IFNγ for indicated timepoints (n = 4 per group). b, Immunoblot analysis of indicated proteins in B16-OVA tumour cells after treatment with IFNγ for indicated timepoints. The same VDAC2 and β-Actin blots were shown in Fig. 3i. c, Immunoblot analysis of indicated proteins in B16-OVA tumour cells treated with vehicle, IFNγ (10 ng ml–1), cisplatin (20 μM), or etoposide (20 μM) for 12 h. Densiometric quantification of BIM, BID, BAK, BAX, PUMA, or p53 expression is shown. d, Immunoblot analysis of indicated proteins in control, STAT1-deficient or IRF1-deficient B16-OVA tumour cells treated with IFNγ for indicated timepoints. Densiometric quantification of BIM, BID, BAK and STING expression is shown. e, Relative Bcl2l11, Bid, Bak1 and Sting1 levels (versus non-treated control cells) in indicated B16-OVA tumour cells treated with or without IFNγ for 12 h (n = 3 per group). f, Immunoblot analysis of indicated proteins in control and VDAC2-deficient LoVo tumour cells treated with or without IFNγ for 48 h, with densiometric quantification of BIM, BID and BAK shown. The same VDAC2 and β-ACTIN blots were shown in Fig. 3s. g, Control, VDAC2-deficient, STAT1-deficient, VDAC2 and STAT1 co-deficient, IRF1-deficient or VDAC2 and IRF1 co-deficient (B16-OVA tumour cell survival after treatment with or without IFNγ (10 ng ml–1) for 24 h (n = 3 per group). h, Relative Ifnb1 and Ccl5 levels (versus non-treated control cells) indicated B16-OVA tumour cells treated with or without IFNγ (10 ng ml–1) for 24 h (n = 3 per group). i, Immunoblot analysis of BIM, BID and VDAC2 in control, VDAC2-deficient, BIM-deficient, BID-deficient, BIM and BID co-deficient, VDAC2 and BIM co-deficient, VDAC2 and BID co-deficient, or VDAC2, BIM, and BID co-deficient tumour cells (left). Cell death of indicated B16-OVA tumour cells treated with IFNγ (10 ng ml–1) for 24 h (right; n = 3 per group). j, Control, VDAC2-deficient, BIM and BID co-deficient, or VDAC2, BIM and BID co-deficient B16-OVA cell viability after co-culture with OT-I cells at the indicated E:T ratios for 36 h (n = 3 per group). k, Indicated B16-OVA cells were treated with IFNγ for 24 h. Mitochondrial fractions were isolated and treated with 1,6-bis-maleimidohexane (BMH). Samples were separated by SDS-PAGE to resolve different BAK complexes (monomers, dimers, and trimers as indicated). Densiometric quantification of BAK trimers is shown. l, Expression of cytochrome c (Cyto c) and SMAC in cytosolic and mitochondrial fractions of indicated B16-OVA tumour cells treated with IFNγ for 24 h. m, Relative cytosolic mtDNA levels (versus non-treated control cells) in indicated B16-OVA tumour cells treated with or without IFNγ for 24 h (n = 3 per group). n, Immunoblot analysis of indicated proteins in B16-OVA tumour cells treated with or without IFNγ. Densiometric quantification of p-STING, p-TBK1 or p-IRF3 is shown. o, Relative Ifnb1 and Ccl5 levels (versus non-treated control cells) expression in indicated B16-OVA tumour cells treated with IFNγ for 24 h (n = 3 per group). p, Relative expression of genes (with differential expression (|log2FC | > 0.5, P value < 0.05) in VDAC2-deficient versus control tumour cells in indicated B16-OVA tumour cells after treatment with IFNγ for 24 h (n = 3 per group). Data are representative of two (bo) independent experiments and are presented mean ± s.e.m. One-way ANOVA (g, h; right panel for i; j, m, o). Two-way ANOVA (e). Source Data
Extended Data Fig. 9
Extended Data Fig. 9. (related to Fig. 4). Co-targeting APAF-1 or caspase-9 further enhanced STING activation in IFNγ-stimulated VDAC2-deficient tumour cells.
a, Real-time survival analysis of control, VDAC2-deficient, APAF-1-deficient, caspase-9-deficient, VDAC2 and APAF-1 co-deficient or VDAC2 and caspase-9 co-deficient B16-OVA tumour cells after treatment with 1 ng ml–1 (left; n = 2 per group) or 10 ng ml–1 (right; n = 2 per group) of IFNγ. The same control and VDAC2-deficient B16-OVA tumour cells are presented in Extended Data Fig. 7b. b, c, Cell death (b) or LDH release (c) of control, VDAC2-deficient, BAK-deficient, APAF-1-deficient, caspase-9-deficient, VDAC2 and BAK co-deficient, VDAC2 and APAF-1 co-deficient or VDAC2 and caspase-9 co-deficient B16-OVA tumour cells treated with IFNγ (10 ng ml–1) for 24 h (n = 3 per group). d, e, Cell death of control and VDAC2-deficient B16-OVA tumour cells treated with IFNγ (10 ng ml–1) plus indicated pan-caspase inhibitors (or vehicle) for 24 h (d; n = 3 per group) or 72 h (e; n = 3 per group). f, g, Cell death (f) or LDH release (g) of indicated B16-OVA cells treated with IFNγ (10 ng ml–1) for 72 h (n = 3 per group). h, Immunoblot analysis of indicated proteins in indicated B16-OVA tumour cells treated with or without IFNγ for 24 h. Densiometric quantification of p-TBK1 is shown. i, Relative Ifnb1 levels (versus non-treated control cells) in indicated B16-OVA tumour cells treated with IFNγ for 24 h (n = 3 per group). j, IFNβ protein levels in culture supernatants from indicated B16-OVA tumour cells treated with IFNγ for 24 h (n = 3 per group). k, Relative levels of IFN-responsive genes (versus non-treated control cells) in indicated B16-OVA tumour cells treated with IFNγ for 24 h (n = 3 per group). l, Relative Ifnb1 and Ccl5 levels (versus non-treated control cells) in control, VDAC2-deficient, caspase-3-deficient, caspase-7-deficient, VDAC2 and caspase-3 co-deficient, or VDAC2 and caspase-7 co-deficient B16-OVA cells treated with or without IFNγ for 24 h (n = 3 per group). m, Relative Ifnb1 and Ccl5 levels in control and VDAC2-deficient B16-OVA tumour cells treated with IFNγ (10 ng ml–1) plus indicated pan-caspase inhibitors (or vehicle) for 24 h. Vehicle label indicates no IFNγ treatment (n = 3 per group). n, Bubble plots showing upregulated (red; Up) and downregulated (blue; Down) pathways in IFNγ-treated VDAC2 and APAF-1 co-deficient B16-OVA tumour cells versus IFNγ-treated VDAC2-deficient B16-OVA tumour cells (n = 3 per group). o, C57BL/6 mice were inoculated with control (n = 8), VDAC2-deficient (n = 8), APAF-1-deficient (n = 7), caspase-9-deficient (n = 7), VDAC2 and APAF-1 co-deficient (n = 8) or VDAC2 and caspase-9 co-deficient (n = 8) B16-OVA tumour cells. Tumour growth (left) and mouse survival (right) were monitored. p, C57BL/6 mice were inoculated with control and VDAC2-deficient B16-OVA tumour cells, followed by vehicle or emricasan (i.p. 20 mg kg–1, twice a day) treatment on days 8–10 after tumour inoculation (n = 10 per group). Tumour growth (left) and mouse survival (right) were monitored. q, Numbers of CD45+ cells (left) and CD8+ T cells (right) in control, VDAC2-deficient, BAK-deficient or VDAC2 and BAK co-deficient B16-OVA tumours on day 14 after tumour inoculation (n = 8 per group). r, Numbers of IFNγ+TNF+ (left) or GZMB+ (right) CD8+ T cells in tumours described in q (n = 8 per group). s, t, C57BL/6 mice were inoculated with control (n = 7), VDAC2-deficient (n = 8), BAK-deficient (n = 7), or VDAC2 and BAK co-deficient (n = 8) B16-OVA tumour cells in combination with isotype (left) or anti-PD-L1 (right) treatment on days 7, 10, and 13 after tumour inoculation. Tumour growth (s) and mouse survival (t) were monitored. Data are representative of two (am, o, qt) or one (p) independent experiments and are mean ± s.e.m. One-way ANOVA (b, c, f, g, i − l, q, r). Two-way ANOVA (d, e, m; tumour size of o, p, s). Mantel−Cox test (survival of o, p, t). Source Data
Extended Data Fig. 10
Extended Data Fig. 10. (related to Fig. 4). IFNγ signalling does not induce cell death in non-tumorigenic cells lacking VDAC2.
a, Cell death analysis of control and VDAC2-deficient MEFs treated with or without IFNγ (10 ng ml–1, 24 h), ΤNF (10 ng ml–1) plus cycloheximide (CHX, 5 μg ml–1, 4 h), or etoposide (20 μM, 24 h), based on Annexin-V and 7-AAD co-staining (left; n = 3 per group) and live cell number counts (right; n = 3 per group). b, Cell death analysis of control and VDAC2-deficient OT-I cells treated with or without IFNγ (10 ng ml–1) or anti-IFNγ (10 μg ml–1) for 24 h, based on Annexin-V and 7-AAD co-staining (left; n = 3 per group) and live cell number counts (right; n = 3 per group). c, B16-OVA tumour growth (left) and mouse survival (right) in mice that received Cas9-expressing OT-I cells transduced with sgNTC (n = 8) or sgVdac2 (n = 9) on day 12 after tumour inoculation. No cell transfer group (n = 5) shows mice without adoptive transfer of OT-I cells. d, Cell death analysis of control and VDAC2-deficient iTreg (left; n = 3 per group) or TH1 (right; n = 3 per group) CD4+ T cells treated with or without IFNγ (10 ng ml–1) or anti-IFNγ (10 μg ml–1) for 24 h. e, Immunoblot analysis of indicated proteins in control or VDAC2-deficient MEFs treated with or without indicated concentrations of IFNγ, with densiometric quantification of BIM, BID or BAK expression shown. f, Immunoblot analysis of indicated proteins in control or VDAC2-deficient OT-I cells treated with or without IFNγ or anti-IFNγ. Densiometric quantification of BIM, BID or BAK expression is shown. g, Immunblot analysis of indicated proteins in B16-OVA tumour cells and MEFs treated with or without IFNγ (10 ng ml–1) for 12 or 24 h, with densiometric quantification of BIM, BID, and BAK expression shown. h, Two-step model for IFNγ-dependent tumour cell destruction and inflammatory remodelling by the VDAC2–BAK axis. In both wild-type (not depicted) and VDAC2-deficient tumour cells, IFNγ signalling upregulates pro-apoptotic BIM, BID and BAK as well as STING, in a STAT1- and/or IRF1 (not depicted)-dependent manner. This coordinate upregulation sensitizes tumour cells to cell death and cGAS–STING activation that is tuned by the VDAC2–BAK axis. Specifically, in wild-type (depicted as Vdac2+/+) cells, BAK co-localizes with and is inhibited by VDAC2, which acts to counterbalance IFNγ-induced sensitizing effects. Accordingly, wild-type cells are protected from these effects, thereby enabling tumour immune evasion. In the absence of VDAC2 (depicted as Vdac2–/–), tumour cells respond to IFNγ stimulation by enhancing BIM- and BID-mediated BAK activation and MOMP, accompanied by uncontrolled mitochondrial cytochrome c release to the cytosol and subsequent cell death. In parallel, aberrant accumulation of cytosolic mtDNA activates cGAS–STING signalling, thereby triggering type-I IFN response and CCL5 production, which enhances CD8+ T cell accumulation in the TME and promotes anti-tumour immunity. Created in BioRender. Yuan, S. (2025) https://BioRender.com/n19m747. Data are representative of two (a, b, e, g) or one (c, d, f) independent experiments and are mean ± s.e.m. Two-way ANOVA (a, b; tumour growth of c; d). Mantel−Cox test (survival of c). Source Data

References

    1. Waldman, A. D., Fritz, J. M. & Lenardo, M. J. A guide to cancer immunotherapy: from T cell basic science to clinical practice. Nat. Rev. Immunol.20, 651–668 (2020). - PMC - PubMed
    1. Sharma, P. et al. Immune checkpoint therapy-current perspectives and future directions. Cell186, 1652–1669 (2023). - PubMed
    1. Mellman, I., Chen, D. S., Powles, T. & Turley, S. J. The cancer-immunity cycle: indication, genotype, and immunotype. Immunity56, 2188–2205 (2023). - PubMed
    1. Golstein, P. & Griffiths, G. M. An early history of T cell-mediated cytotoxicity. Nat. Rev. Immunol.18, 527–535 (2018). - PubMed
    1. Wang, W. et al. CD8+ T cells regulate tumour ferroptosis during cancer immunotherapy. Nature569, 270–274 (2019). - PMC - PubMed

MeSH terms

Substances