. 2025 Jul;21(7):1523-1543.
doi: 10.1080/15548627.2025.2477385. Epub 2025 Mar 19.

Kit-mediated autophagy suppression driven by a viral oncoprotein emerges as a crucial survival mechanism in Merkel cell carcinoma

Affiliations

Kit-mediated autophagy suppression driven by a viral oncoprotein emerges as a crucial survival mechanism in Merkel cell carcinoma

Hao Shi et al. Autophagy. 2025 Jul.

Abstract

The KIT/c-KIT proto-oncogene is frequently over-expressed in Merkel cell carcinoma (MCC), an aggressive skin cancer commonly caused by Merkel cell polyomavirus (MCPyV). Here, we demonstrated that truncated MCPyV-encoded large T-antigen (LT) suppressed macroautophagy/autophagy by stabilizing and sequestering KIT in the paranuclear compartment via binding VPS39. KIT engaged with phosphorylated BECN1, thereby enhancing its association with BCL2 while diminishing its interaction with the PIK3C3 complex. This process ultimately resulted in the suppression of autophagy. Depletion of KIT triggered both autophagy and apoptosis, and decreased LT expression. Conversely, blocking autophagy in KIT-depleted cells restored LT levels and rescued apoptosis. Additionally, stimulating autophagy efficiently increased cell death and inhibited tumor growth of MCC xenografts in mice. These insights into the interplay between MCPyV LT and autophagy regulation reveal important mechanisms by which viral oncoproteins are essential for MCC cell viability. Thus, autophagy-inducing agents represent a therapeutic strategy in advanced MCPyV-associated MCC.Abbreviation: 3-MA, 3-methyladenine; AL, autolysosome; AP, autophagosome; Baf-A1, bafilomycin A1; BARA, β-α repeated autophagy specific domain; BH3, BCL2 homology 3 domain; CCD, coiled-coil domain; CHX, cycloheximide; Co-IP, co-immunoprecipitation; CQ, chloroquine; CTR, control; DAPI, 4',6-diamidino-2-phenylindole; EBSS, Earle's balanced salt solution; ECD, evolutionarily conserved domain; EEE, three-tyrosine phosphomimetic mutations Y229E Y233E Y352E; ER, endoplasmic reticulum; FFF, three-tyrosine non-phosphomimetic mutations; FFPE, formalin-fixed paraffin-embedded; FL, full-length; GIST, gastrointestinal stromal tumor; IB, immunoblotting; IHC, immunohistochemistry; KIT-HEK293, KIT stably expressing HEK293 cells; KRT20/CK20, keratin 20; LT, large T-antigen; LT339, MCPyV truncated LT antigen; LTco, codon-optimized MCPyV LT antigen; MCC, Merkel cell carcinoma; MCPyV-, MCPyV-negative; MCPyV, Merkel cell polyomavirus; MCPyV+, MCPyV-positive; PARP1, poly(ADP-ribose) polymerase 1; PCI, pan-caspase inhibitor; PI, propidium iodide; PtdIns3K, class III phosphatidylinositol 3-kinase; PtdIns3P, phosphatidylinositol-3-phosphate; RB1, RB transcriptional corepressor 1; RTKs, receptor tyrosine kinases; KITLG/SCF, KIT ligand; sT, small T-antigen; sTco, codon-optimized MCPyV sT antigen; T-B, Tat-BECN1; T-S, Tat-scrambled; TEM, transmission electron microscopy.

Keywords: Autophagy; BECN1; KIT; Merkel cell carcinoma; Merkel cell polyomavirus; large T antigen.


Conflict of interest statement

No potential conflict of interest was reported by the author(s).

Figures

Figure 1.
Figure 1.
Paranuclear KIT dot is associated with MCPyV+ MCC. (A) Representative immunofluorescence images of KIT (green) staining in MCPyV+ and MCPyV MCC cell lines and primary cultures. (B) Left: examples of paranuclear KIT dots in MCPyV+ and cytoplasmic/membranous staining in MCPyV tumors from the Karolinska cohort by IHC. (C) Left: immunofluorescence co-detection of KIT (green) and LT (red) in MCPyV+ and MCPyV tumors from the Helsinki cohort. (B and C) Right: proportion of tumors with KIT paranuclear dot or membranous/cytoplasmic staining. ***p < 0.001, Fisher’s exact test. (A-C) Insets refer to enlarged images of a single representative cell. Scale bar: 10 μm. (A and C) Nuclei were counterstained with DAPI (blue).
Figure 2.
Figure 2.
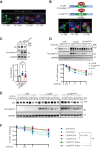
MCPyV truncated LT induces paranuclear retention and stabilization of KIT. (A) Immunofluorescence detection of KIT (green) and MCPyV LT (CM2B4, red) or sT (CM8E6, red) in KIT-HEK293 cells transfected with MCPyV T-antigens or vector control (n = 6). (B) Top: illustration of the expression constructs of LT339 and the VPS39-interaction defective mutant LT339W209A. Bottom: Representative images showing the effect of LT339 and LT339W209A mutant on localization of KIT (green). LT was detected by CM2B4 (red). (n = 3) (C) Immunoblots showing the effect of the LT339 and LT339W209A on KIT expression. The quantification of KIT level is shown below the immunoblots (n = 9). (D) Top: immunoblot analysis of the effect LT339 and LT339W209A on KIT protein stability in the presence of cycloheximide (CHX) up to 4 h. Bottom: quantification of KIT protein stability after normalization to 0 h time point (n = 4). (E) Immunoblots showing KIT protein stability in KIT-HEK293 cells transfected with LT339, LT339W209A or plasmid control (CTR) treated with KIT ligand (KITLG, 100 ng/mL) or solvent control (PBS) in the presence of CHX (100 μg/mL). (F) Quantification of KIT protein stability after normalization to 0 h time point (n = 5). Solid lines represent PBS control (KITLG) and dotted lines represent KITLG treatment (KITLG+). (A and B) Nuclei were stained by DAPI (blue). Scale bar: 10 μm. Numbers below the images refer to the proportion of cells with KIT paranuclear dot-like staining to the total number of cells analyzed. (C, D and F) Error bars represent mean ± SEM. *p < 0.05, ***p < 0.001, ns = not significant were calculated by one-way ANOVA with post-hoc Tukey’s test (C), two-way ANOVA (D) or two-way ANOVA with post-hoc Bonferroni’s test (F).
Figure 3.
Figure 3.
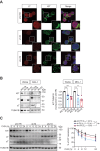
Silencing MCPyV T-antigens reduces KIT protein level and stability. (A) Immunofluorescence detection of KIT (green) and MCPyV LT (red) in WaGa cells transfected with short-hairpin RNA targeting both LT and sT (shTA), sT only (shsTA) or vector control (shCTR). Insets refer to enlarged images of a single representative cell. Scale bar: 10 μm. (B) Immunoblot analysis of KIT level upon silencing of MCPyV T-antigens. TUBA1B, loading control. (n = 6 for WaGa and n = 5 for MKL-1). (C) Immunoblots and quantification of the KIT protein stability upon silencing of MCPyV T-antigens (n = 5). (B and C) Error bars represent mean ± SEM. *p < 0.05, **p < 0.01, ***p < 0.001, ns = not significant were calculated by one-way ANOVA with post-hoc Dunnett’s test (B) or two-way ANOVA (C).
Figure 4.
Figure 4.
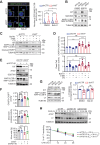
KIT interacts with BECN1, altering its interactome and inhibiting PIK3C3 kinase activity. (A and B) Representative immunoblots showing the interaction between BECN1 and KIT in MCPyV+ and MCPyV cells co-immunoprecipitated with anti-KIT (A) or anti-BECN1 (B). IP, immunoprecipitation. IB, immunoblotting. (C) Schematic illustration of the BECN1 protein with its annotated functional domains and different BECN1 expression constructs. The results of the KIT interaction were based on the experiments described in (D). (D) Representative immunoblots showing the interaction between BECN1 and KIT in KIT-HEK293 cells expressing different flag-tagged BECN1 expression constructs. IgG IP was used as a negative control. Quantification of the KIT pulled down by FLAG IP is shown on the right panel (n = 5). (E) Immunoblots showing the effect of LT339 and LT339W209A on BECN1 interactome. The IP efficiency is shown in figure S3C. The enrichment of BCL2 and PIK3C3 in FLAG IP is shown below the IB (n = 8). BCL2 and PIK3C3 in FLAG IP was quantified by normalization to their respective co-IP FLAG level and compared to LT339. (F) Immunoblot analysis of BECN1 interactomes in KIT-HEK293 cells co-transfected with FLAG-tagged three-tyrosine phosphomimetic (EEE) or non-phosphorylatable (FFF) BECN1 expression constructs together with LT339 or LT339W209A. Quantifications of the MAP1LC3B-II and SQSTM1 are shown below the corresponding IB. (G) Representative images showing the effect of LT339 and LT339W209A on GFP-FYVE dots (green). Quantification of the GFP-FYVE dots were counted from three independent experiments (CTR: n = 68; LT339: n = 38; LT339W209A: n = 39). Nuclei were stained by DAPI (blue). Scale bar: 10 μm. (H) The PIK3C3 kinase activity was evaluated in the FLAG IP lysates from cells expressing LT339 or LT339W209A using the PI3K lipid kinase assay (n = 4). (D, E, G and H) Error bars represent mean ± SEM. *p < 0.05, ***p < 0.001, ns = not significant, one-way ANOVA with post-hoc Dunnett’s (D) or Tukey’s (G and H), and paired t-test (E).
Figure 5.
Figure 5.
Silencing of KIT induces autophagy and reduces cell viability and LT expression in MCPyV+ WaGa cells. (A) Left: representative images showing GFP-MAP1LC3B puncta (green) in KIT silenced cells with bafilomycin A1 (Baf-A1; 40 nM, 2 h) or DMSO. Nuclei were stained by DAPI (blue). Scale bar: 10 μm. Right: quantification of GFP-MAP1LC3B puncta per cell (≥60 cells per condition, n = 5). Violin plot shows median (bold-line) and interquartile range (dotted-line). (B) Immunoblot analysis of KIT and autophagy markers (SQSTM1 and MAP1LC3B-II) upon silencing of KIT with and without Baf-A1 treatment. TUBA1B, loading control. (C) Immunoblot analysis of KIT silenced cells upon treatment with various autophagy inhibitors: Baf-A1 (10 nM, 6 h), 3-methyladenine (3-MA; 10 mm, 6 h) or chloroquine (CQ; 10 μM, 6 h). (D) Evaluation of cell death using CASP3-CASP7 and dead cell protease activity assays (n = 12). (E) Immunoblot analysis of KIT silenced cells with and without silencing of ATG7. (F) The effect on cell death was assessed by CASP3-CASP7 and dead cell protease activity assays and the quantification of viable cells was evaluated by trypan blue exclusion assay (n = 6). (G) Effect of KIT silencing on LT expression in experiments described in (B). Representative immunoblots and the quantification of LT expression are shown (n = 6). (H) Upper: representative immunoblots showing the effect of ATG7 silencing on LT protein stability after 48 h of transfection, followed by CHX (100 μg/mL) treatment. Lower: graph shows LT protein stability upon silencing of ATG7 (n = 13). (D, F, G and H) Error bars indicate mean ± SEM. *p < 0.05, **p < 0.01, ***p < 0.001, ns = not significant by unpaired t-test (A), one-way ANOVA with post-hoc Bonferroni’s-test (D, F and G), or two-way ANOVA (H).
Figure 6.
Figure 6.
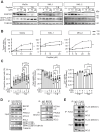
Tat-BECN1 peptide induces autophagy and cell death in vitro. (A) Three MCPyV+ MCC cell lines were treated with various concentrations of Tat-BECN1 (T-B) or Tat-scrambled (T-S) for 6 h, followed by IB analysis of autophagy markers SQSTM1 and MAP1LC3B-II. TUBA1B, loading control. (B) Evaluation of cell viability by trypan blue assay in (A) (WaGa: n = 5; MKL-1: n = 5; MKL-2: n = 4). (C) Treatment of WaGa cells with 10 μM T-S or T-B, together with 3-methyladenine (3-MA, an autophagy inhibitor) and/or the pan-caspase inhibitor (PCI, an apoptosis inhibitor). Propidium iodide (pi)-positive flow cytometry assay (n = 10), trypan-blue cell viability assay (n = 7) and CellTiter-glo assay (n = 4) were performed to evaluate cell viability upon different treatment conditions. (B and C) *p < 0.05, **p < 0.01, ***p < 0.001, ns = not significant, were calculated by two-way ANOVA (B) or one-way ANOVA with post-hoc Bonferroni’s-test (C). Data represent mean ± SEM. (D and E) The interaction between BECN1 and its interactome was evaluated using co-IP and IB in (D) WaGa cells or (E) KIT-HEK293 cells co-transfected with FLAG-tagged BECN1 and LT339 after treatment with 10 μM of T-B or T-S for 4 h. IgG-IP was used as a negative control. The MAP1LC3B-II:TUBA1B ratios relative to T-S treatment in BECN1 IP are shown below the IB.
Figure 7.
Figure 7.
Tat-BECN1 inhibits tumor growth in MCC xenograft. (A) Schematic illustration of the experimental design for the MCC xenograft model. (B) Tumor volume was measured every other day and calculated as stated in the method section. (C) Representative pictures of the xenograft tumors from mice treated with T-S or T-B after surgical excision. (D) The xenograft tumors were harvested and weighed at the end point (n = 6 for each condition) (E) Left: representative images of MKI67 expression determined by IHC in xenograft tumors from mice treated with T-S or T-B. Scale bar: 40 µm. Right: quantification of MKI67 h-score in xenograft tumors (n = 6 for each condition). Each filled circle represents the mean of MKI67 H-score within three randomly analyzed areas in each xenograft tumor. H-score was quantified using the QuPath software. (F) Representative images of MAP1LC3B expression determined by IHC in xenograft tumors from mice treated with T-S or T-B. Scale bar: 40 µm. (G) Top: immunoblots show the expressions of SQSTM1, MAP1LC3B and LT in xenograft tumors from the T-S and T-B treatment groups. Bottom: quantification of SQSTM1, MAP1LC3B-II and LT levels in xenograft tumors by IB (n = 5). (H) Representative images show the ultrastructure of xenograft tumors analyzed by transmission electron microscopy. Autophagic vesicles are indicated as AP (autophagosomes, yellow arrowheads) and AL (autolysosomes, blue arrowheads). A total of 39 and 57 TEM images from two xenograft tumors in T-S and T-B treatment group, respectively, were analyzed. Insets refer to enlarged images of autophagic vesicles AP and AL. Scale bar: 3 μm in overview images and 300 nm in inset images. (B, D, E, G and H) Data represent mean ± SEM. *p < 0.05, **p < 0.01, ns = not significant were assessed by two-way ANOVA (B), Mann-Whitney U-test (D, E and G), and unpaired t-test (H).
Figure 8.
Figure 8.
Model of kit-mediated autophagy suppression by MCPyV LT in MCC. In normal cells, newly synthesized KIT proteins traffic from the endoplasmic reticulum (ER) to the golgi apparatus, where they undergo a series of glycosylations before being transported to the plasma membrane. After binding to its ligand KITLG, KIT is phosphorylated and rapidly internalized by endocytosis and then degraded by lysosomes or recycling to the cell surface. In MCPyV+ MCC cells, the endocytosed KIT is blocked from degradation by the LT-VPS39 interaction, which leads to stabilization of KIT in the paranuclear compartment. The paranuclear KIT then interacts with BECN1 that enhances the interaction of BECN1 with BCL2 complex, leading to suppression of autophagy to support cell survival. MUR: MCPyV unique region of LT.

References

    1. Feng H, Shuda M, Chang Y, et al. Clonal integration of a polyomavirus in human Merkel cell carcinoma. Science. 2008;319(5866):1096–1100. doi: 10.1126/science.1152586 - DOI - PMC - PubMed
    1. Shuda M, Feng H, Kwun HJ, et al. T antigen mutations are a human tumor-specific signature for Merkel cell polyomavirus. Proc Natl Acad Sci U S A. 2008;105(42):16272–16277. doi: 10.1073/pnas.0806526105 - DOI - PMC - PubMed
    1. Houben R, Adam C, Baeurle A, et al. An intact retinoblastoma protein-binding site in Merkel cell polyomavirus large T antigen is required for promoting growth of Merkel cell carcinoma cells. Int J Cancer. 2012;130(4):847–856. doi: 10.1002/ijc.26076 - DOI - PubMed
    1. Borchert S, Czech-Sioli M, Neumann F, et al. High-affinity Rb binding, p53 inhibition, subcellular localization, and transformation by wild-type or tumor-derived shortened Merkel cell polyomavirus large T antigens. J Virol. 2014;88(6):3144–3160. doi: 10.1128/JVI.02916-13 - DOI - PMC - PubMed
    1. Hesbacher S, Pfitzer L, Wiedorfer K, et al. RB1 is the crucial target of the Merkel cell polyomavirus large T antigen in Merkel cell carcinoma cells. Oncotarget. 2016;7(22):32956–32968. doi: 10.18632/oncotarget.8793 - DOI - PMC - PubMed

Publication types