. 2025 Mar;21(3):e70026.
doi: 10.1002/alz.70026.

Interactions between menopause and high-fat diet on cognition and pathology in a mouse model of Alzheimer's disease

Affiliations

Interactions between menopause and high-fat diet on cognition and pathology in a mouse model of Alzheimer's disease

Charly Abi-Ghanem et al. Alzheimers Dement. 2025 Mar.

Abstract

Introduction: Post-menopausal women constitute about two-thirds of those with Alzheimer's disease (AD). Menopause increases dementia risk by heightening the likelihood of metabolic disease, a well-known risk factor for dementia. We aimed to determine the effects of menopause and high-fat diet (HF) on cognitive and pathological outcomes in an AD mouse model.

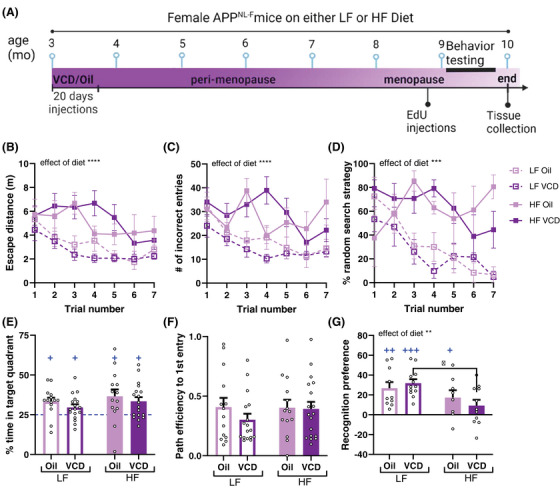
Methods: At 3 months old, AppNL-F mice received 4-vinylcyclohexene diepoxide (menopause model) or vehicle and were placed on a control (10% fat) or an HF diet (60% fat) until 10 months old.

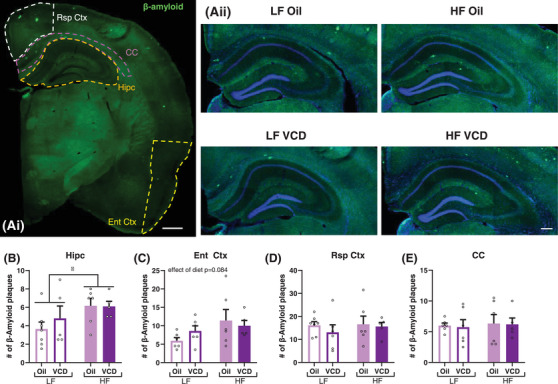
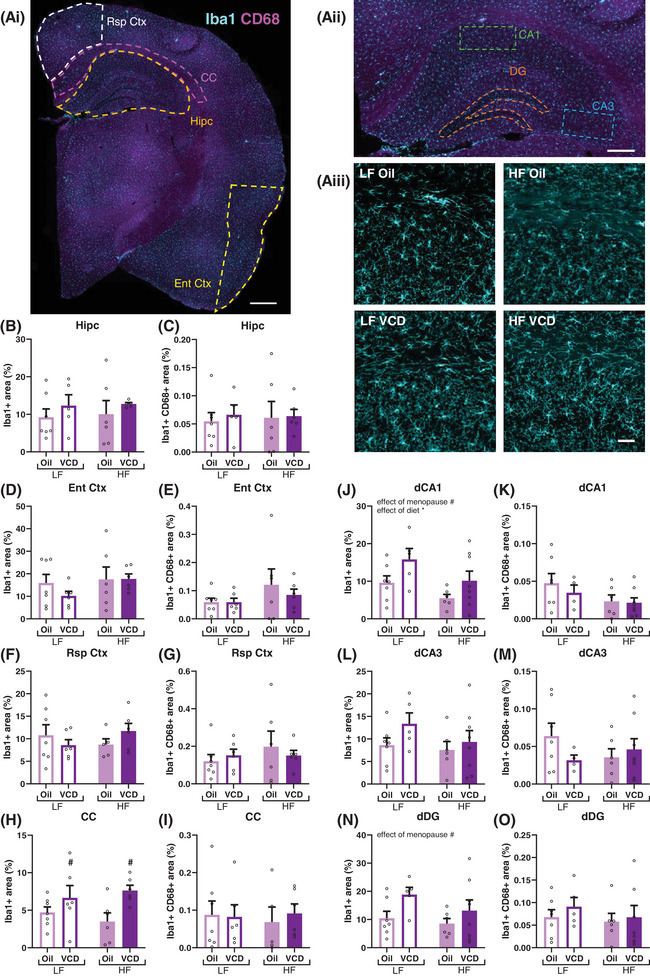
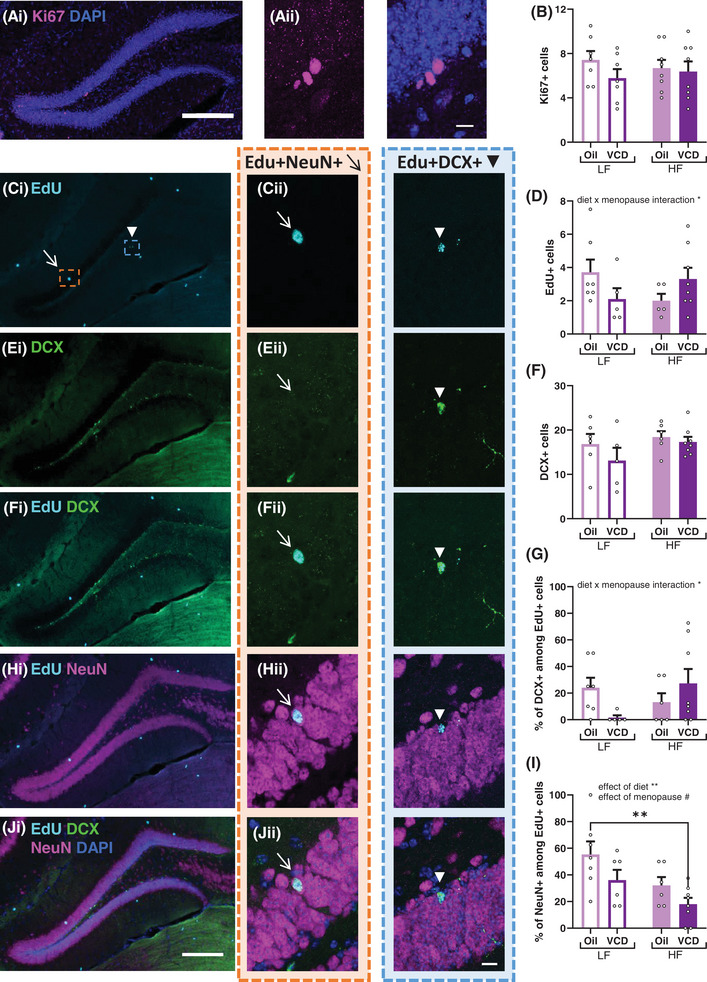
Results: An interaction between HF diet and menopause led to impaired recognition memory. No effects of menopause were observed on amyloid pathology. However, menopause induced alterations in microglial response, white matter, and hippocampal neurogenesis.

Discussion: This work highlights the need to model endocrine aging in animal models of dementia and contributes to further understanding of the interaction between menopause and metabolic health in the context of AD.

Highlights: The combination of menopause and HF diet led to early onset of cognitive impairment. HF diet increased amyloid pathology in the hippocampus. Menopause led to an increase in microglia density and a decrease in myelin in the corpus callosum. Menopause altered hippocampal neurogenesis in a diet-dependent manner.

Keywords: Alzheimer's disease; amyloid; menopause; metabolic disease; microglia; neurogenesis; white matter.


Conflict of interest statement

The authors have no conflicts to report. Author disclosures are available in the Supporting information.

Figures

FIGURE 1
FIGURE 1
Metabolic effects of HF diet in WT versus APPNL‐F female mice. (A) An experimental timeline is shown. Spatial learning as assessed using escape distance (B) and number of errors/incorrect entries (C) during the training trials (learning phase) of the Barnes maze. **** p < 0.0001 main effect of diet three‐way repeated‐measure ANOVA; n = 8–12 mice/group. (D) The percentage of mice in each experimental group within the cohort using a random search strategy to escape the Barnes maze plotted over the seven learning trials. *** p < 0.001 main effect of diet three‐way repeated‐measure ANOVA; n = 4 cohorts/timepoint. Spatial memory was assessed using the % time spent in the target quadrant (E), and path efficiency for first entry (F) during the probe (testing) trial of Barnes maze. (E) Plus signs (+) are used for a t‐test against chance (25%) indicating intact memory. + p < 0.05; n = 14–18 mice/group. Novel object recognition was used to test object recognition memory. (G) The preference difference between the old and new object at the same location. ** p < 0.01 two‐way ANOVA and Tukey's post‐hoc test; n = 8–12 mice/group. Plus signs (+) are used for a t‐test against chance (0) indicating intact memory. + p < 0.05, ++p < 0.01, +++p < 0.001. ANOVA, analysis of variance; HF, high‐fat; LF, low‐fat;VCD, 4‐vinylcyclohexene diepoxide (menopause model).
FIGURE 2
FIGURE 2
Effects of HF diet and menopause on amyloid pathology. Representative image of β‐amyloid (green) immunofluorescent labeling in a full hemisphere (Ai). Dotted lines represent different regions of interest including the cortex areas around the retrosplenial and motor cortex (Rsp Ctx, white) and around the entorhinal and piriform cortex (Ent Ctx, yellow), the hippocampus (Hipc, orange), and the corpus callosum (CC, magenta). Zoomed in representative images of the hippocampus of each of the experimental groups are shown in Aii. Scale bar in Ai 500  µm and in Aii 200 µm. Quantification of the number of plaques in the hippocampus (B), the Ent Ctx (C), the Rsp Ctx (D), and the CC (E). A two‐way ANOVA was used to assess the effect of diet and menopause; * p < 0.05 effect of diet; n = 3–7 mice/group. ANOVA, analysis of variance; HF, high‐fat; LF, low‐fat;VCD, 4‐vinylcyclohexene diepoxide (menopause model).
FIGURE 3
FIGURE 3
Effects of HF diet and menopause on microglia. Representative images of microglia labeling using anti‐Iba1 (cyan, microglia marker) and CD68 (magenta, lysosomal marker) are shown in Ai and Aii for hippocampal specific ROIs. Zoomed in representative images of the corpus callosum (CC) and the CA1 of the hippocampus (Hipc) of each of the experimental groups are shown in Aiii. Scale bar in Ai 500  µm, in Aii 250  µm, and in Aiii 50 µm.Quantification of the area density (%) occupied by the Iba1 labeling in the Hipc (B), Ent Ctx (D), Rsp Ctx (F), CC (H), CA1 (J), CA3 (L), and DG (N). Quantification of the area density (%) occupied by the Iba1 and the CD68 labeling in the cortex the Hipc (C), Ent Ctx (E), Rsp Ctx (G), CC (I), CA1 (K), CA3 (M), and DG (O). A two‐way ANOVA was used to assess the effect of diet and menopause; # p < 0.05 effect of menopause; * p < 0.05 effect of diet; n = 5–7 mice/group. ANOVA, analysis of variance; CA, cornu ammonis; DG, dentate gyrus; HF, high‐fat; LF, low‐fat; ROI, region of interest; VCD, 4‐vinylcyclohexene diepoxide (menopause model).
FIGURE 4
FIGURE 4
Effects of HF diet and menopause on myelin. Representative image of FluoroMyelin (green) staining in a full hemisphere (Ai). Dotted lines represent different regions of interest including the cortex areas around the retrosplenial and motor cortex (Rsp Ctx, white) and around the entorhinal and piriform cortex (Ent Ctx, yellow), the CA1 of the hippocampus (orange), the central part of the corpus callosum (CC center, magenta), and area of the CC above CA1 (CC mid, pink). Representative images of each experimental group are shown in Aii. Scale bar in Ai 500  µm and in Aii 200 µm. Measures of the center CC thickness in µm (B). Quantification of the fluorescent staining intensity in the CC center (C), the CC mid (D), the Rsp Ctx (E), the Ent Ctx (F), and the hippocampus (G). A two‐way ANOVA was used to assess the effect of diet and menopause; # p < 0.05 effect of menopause, * p < 0.05 effect of diet. Main effects are indicated above the graphs when there was a significant interaction or a trend. Tukey's post‐hoc test was used for multiple comparisons; * p < 0.05; ** p < 0.01; *** p < 0.001; n = 5–7 mice/group. ANOVA, analysis of variance; HF, high‐fat; LF, low‐fat; VCD, 4‐vinylcyclohexene diepoxide (menopause model).
FIGURE 5
FIGURE 5
Effects of HF diet and menopause on neurogenesis. The number of proliferating cells in the DG was assessed using Ki67 immunolabeling (Magenta, Ai, Aii). Representative images of EdU staining (Cyan, cells born ∼40days before endpoint), DCX (green, immature neurons), and NeuN (magenta, mature neurons) are shown in panels C‐J with i panels showing the entire Hipc and ii panels zoomed in on specific cells (orange shaded boxes and arrows show EdU+NeuN+ cells, blue shaded boxes and arrowheads show EdU+DCX+ cells). DAPI (cell nuclei) is in blue in panels A and J. Scale bar in i 200  µm and in ii 10 µm. Quantification, in the dentate gyrus, of the number of Ki67+ cells (B), EdU+ cells (D), DCX+ cells (F), the percentage of DCX+ cells among the EdU+ cells (G), and the percentage of NeuN+ cells among the EdU+ cells (I). A 2‐way ANOVA was used to assess the effect of diet and menopause. Main effects are indicated above the graphs when there was a significant interaction. Tukey's post‐hoc test was used for multiple comparisons; * p < 0.05; n = 5–8 mice/group. ANOVA, analysis of variance; DCX, doublecortin; EdU, 5‐ethynyl‐2′‐deoxyuridine; HF, high‐fat; LF, low‐fat; VCD, 4 vinylcyclohexene diepoxide (menopause model).

References

    1. 2024 Alzheimer's disease facts and figures. Alzheimers Dement. 2024;20(5):3708‐3821. - PMC - PubMed
    1. Rocca WA, Grossardt BR, Maraganore DM. The long‐term effects of oophorectomy on cognitive and motor aging are age dependent. Neurodegener Dis. 2008;5(3‐4):257‐260. - PMC - PubMed
    1. Livingston G, Costafreda SG. Interventions to prevent dementia should target those at high risk. Lancet. 2023;402(10404):750‐751. - PubMed
    1. Bove R, Secor E, Chibnik LB, et al. Age at surgical menopause influences cognitive decline and Alzheimer pathology in older women. Neurology. 2014;82(3):222‐229. - PMC - PubMed
    1. Mosconi L, Rahman A, Diaz I, et al. Increased Alzheimer's risk during the menopause transition: a 3‐year longitudinal brain imaging study. PLoS One. 2018;13(12):e0207885. - PMC - PubMed