. 2025 May;14(12):e2405129.
doi: 10.1002/adhm.202405129. Epub 2025 Mar 20.

Functionalized Cerium Oxide Nanoparticles Enhance Penetration into Melanoma Spheroids In Vivo through Angiogenesis

Affiliations

Functionalized Cerium Oxide Nanoparticles Enhance Penetration into Melanoma Spheroids In Vivo through Angiogenesis

Lu Fu et al. Adv Healthc Mater. 2025 May.

Abstract

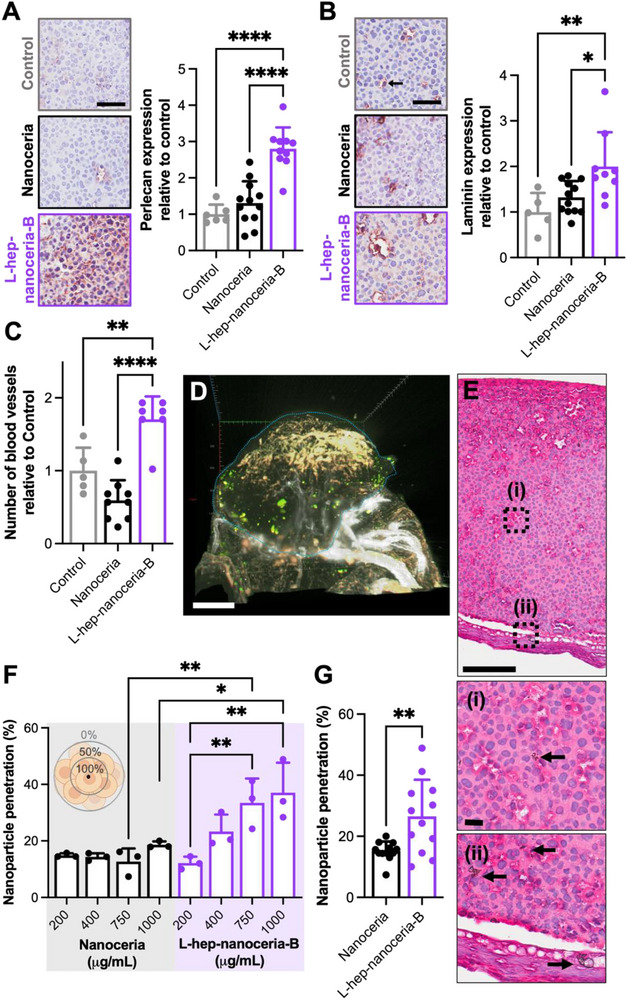
Angiogenesis is a crucial step in tumor progression, including melanoma, making anti-angiogenic strategies a widely explored treatment approach. However, both innate and acquired resistance to these therapies suggest that this approach may need re-evaluation. Nanoparticles have gained attention for their potential to enhance drug delivery and retention within tumors via the bloodstream. However, the in vitro screening of nanoparticles is limited by the inability of preclinical models to replicate the complex tumor microenvironment, especially the blood supply. Here, it is demonstrated that melanoma cells embedded in Matrigel spheroids can engraft in and be vascularized by the chorioallantoic membrane (CAM) of fertilized chicken eggs. This model allows for the assessment of nanoparticle toxicity and accumulation in tumor spheroids, as well as functional effects such as angiogenesis. Cerium oxide nanoparticles (nanoceria) and their surface functionalized derivatives are widely explored for biomedical applications due to their ability to modulate oxidative stress and angiogenesis. Here, it is observed that heparin functionalized nanoceria penetrate melanoma spheroids in the CAM and promote spheroid vascularization to a greater extent than nanoceria alone. This study aids in the development of preclinical cancer models for nanoparticle screening and provides new insight into the interplay between nanoparticle surface coatings and biological effects.

Keywords: angiogenesis; cerium oxide; melanoma; nanoparticle; tumor spheroid.


Conflict of interest statement

The authors declare no conflict of interest.

Figures

Figure 1
Figure 1
Optimization of melanoma cell engraftment in the CAM measured by the proportion of fertilized eggs with successful engraftment at E11. A) Schematic of the different conditions tested to optimize melanoma cell engraftment in the CAM. Melanoma cells were either added to the CAM in a cell suspension, embedded in Matrigel prior to addition to the CAM (spheroid), the CAM was treated with trypsin (0.06%) prior to the addition of the spheroid (Spheroid + trypsin) or punctured with a 23 gauge (23G) needle (Spheroid + injury) immediately prior to spheroid administration. Cells were applied to the CAM on fertilized egg E7 (n = 7) or E8 (n = 64). Created with https://BioRender.com B) Analysis of CAM viability and melanoma cell engraftment in the CAM at E11.
Figure 2
Figure 2
Chicken vasculature expressing basement membrane penetrates the melanoma cell spheroid. A) Representative brightfield microscope micrograph of melanoma cell spheroids in the CAM on E11. Scale bar is 1 mm. B) Representative gross morphological appearance of the melanoma cell spheroids in the CAM at E14 stained with hemotoxylin and eosin (H&E). Scale bar is 200 µm. The boxed areas are shown at higher magnification in inset panels (i) – (iii). The dashed blue line indicates the melanoma cell spheroid margins. Scale bar is 50 µm. M indicates Matrigel. C) Representative light sheet microscope micrograph of blood vessels (white; Alexa Fluor 647‐wheatgerm agglutinin (WGA)) in a melanoma cell spheroid explanted from the CAM on E14. The dashed blue line indicates the spheroid margins, and the dashed yellow box is shown in a different projection in D). Scale bar is 1 mm in panels (C)–(D). E) Representative image of a melanoma cell spheroid in the CAM at E11 immunostained for laminin. The dashed blue line indicates the spheroid margins. Scale bar is 200 µm. F) High magnification of the boxed region in (E). G) Representative image of a similar region as shown in (E) immunostained for laminin on E14. H) Representative image of a similar region as shown in (E) immunostained for perlecan on E11. I) Representative image of a similar region as shown in (E) immunostained for perlecan on E14. Scale bar is 50 µm for panels (F)–(I).
Figure 3
Figure 3
Melanoma cells adhere to the endothelial cell ECM. A) Representative confocal microscope micrographs of melanoma cell morphology at 4 h post‐seeding on either TCP) or endothelial cell ECM showing polymerized actin fibers (Rhodamine‐phalloidin, red) and nuclei (DAPI, blue). Scale bar is 100 µm. B) Melanoma cell adhesion to ECM relative to TCP quantified from ≈10 images per experiment (n = 3). Data presented in a violin plot with the median indicated by the black line. C) Melanoma cell area when adhered on either TCP or ECM quantified from ≈10 images per experiment (n = 3). Data presented in a violin plot with the median indicated by the black line. **** ≤ 0.0001 analyzed by an unpaired student's t‐test.
Figure 4
Figure 4
Melanoma cells adhere to basement membrane components expressed by endothelial cells. Representative confocal microscopy micrographs of A) endothelial and B) melanoma cells immunostained for the expression of perlecan (clone A74), collagen type IV, laminin, and fibronectin (green). Cells were counterstained for the cell membrane (blue). Scale bar is 40 µm in panels (A)‐(B). C) Melanoma cell adhesion to isolated basement membrane components including collagen type IV, laminin, and perlecan. Data presented as mean ± SD (n = 3) relative to the level of cell adhesion on fibronectin. ** ≤ 0.01 and *** ≤ 0.001 analyzed by one‐way ANOVA.
Figure 5
Figure 5
Nanoceria are not cytotoxic to melanoma cells and are internalized. Melanoma cell number following exposure to nanoparticles (1–800 µg mL−1) relative to cells exposed to medium (Control) measured after 72 h by the MTS assay. 30% cell growth inhibition level is indicated by the dashed line. Data presented as mean ± SD (n = 3). B) Representative confocal microscope micrographs of the localization of nanoparticles (50 µg mL−1; conjugated with Alexa Fluor 488; green) with melanoma cells stained for polymerized actin fibers (rhodamine Phalloidin, red) and nuclei (Hoechst 33 342; blue) after 24 h. Scale bar is 20 µm. Nanoparticle association (50 µg mL−1) with cells measured by flow cytometry and presented as mean side scatter relative to cells exposed to medium (Control) after C) 24 or D) 72 h of exposure. Data presented as mean ± SD (n = 3). ****≤ 0.0001 analyzed by one‐way ANOVA. E) Intracellular rROS level following exposure of melanoma cells measured to nanoparticle (50 µg mL−1) for 24 h and then analyzed flow cytometry. Data presented as fold change in mean fluorescence intensity relative to cells exposed to medium (Control). Data are presented as mean ± SD (n = 3). *≤ 0.05 analyzed by one‐way ANOVA.
Figure 6
Figure 6
Nanoparticles do not alter the melanoma cell spheroid size or CAM blood vessel density surrounding the spheroids. A) Schematic of the timeline for melanoma cell spheroid addition to the CAM on E8, nanoparticle administration on E11 and spheroid explantation and analysis on E14. Created with https://BioRender.com B) Representative dissecting microscope micrographs of the melanoma cell spheroids in the CAM at E14 exposed to either nanoceria or L‐hep‐nanoceria‐B at doses of 200–1000 µg mL. The black arrow indicates a blood spot. Scale bar is 1 mm. C) Schematic of a melanoma spheroid implanted in the CAM analyzed for size (panel D, diameter) and the location of blood vessels analyzed for blood vessel density surrounding the melanoma spheroids at E14 (panel E) and the CAM blood vessel density (panel F). D) Melanoma cell spheroid diameter following exposure to nanoparticles between E11 and E14. Data are presented as mean ± SD (n = 6–9). < 0.05 for all comparisons. E) Blood vessel density surrounding the melanoma cell spheroid at E14. Data presented as mean ± SD (n = 4–7). > 0.05 for all comparisons. F) Blood vessel density in the CAM distant from the melanoma cell spheroid at E14. Data presented as mean ± SD (n = 3–7). The range in number of CAMs analyzed for each condition vary due to the engraftment rate as indicated in Figure 1. *≤ 0.05, ** ≤ 0.01, and ***≤ 0.001 analyzed by one‐way ANOVA compared to Control unless indicated otherwise.
Figure 7
Figure 7
Heparin functionalized nanoceria promote vascularization and penetrate the melanoma spheroid to a greater extent than nanoceria. A) Representative images of melanoma cell spheroid cross sections (central region) immunostained for perlecan (brown) and counter stained with hemotoxylin (purple). Spheroids were treated with nanoparticles on E11 and explanted from the CAM and prepared for histological analysis at E14. Scale bar is 40 µm. Quantification of perlecan expression for each condition represented relative to Control. Data presented as mean ± SD (n = 6–12). ****≤ 0.0001 analyzed by one‐way ANOVA. B) Representative images of melanoma cell spheroid cross sections (central region) immunostained for laminin (brown) and counter stained with hemotoxylin (purple). Spheroids were treated with nanoparticles on E11 and explanted from the CAM and prepared for histological analysis at E14. Scale bar is 40 µm. Quantification of laminin expression for each condition represented relative to Control. Data presented as mean ± SD (n = 5–12). * ≤ 0.05 and ** ≤ 0.01 analyzed by one‐way ANOVA. C) Quantification of the number of blood vessels for each condition represented relative to Control. Data presented as mean ± SD (n = 5–9). The range in number of CAMs analyzed for each condition vary due to the engraftment rate as indicated in Figure 1. * ≤ 0.05 and ** ≤ 0.01 analyzed by one‐way ANOVA. D) Representative light sheet microscope image of melanoma cells (orange) in a spheroid explanted from the CAM at E14 following treatment with Alexa Fluor 488 conjugated nanoceria (400 µg mL−1; green). The blood vessels are stained with Alexa Fluor 647‐WGA (white). The dashed blue line indicates the spheroid margins. Scale bar is 300 µm. E) Representative gross morphological appearance of the melanoma cell spheroids treated with nanoceria (400 µg mL−1) at E11 and explanted from the CAM at E14 and stained with H&E. Scale bar is 100 µm. The dashed blue line indicates the melanoma cell spheroid. The boxed areas are shown at higher magnification in inset panels (i) – (ii). Inset scale bar is 20 µm. Arrows indicate the position of nanoceria. F) Quantification of the penetration of different doses of nanoceria and L‐hep‐nanoceria‐B into the melanoma cell spheroid at E14 presented as the percentage of total spheroid thickness. Data presented as mean ± SD (n = 3). *< 0.05 and *≤ 0.01 analyzed by one‐way ANOVA. G) Quantification of the penetration of nanoceria and L‐hep‐nanoceria‐B (200–1000 µg mL−1) presented as a percentage of total spheroid. Data presented as mean ± SD (n = 12).

Similar articles

References

    1. Bhatia S., Tykodi S. S., Thompson J. A., Oncology 2009, 23, 488. - PMC - PubMed
    1. Gloster H. M. Jr., Brodland D. G., Dermatol. Surg. 1996, 22. - PubMed
    1. Mar V., Soyer H., Button‐Sloan A., Fishburn P., Gyorki D., Hardy M., Henderson M., Thompson J., Aust. J. Gen. Practit. 2020, 49, 733. - PubMed
    1. Furukawa K., Nagano T., Tachihara M., Yamamoto M., Nishimura Y., Molecules 2020, 25, 3900. - PMC - PubMed
    1. Soengas M. S., Lowe S. W., Oncogene 2003, 22, 3138. - PubMed

MeSH terms