. 2025 Mar 20;380(1922):20230276.
doi: 10.1098/rstb.2023.0276. Epub 2025 Mar 20.

Workload distribution in wild Damaraland mole-rat groups

Affiliations

Workload distribution in wild Damaraland mole-rat groups

Shay Rotics et al. Philos Trans R Soc Lond B Biol Sci. .

Abstract

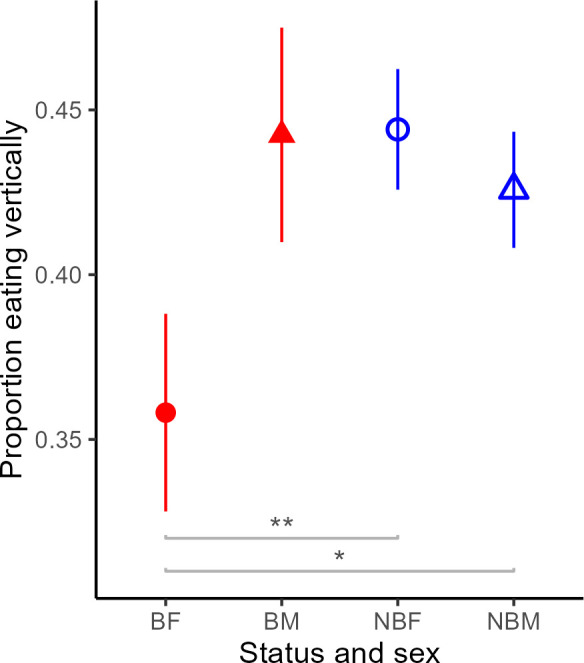
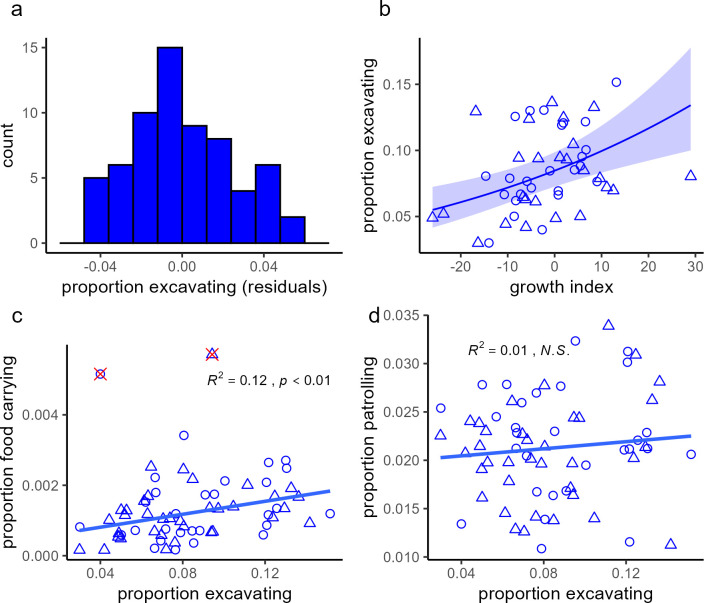
The social organization of Damaraland and naked mole-rats is often suggested to resemble the societies of eusocial insects more closely than that of any other vertebrate. Eusocial insects feature queens that hardly contribute to the workforce, and specialized worker castes. However, in Damaraland and naked mole-rats, which live in family groups with a single breeding pair and multiple non-breeding helpers, the work division is still unclear. Previous studies, largely confined to laboratory settings, could not quantify their primary cooperative behaviour, which is digging extensive foraging tunnels. Here, we studied the distribution of workload in 11 wild Damaraland mole-rat groups, using body acceleration loggers to evaluate behavioural time budgets of 86 individuals. We found behavioural differences between breeders and non-breeders that emerged with increases in group size, such that in large groups, breeders spent less time digging, more time resting, and were overall less active than non-breeders. We did not find any indication of a caste system among non-breeders, though the amount of time individuals spent digging varied with age and sex. Overall, the lower contribution by breeders to the group's workload is a pattern rarely observed in other cooperative vertebrates; nevertheless, the lack of evidence for castes suggests that eusociality may be limited to invertebrates.This article is part of the theme issue 'Division of labour as key driver of social evolution'.

Keywords: Mammals; body acceleration logging; caste system; cooperative breeding; eusociality; mole-rats; vertebrate societies; work division.


Conflict of interest statement

We declare we have no competing interests.

Figures

Diffrrences between breeders and non-breeders in: (a) proprtion time in digging and sweeping activities (excavating), (b) proprtion time resting, (c) overall dynamic body acceleration (ODBA).
Figure 1.
Differences between breeders and non-breeders in: (a) proportion of time in digging and sweeping activities (excavating), (b) proportion of time resting, (c) overall dynamic body acceleration (ODBA). Excavating and resting behaviours are predicted from body acceleration data using a machine learning model, whereas ODBA is a direct measure calculated from the acceleration data. Individual averages are displayed and dashed lines connect individuals of the same group (within which the comparison is most relevant). Lines and shaded areas mark the values ± CI95 as predicted by the models that are fully reported in table 1. After accounting for sex and the random factor group ID, breeding status effect and its interaction with group size are significant in all plots (GLMMs, p < 0.01, table 1). Colour corresponds to breeder status (blue = non-breeder, red = breeder); point shape corresponds to sex of the individual (circle = female, triangle = male).
Differences in proportion of eating vertically (from total eating) between: breeding females (bf); n = 11), breeding males (bm); n = 10), nonbreeding females (nbf); n = 29) and nonbreeding males (nbm); n = 36).
Figure 2.
Differences in the proportions eating vertically (from total eating) between: breeding females (BF; n = 11), breeding males (BM; n = 10), non-breeding females (NBF; n = 29) and nonbreeding males (NBM; n = 36). Means ± SE are displayed. Significant differences are marked with asterisks (* = 0.04, ** = 0.01), based on a Tukey’s post hoc analysis on a GLMM model that is reported in electronic supplementary material, table S3. Breeding females’ eating postures differ from non-breeders in a way that can imply that they eat less from vertical tubers in the ground and more from detached tuber pieces, possibly from the group’s food storage.
Examining castes-related predictions in non-breeders workload
Figure 3.
Examining castes-related predictions in non-breeders' workload. (a) Distribution of individual daily proportions of excavating activities (residuals after accounting for group ID), showing a unimodal shape (Hartigans' dip test for unimodality, D = 0.007, p = 0.99). (b) The effect of individual growth index, calculated as a residual from population body mass growth curve (higher values indicate faster growth; see §2), on proportion of excavating activities (dig and sweep); line and shaded area display the modelled effect ± CI95 (p < 0.001, see electronic supplementary material, table S5 for statistical details); circles and triangles mark data points of females and males, respectively. (c) Association between proportion of excavating activities and proportion of food carrying in non-breeders. R2 (marginal) and P value are provided (from examining the behaviours' relationship while accounting for group ID using a GLMM). Red × marks exclude outliers (verified with Grubbs’s test; association is marginally significant when outliers are retained; R2marginal = 0.06, p = 0.05). (d) No association between proportion of excavating activities and proportion patrolling, defined as locomotion unrelated to excavating activity (see §2), which may reflect patrolling behaviour.
Age related variation in non-breeders behaviour: (a) proportion time spent in excavating activities, (b) portion resting time, (c) overall activity (ODBA).
Figure 4.
Age related variation in non-breeders' behaviour: (a) proportion time spent in excavating activities, (b) portion resting time, (c) overall activity (ODBA). The age was estimated based on the animal weight at first capture (see electronic supplementary material for details). Individual averages are displayed with shapes marking the individual sex (circle = female, triangle = male). Lines and shaded areas mark the values ± CI95 as predicted by the models that are fully reported in electronic supplementary material, table S4. After accounting for sex, growth index and the random factor group ID, the age effects in all plots were significant (GLMMs, p ≤ 0.01, electronic supplementary material, table S4).

References

    1. Jarvis JUM. 1981. Eusociality in a mammal: cooperative breeding in naked mole-rat colonies. Science 212, 571–573. (10.1126/science.7209555) - DOI - PubMed
    1. Jarvis JUM, Bennett NC. 1993. Eusociality has evolved independently in two genera of bathyergid mole-rats — but occurs in no other subterranean mammal. Behav. Ecol. Sociobiol. 33, 253–260. (10.1007/bf02027122) - DOI
    1. Jarvis JUM, O’Riain MJ, Bennett NC, Sherman PW. 1994. Mammalian eusociality: a family affair. Trends Ecol. Evol. 9, 47–51. (10.1016/0169-5347(94)90267-4) - DOI - PubMed
    1. Scantlebury M, Speakman JR, Oosthuizen MK, Roper TJ, Bennett NC. 2006. Energetics reveals physiologically distinct castes in a eusocial mammal. Nature 440, 795–797. (10.1038/nature04578) - DOI - PubMed
    1. Buffenstein R, et al. . 2022. The naked truth: a comprehensive clarification and classification of current ‘myths’ in naked mole-rat biology. Biol. Rev 97, 115–140. (10.1111/brv.12791) - DOI - PMC - PubMed

LinkOut - more resources