. 2025 May;21(18):e2412611.
doi: 10.1002/smll.202412611. Epub 2025 Mar 20.

Nanoparticle-Driven Skeletal Muscle Repair and Regeneration Through Macrophage-Muscle Stem Cell Interaction

Affiliations

Nanoparticle-Driven Skeletal Muscle Repair and Regeneration Through Macrophage-Muscle Stem Cell Interaction

Lining Xu et al. Small. 2025 May.

Abstract

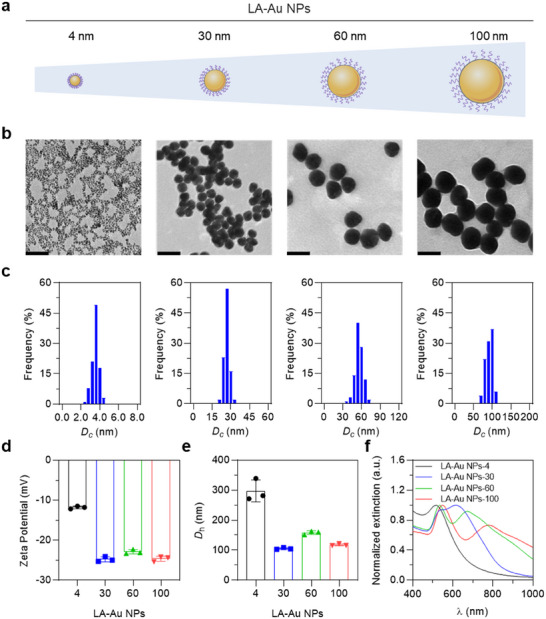
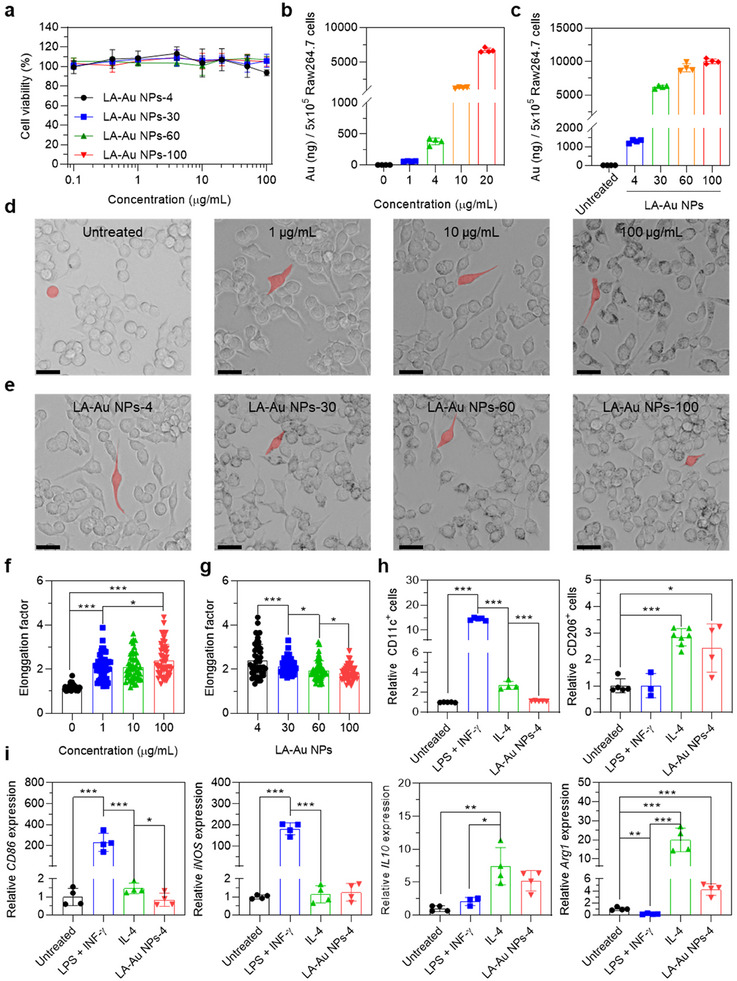
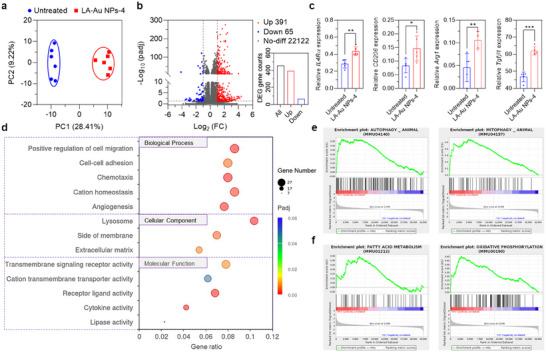
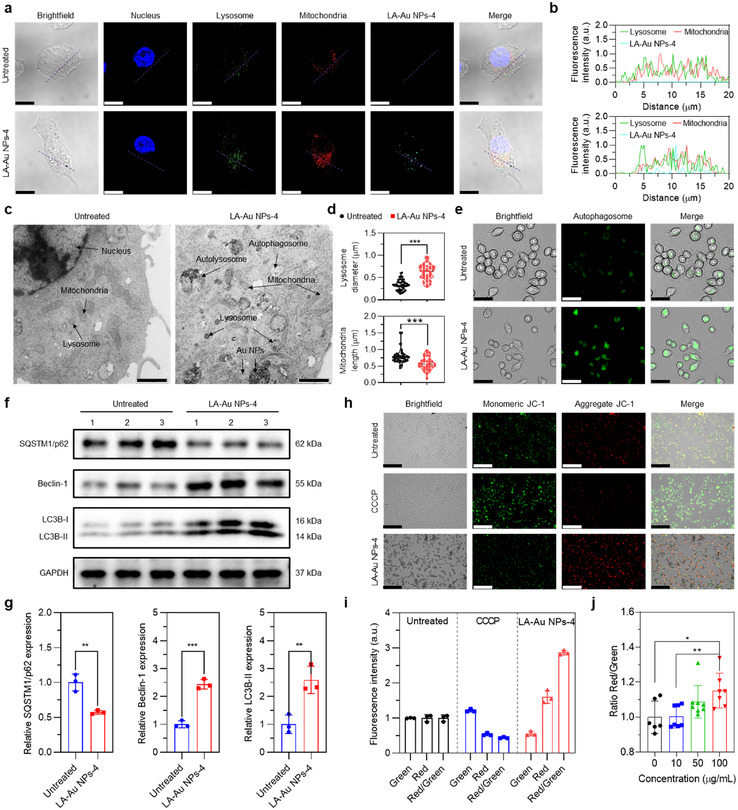
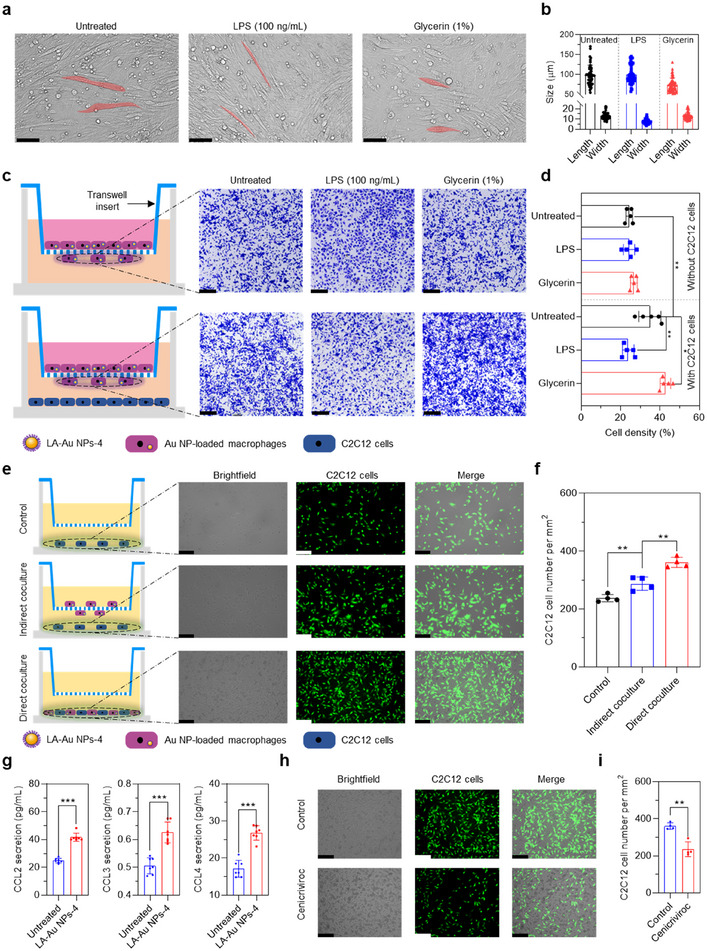
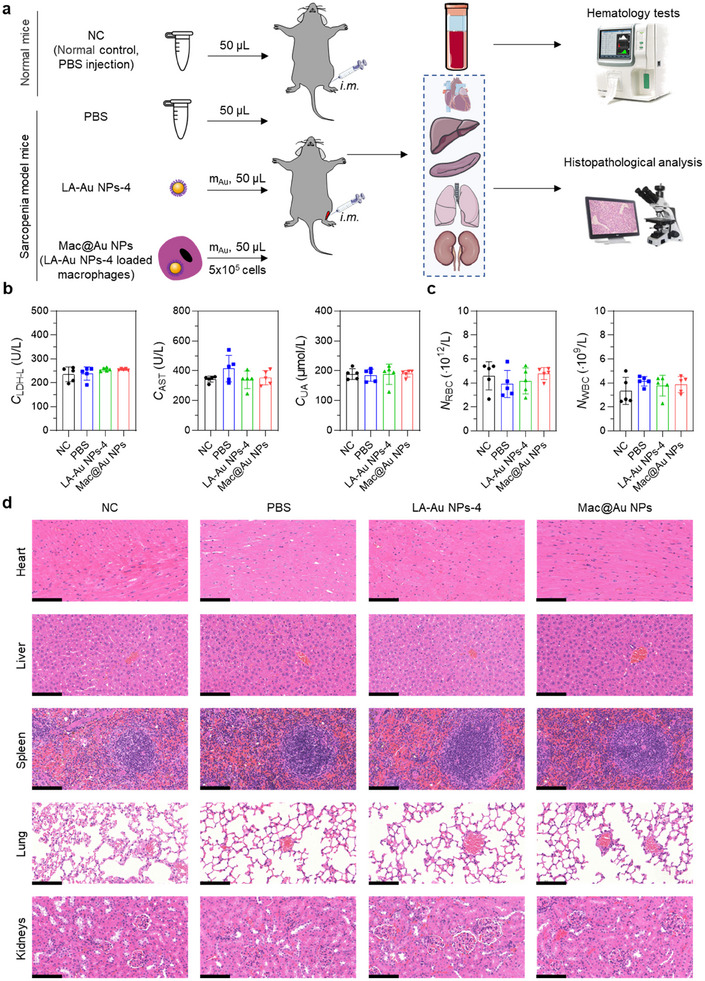
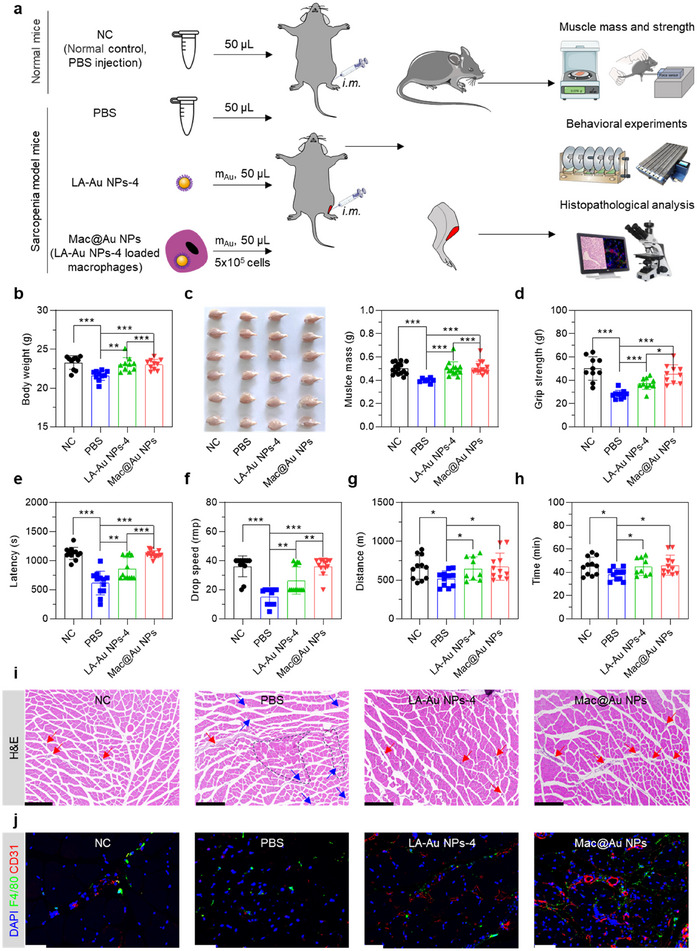
Macrophages are key innate immune cells in the muscle environment of sarcopenia patients, significantly influencing muscle stem cell (MuSC) proliferation and differentiation. However, prolonged activation of macrophages can hinder muscle recovery. In this study, it synthesizes lipoic acid-modified gold nanoparticles (LA-Au NPs) of varying sizes to evaluate their biocompatibility and immunomodulatory effects. The findings demonstrate that LA-Au NPs exhibit excellent biocompatibility with macrophages and promoted M2 polarization in a size-dependent manner. Mechanistically, LA-Au NPs facilitated metabolic reprogramming in macrophages by enhancing lysosomal autophagy and mitochondrial oxidative phosphorylation. Furthermore, macrophages are shown to chemotax toward MuSCs, regulating their proliferation via the chemokine system, inhibiting MuSC apoptosis, and enhancing differentiation under inflammatory conditions. In vivo studies have confirmed the safety and efficacy of LA-Au NPs in sarcopenia mice. To further enhance the effectiveness of LA-Au NPs, it investigates a delivery strategy that involves preconditioning macrophages with LA-Au NPs (Mac@Au NPs). Compared to the direct injection of LA-Au NPs, Mac@Au NPs demonstrate significantly greater benefits for muscle repair. This highlights the potential of macrophage therapy as a promising strategy for effective muscle regeneration and therapeutic intervention in sarcopenia.

Keywords: gold nanoparticles; immunometabolism; macrophages; muscle stem cells; skeletal muscle regeneration.


Conflict of interest statement

The authors declare no conflict of interest.

Figures

Figure 1
Figure 1
Characterization of LA‐Au NPs. a) Schematic diagram of LA‐Au NPs (LA‐Au NPs‐4, LA‐Au NPs‐30, LA‐Au NPs‐60, LA‐Au NPs‐100). b) Representative high‐resolution transmission electron microscope (HRTEM) images of LA‐Au NPs. Scale bar, 100 nm. c) Au core diameter (Dc ) distribution of LA‐Au NPs was measured by HRTEM. Over 100 particles were counted in each case. d) Zeta (ζ)‐potential of LA‐Au NPs dispersed in deionized water (DW). e) Hydraulic diameter (Dh ) distribution of LA‐Au NPs dispersed in DW. f) Extinction spectra of LA‐Au NPs in DW.
Figure 2
Figure 2
Effect of LA‐Au NPs on Macrophages. a) Cell viability of Au NP‐treated macrophages. Raw264.7 cells were treated with LA‐Au NPs‐4, LA‐Au NPs‐30, LA‐Au NPs‐60 or LA‐Au NPs‐100 at the concentrations of 0, 0.1, 0.4, 1, 4, 10, 20, 50 and 100 µg mL−1 for 24 h (n ≥ 5). b) Cellular uptake of LA‐Au NPs‐4 in macrophages. Raw264.7 cells were treated with LA‐Au NPs‐4 at 0, 1, 4, 10 and 20 µg mL−1 for 24 h. The Au mass in Au NP‐loaded macrophages was measured using ICP‐MS (n = 4). c) Cellular uptake of LA‐Au NPs in macrophages. Raw264.7 cells were treated with LA‐Au NPs‐4, LA‐Au NPs‐30, LA‐Au NPs‐60 or LA‐Au NPs‐100 at the concentrations of 10 µg mL−1 for 24 h. The Au mass in Au NP‐loaded macrophages was measured using ICP‐MS (n = 4). d) Morphology of macrophages regulated by LA‐Au NPs‐4. Raw264.7 cells were treated with LA‐Au NPs‐4 at 0, 1, 10 and 100 µg mL−1 for 12 h. The morphology of macrophages was observed by microscopy. Scale bar, 20 µm. e) Morphology of macrophages regulated by different diameters LA‐Au NPs. Raw264.7 cells were treated with LA‐Au NPs‐4, LA‐Au NPs‐30, LA‐Au NPs‐60 or LA‐Au NPs‐100 at 10 µg mL−1 for 12 h. Scale bar, 20 µm. f) Elongation factor of (d) macrophages regulated by LA‐Au NP‐4 (n ≥ 50 cells). g) Elongation factor of (e) macrophages regulated by different diameters LA‐Au NPs (n ≥ 50 cells). h) Flow cytometry analysis of surface marker expression in macrophages. M1 macrophages marker: CD11c, M2 macrophages marker: CD206. Raw264.7 cells were cultured using complete medium containing 2 ng mL−1 recombinant mouse IFN‐γ and 0.5 µg mL−1 LPS for 24 h to stimulate macrophages to the M1‐polarized phenotype, and Raw264.7 cells were cultured using complete medium containing 20 ng mL−1 IL‐4 for 24 h to induce macrophages to the M2‐polarized phenotype. In addition, Raw264.7 cells were treated with LA‐Au NPs‐4 at 10 µg mL−1 for 24 h (n ≥ 3). i) The mRNA expression levels of CD86, iNOS, IL10 and Arg1 in RAW 264.7 cells detected by RT‐PCR (n ≥ 3). *p < 0.05, **p < 0.005, ***p < 0.001.
Figure 3
Figure 3
Transcriptomic analysis of macrophage polarization induced by LA‐Au NPs‐4. a) PCA plot of gene expression data obtained via RNA‐seq data for six biological replicates corresponding to the samples from untreated Raw264.7 cells (blue dots) and LA‐Au NPs‐4 treated Raw264.7 cells (red dots). b) Volcano map of the distribution of DEGs from DESeq2. c) The relative expression of M2 macrophage marker IL4Rα, CD206, Arg1 and Tgfβ1. d) Dotplot enrichment map showing cellular pathways associated with up‐regulated DEGs. The color of the dot depends on the value of Padj, and its size is determined by the number of DEGs related to the respective pathway in the analyzed set of DEGs (map color keys along with dot size ones are shown on the right). e,f) GSEA showing four pathways enriched in the LA‐Au NPs‐4 treated group. GSEA enrichment results for autophagy, mitophagy, fatty acid metabolism and oxidative phosphorylation signaling pathway. *p < 0.05, **p < 0.005, ***p < 0.001.
Figure 4
Figure 4
LA‐Au NPs regulate mitochondrial metabolism through lysosome. a,b) Representative fluorescent images of the sub‐cellular localization of LA‐Au NPs‐4 in macrophages. Before microscopic imaging, Raw264.7 cells were treated with LA‐Au NPs‐4 at 20 µg mL−1 for 24 h. Nuclei, lysosome and mitochondrial were stained with Hoechst 33 342 (blue) and LysoTracker (green) and MitoTracker (red), respectively. LA‐Au NPs‐4 (cyan) were label‐free scattering light imaging. The purple dotted line denotes the location where the fluorescent or scattered light signal was collected for colocalization analysis as shown in (b). Scale bar, 5 µm. c) Representative TEM images of untreated and Au NP‐treated macrophages. Before TEM examination, macrophages had been treated with LA‐Au NPs‐4 at 20 µg mL−1 for 24 h. The arrows indicate representative subcellular structures or LA‐Au NPs‐4. Scale bar, 40 µm. d) Quantitative analysis of morphological changes of lysosome and mitochondria in macrophages. Macrophage intracellular lysosomal diameter and mitochondrial length are derived from TEM results in (d). Over 35 lysosomes or mitochondria were counted in each case. e) LA‐Au NPs induce autophagy in macrophages. Raw264.7 cells were treated with LA‐Au NPs‐4 at 20 µg mL−1 for 24 h, and then stained with MDC (monodansylcadaverine, green) for autophagy. Scale bar, 40 µm. f,g) Western blotting analysis of autophagy‐related proteins. h,i) The detection of mitochondrial potential and OXPHOS changes. Representative fluorescent images of JC‐1 in (h). Before JC‐1 staining and fluoroscopy, Raw264.7 cells were treated with LA‐Au NPs‐4 at 100 µg mL−1 for 24 h, or treated with CCCP (an OXPHOS uncoupler,10 µM) for 20 min. The red fluorescence indicates the JC‐1 aggregate, while the green fluorescence indicates the JC‐1 monomer. Scale bar, 100 µm. (i) represents the ratio of aggregated and monomeric JC‐1, indicating changes in mitochondrial membrane potential and OXPHOS (n = 3). j) Dose‐dependent of LA‐Au NPs‐4 regulation of OXPHOS levels. Raw264.7 cells were treated with LA‐Au NPs‐4 at 0, 10, 20, 50 and 100 µg mL−1 for 24 h, and then detection the ratio of aggregated and monomeric JC‐1 by microplate reader (n ≥ 6). *p < 0.05, **p < 0.005, ***p < 0.001.
Figure 5
Figure 5
Effect of Au NP‐loaded macrophages on myoblasts. a,b) Construction and evaluation of inflammation‐mediated skeletal muscle reduction in vitro model. Scale bar, 50 µm. c,d) Recruitment of macrophages by myoblasts and inflammation in vitro. Scale bar, 200 µm. e,f) Number of C2C12 cells in indirect and direct cocultures with Raw264.7 cells. C2C12 cells were pre‐labeled with Cell‐tracker (CMFDA, Green), and then co‐cultured with Raw264.7 cells for 12 h. Scale bar, 100 µm. g) Chemokines secretion of CCL2, CCL3 and CCL4. Raw264.7 cells were treated with LA‐Au NPs‐4 at the concentrations of 20 µg mL−1 for 24 h, and then the cell culture supernatant was collected for ELISA testing. h,i) CCR2/CCR5 dual inhibitor cenicriviroc abolishes the pro‐proliferative response of macrophages CCL2, CCL3 and CCL4. C2C12 cells were pre‐labeled with Cell‐tracker (CMFDA, Green), and then co‐cultured with Raw264.7 cells and with or without 200 nM cenicriviroc. Scale bar, 100 µm. **p < 0.005, ***p < 0.001.
Figure 6
Figure 6
Safety of delivering LA‐Au NPs for treatment of sarcopenia in vivo. a) Schematic illustrating the strategy to assess the safety of LA‐Au NPs and Au NP‐loaded macrophages in the sarcopenia model (5 mice per group). b) Level of serum lactate dehydrogenase (LDH‐L), aspartate aminotransferase (AST) and uric acid (UA). c) Level of red blood cell (RBC) and white blood cell (WBC). d) Pathological observation. Heart, liver, spleen, lung and kidney were examined by H&E staining to evaluate the pathological changes. Scale bar, 100 µm.
Figure 7
Figure 7
Efficacy of delivering LA‐Au NPs for treatment of sarcopenia in vivo. a) Schematic illustrating the strategy to assess the efficacy of LA‐Au NPs and Au NP‐loaded macrophages in the sarcopenia model (Over 10 mice per group). b) Bodyweight of mice. c) Representative images of mouse muscles and mouse muscle mass. d) Grip strength of mice. e,f) Time on the rod and the speed of the rod by rotarod tests. g,h) Distance and duration by treadmill tests. i) Histopathological examination of tibialis anterior (TA) muscle. Representative images of H&E of TA after the intramuscular injection (i.m.) of PBS, LA‐Au NPs‐4 and Mac@Au NPs (LA‐Au NPs‐4 loaded macrophages). The red arrow is the blood vessel, the blue arrow is the vacuolated structure of the muscle fiber. Scale bar, 300 µm. j) Immunofluorescence of TA muscle. Representative images of immunofluorescence of TA after the intramuscular injection of PBS, LA‐Au NPs‐4 and Mac@Au NPs. Scale bar, 50 µm.*p < 0.05, **p < 0.005, ***p < 0.001.

Similar articles

Cited by

References

    1. Sayer A. A., Cooper R., Arai H., Cawthon P. M., Essomba M.‐J. N., Fielding R. A., Grounds M. D., Witham M. D., Cruz‐Jentoft A. J., Nature reviews. Disease primers 2024, 10, 68. - PubMed
    1. Cruz‐Jentoft A. J., Sayer A. A., Lancet 2019, 393, 2636. - PubMed
    1. Tuttle C. S. L., Thang L. A. N., Maier A. B., Ageing Res. Rev. 2020, 64, 101185. - PubMed
    1. Livshits G., Kalinkovich A., Ageing Res. Rev. 2023, 86, 101852. - PubMed
    1. Li C. W., Yu K., Shyh‐Chang N., Li G. X., Jiang L. J., Yu S. L., Xu L. Y., Liu R. J., Guo Z. J., Xie H. Y., Li R. R., Ying J., Li K., Li D. J., J Cachexia Sarcopenia Muscle 2019, 10, 586. - PMC - PubMed

LinkOut - more resources