

Development and validation of a nomogram for predicting the incidence of infectious events in patients with idiopathic inflammatory myopathies
- PMID: 40109346
- PMCID: PMC11920973
- DOI: 10.3389/fimmu.2025.1471152
Development and validation of a nomogram for predicting the incidence of infectious events in patients with idiopathic inflammatory myopathies
Abstract
Background: Infection is a leading cause of mortality in idiopathic inflammatory myopathies (IIMs). This study aimed to develop a nomogram for predicting severe infection risk in IIM patients.
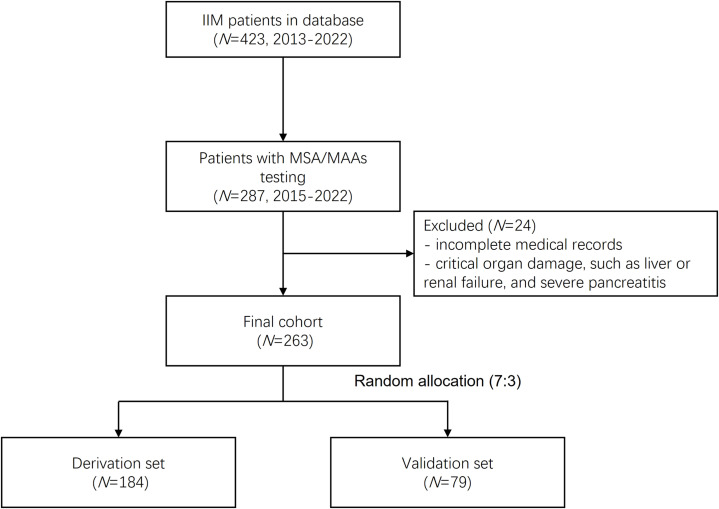
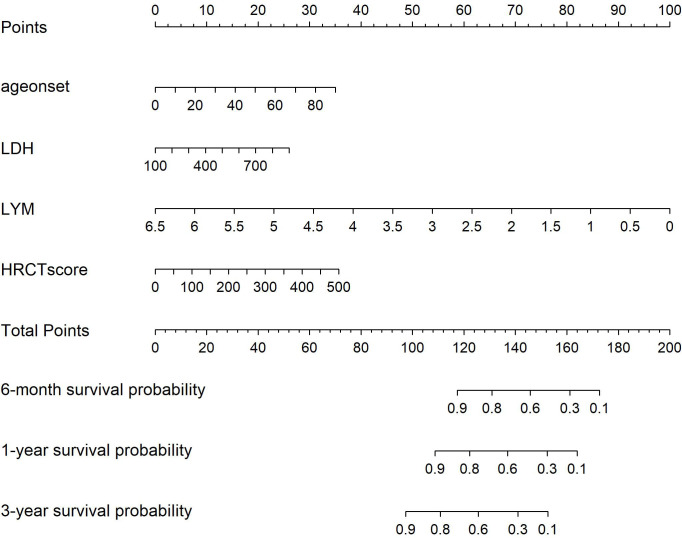
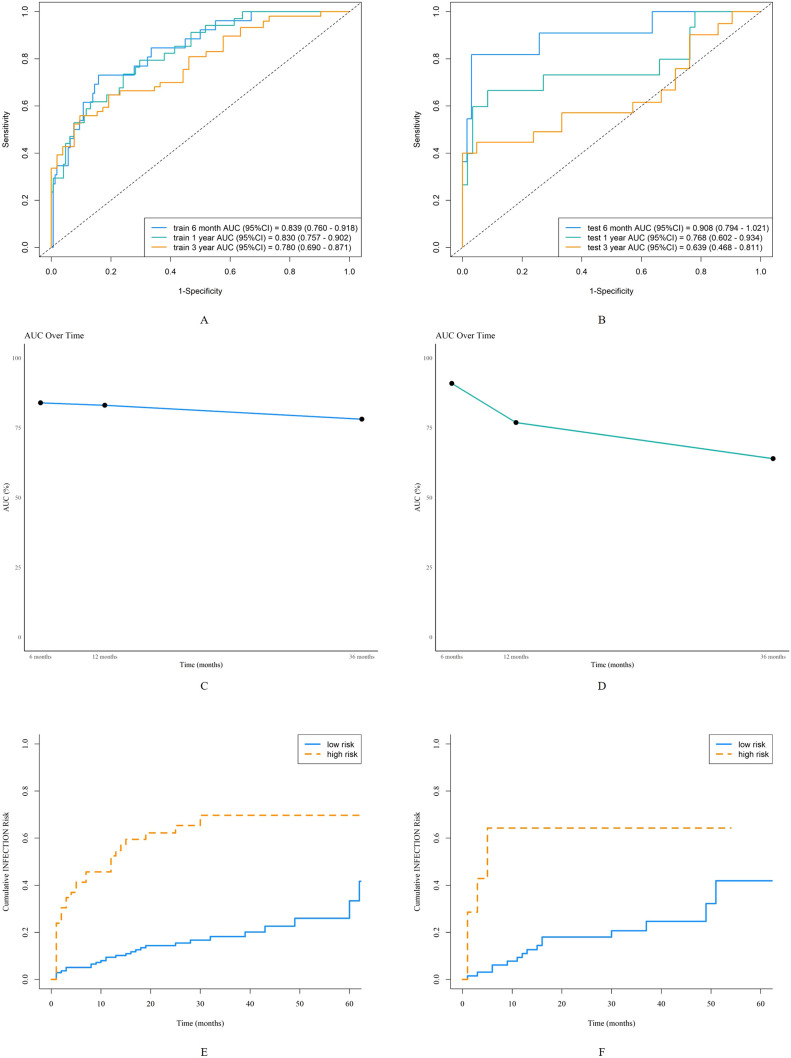
Methods: Patients with IIMs admitted to Zhongshan Hospital, Fudan University, from January 2015 to January 2022 were enrolled. They were randomly divided into derivation (70%) and validation (30%) sets. Univariate and multivariate Cox regression identified independent risk factors for severe infection, and the Akaike information criterion (AIC) was applied for model selection. A nomogram was constructed to predict severe infection risks at 6 months, 1 year, and 3 years. Predictive accuracy and discriminative ability were evaluated using the concordance index (C-index), calibration curves, and the area under the receiver operating characteristic curve (AUC). Decision curve analysis (DCA) assessed clinical utility. Kaplan-Meier (K-M) curves were used to analyze survival differences between high- and low-risk groups stratified by nomogram scores.
Results: Among 263 IIM patients, 81 experienced 106 severe infection events, with lower respiratory tract infections being the most common (47.2%). Independent risk factors included age at onset (HR 1.024, 95% CI 1.002-1.046, p=0.036), lactate dehydrogenase (HR 1.002, 95% CI 0.999-1.005, p=0.078), HRCT score (HR 1.004, 95% CI 1.001-1.006, p=0.002), and lymphocyte count (HR 0.48, 95% CI 0.23-0.99, p=0.048). The nomogram demonstrated strong predictive performance, with AUCs of 0.84, 0.83, and 0.78 for 6 months, 1 year, and 3 years in the derivation set, and 0.91, 0.77, and 0.64 in the validation set. Calibration curves showed good agreement between predicted and observed risks, while DCA demonstrated significant net benefit over individual predictors. Kaplan-Meier curves revealed significant differences in the cumulative risk of severe infection between high- and low-risk groups. Further validation in DM and ASS subgroups demonstrated that the nomogram effectively predicted severe infections, with AUCs of 0.86, 0.81, and 0.73 for DM and 0.86, 0.83, and 0.74 for ASS at 6 months, 1 year, and 3 years, respectively.
Conclusion: We have developed a new nomogram to predict severe infection risk in IIM patients at 6 months, 1 year, and 3 years. This model aids clinicians and patients in formulating treatment and follow-up strategies.
Keywords: Kaplan-Meier analysis; idiopathic inflammatory myopathies; nomogram; risk prediction; severe infection.
Copyright © 2025 Yang, Fan, Zhang, Zhou, Dai, Ji, Ma, Zhang, Chen, Yu, Ma, Jiang and Sun.
Conflict of interest statement
The authors declare that the research was conducted in the absence of any commercial or financial relationships that could be construed as a potential conflict of interest.
Figures


Similar articles
-
Predicting Overall Survival in Patients with Male Breast Cancer: Nomogram Development and External Validation Study.JMIR Cancer. 2025 Mar 4;11:e54625. doi: 10.2196/54625. JMIR Cancer. 2025. PMID: 40036657 Free PMC article.
-
Development and validation of prognostic nomograms for early-onset colon cancer in different tumor locations: a population-based study.BMC Gastroenterol. 2023 Oct 21;23(1):362. doi: 10.1186/s12876-023-02991-1. BMC Gastroenterol. 2023. PMID: 37865754 Free PMC article.
-
[Establishment and validation of a novel nomogram to predict overall survival after radical nephrectomy].Zhonghua Zhong Liu Za Zhi. 2023 Aug 23;45(8):681-689. doi: 10.3760/cma.j.cn112152-20221027-00722. Zhonghua Zhong Liu Za Zhi. 2023. PMID: 37580273 Chinese.
-
Prognostic factors of patients with human epidermal growth factor receptor 2-positive breast cancer following neoadjuvant therapy: Development and validation of a predictive nomogram.Pathol Res Pract. 2024 Sep;261:155504. doi: 10.1016/j.prp.2024.155504. Epub 2024 Jul 31. Pathol Res Pract. 2024. PMID: 39116570
-
Development of a novel dynamic nomogram for predicting overall survival in anaplastic thyroid cancer patients with distant metastasis: a population-based study based on the SEER database.Front Endocrinol (Lausanne). 2024 Jul 4;15:1375176. doi: 10.3389/fendo.2024.1375176. eCollection 2024. Front Endocrinol (Lausanne). 2024. PMID: 39027479 Free PMC article.
References
Publication types
MeSH terms
LinkOut - more resources
Full Text Sources
Medical
Miscellaneous