. 2025 Feb 20;16(3):1118-1142.
doi: 10.1364/BOE.545628. eCollection 2025 Mar 1.

Lightweight denoising speckle contrast image GAN for real-time denoising of laser speckle imaging of blood flow

Affiliations

Lightweight denoising speckle contrast image GAN for real-time denoising of laser speckle imaging of blood flow

Xu Sang et al. Biomed Opt Express. .

Abstract

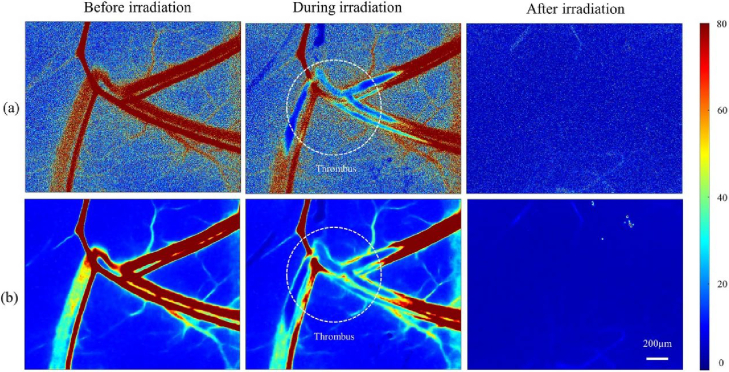
To tackle real-time denoising of noisy laser speckle blood flow images, a novel lightweight denoising speckle contrast image generative adversarial network (LDSCI-GAN) is proposed. In the framework, a lightweight denoiser removes noise from the original image, and a discriminator compares the denoised result with the reference one, enabling efficient learning and optimization of the denoising process. With a multi-scale loss function in the log-transformed domain, the training process significantly improves accuracy and denoising by using only five frames of raw speckle images while well-preserving the overall pixel distribution and vascular contours. Animal and phantom experimental results indicate that the LDSCI-GAN can eliminate vascular artifacts while retaining the accuracy of relative blood flow velocity. In terms of peak signal-to-noise ratio (PSNR), mean structural similarity index (MSSIM), and Pearson correlation coefficient (R), the LDSCI-GAN outperforms other deep-learning methods by 3.07 dB, 0.10 (p < 0.001), and 0.09 (p = 0.023), respectively. It has been successfully applied to the real-time monitoring of laser-induced thrombosis. Through conducting tests on the denoising performance of blood flow images of a moving subject, our proposed method achieved enhancements of 23.6% in PSNR, 30% in MSSIM, and 6.5% in the metric R, respectively, when compared to DRSNet. This means that the LDSCI-GAN also shows possible application in handheld devices, offering a potent tool for investigating blood flow and thrombosis dynamics more efficiently and conveniently.


Conflict of interest statement

The authors declare no competing financial interest.

Figures

Fig. 1.
Fig. 1.
Illustration of the proposed LDSCI-GAN. (a) Overview of the LDSCI-GAN. (b) The architecture of the lightweight denoiser. (c) Structures of the lightweight residual block, the vascular enhancer, and the transformer. (d) The architecture of the discriminator. (e) Structures of the residual block and mapper.
Fig. 2.
Fig. 2.
Schematic diagram of the self-build LSCI setup and experiments models. (a) The LSCI system and phantom. (b) the dorsal skinfold chamber model. (c) the mesenteric model.
Fig. 3.
Fig. 3.
Improved linear relationships between the original image and the reference image through log transformation. The speckle blood flow images are derived from Fig. 6(a). The relationship in K2. (b) The relationship in the log-transformed domain. (c) The bar graph of the linear correlation coefficients of (a) and (b).
Fig. 4.
Fig. 4.
The training total loss and the PSNR (dB) results for the validation of the proposed LDSCI-GAN. (a) Training total loss. (b) PSNR (dB) results for the validation.
Fig. 5.
Fig. 5.
Flow indexes relative to fluid velocities of the ROI. The red lines denote average flow indexes of the ROI. The blue vertical error bars represent the standard deviations of the flow indexes within the ROI.
Fig. 6.
Fig. 6.
Results from different denoising techniques applied to stLSCI (t = 5 frames). Specifically, P, M, and R represent PSNR, MSSIM, and R, respectively. Figure 6(a-c) show traditional denoising methods, while Fig. 6(d) and Fig. 6(e) display the comparison deep learning models DRSNet and the proposed LDSCI-GAN, respectively. Figure 6(f) shows the clean reference image. The two ROIs for comparison are marked with white dashed boxes in (f).
Fig. 7.
Fig. 7.
ROIs from results obtained with different denoising methods and the corresponding blood flow distribution along profiles. (a)-(f) and (g)-(l) show images within the two ROIs marked with white dashed boxes in Fig. 6(f), respectively. The blood flow distributions along profiles, denoted by white solid lines in (c) and (i), are plotted in (m) and (n).
Fig. 8.
Fig. 8.
The linear relationship between the reference and denoised images. (a)-(e) show the linear relationships between BFI of the reference and denoised images at the same pixel. (f) The bar graph of R-values corresponding to the BFI of the reference and denoised images.
Fig. 9.
Fig. 9.
The mean values of PSNR, MSSIM, and R, along with horizontal error bars for stLSCI using various temporal windows. The error bars represent the standard deviations for each temporal window size across different experiments. To enhance visualization, the error bars in (a), (b), and (c) are rescaled to 0.05, 1, and 3 times the original standard deviation values, respectively.
Fig. 10.
Fig. 10.
Mean PSNR, MSSIM, and R values, along with vertical error bars, are presented for the savg-tLSCI (t = 10-40 frames) in comparison to the LDSCI-GAN for the stLSCI (t = 5 frames). To enhance visual clarity, error bars in have been rescaled to 0.1 times their original standard deviation values, respectively.
Fig. 11.
Fig. 11.
Results from different denoising techniques for the stLSCI (t = 5 frames) on the rat mesentery model. Specifically, P, M, and R represent PSNR, MSSIM, and R, respectively. (a)-(c) show traditional denoising methods, while (d) and (e) display the comparison deep learning models DRSNet and the proposed LDSCI-GAN, respectively. (f) shows the clean reference image.
Fig. 12.
Fig. 12.
Results of the laser-induced thrombosis by the tLSCI (t = 3 frames) and denoised images by the LDSCI-GAN. (a) tLSCI (t = 3 frames). (b) Denoised by the LDSCI-GAN.
Fig. 13.
Fig. 13.
Results of the original, DRSNet denoised, LDSCI-GAN denoised and the reference BFI images of the rat femoral artery model. (a) tLSCI (t = 5). (b)-(e) denoised by DRSNet and LDSCI-GAN. (d) Reference (t = 50). (e) ROI 1 and ROI 2 indicated by rectangles in (a). (f)-(g) Distributions of the normalized BFI along profiles indicated as black line and yellow line in (e), respectively.
Fig. 14.
Fig. 14.
Comparison of denoising performance of the proposed LDSCI-GAN and DRSNet for blood flow images with greater motion. (a) Denoised by DRSNet (t = 5). (b) Denoised by LDSCI-GAN (t = 5).
Fig. 15.
Fig. 15.
The displacement of the feature point marked by the red triangle in the first frame.

Similar articles

References

    1. Goodman J. W., Speckle Phenomena in Optics: Theory and Applications (Roberts and Company Publishers, 2007).
    1. Dainty J. C., Laser Speckle and Related Phenomena, vol. 9 (Springer Science & Business Media, 2013).
    1. Goldberg J., Miller D. R., Dimanche A., et al. , “Intraoperative laser speckle contrast imaging to assess vessel flow in neurosurgery: A pilot study,” Neurosurgery 94(5), 983–992 (2023).10.1227/neu.0000000000002776 - DOI - PubMed
    1. Dong W., Li Y., Zhu X., et al. , “Selective photoactivation of neural activity combined with laser speckle imaging of cerebral blood flow,” Opt. Lett. 43(15), 3798–3801 (2018).10.1364/OL.43.003798 - DOI - PubMed
    1. Qiu C., Situ J., Wang S. Y., et al. , “Inter-day repeatability assessment of human retinal blood flow using clinical laser speckle contrast imaging,” Biomed. Opt. Express 13(11), 6136–6152 (2022).10.1364/BOE.468871 - DOI - PMC - PubMed

LinkOut - more resources