. 2025 Mar 5:16:1528997.
doi: 10.3389/fmicb.2025.1528997. eCollection 2025.

Prediction of aflatoxin contamination outbreaks in Texas corn using mechanistic and machine learning models

Affiliations

Prediction of aflatoxin contamination outbreaks in Texas corn using mechanistic and machine learning models

Lina Castano-Duque et al. Front Microbiol. .

Abstract

Aflatoxins are carcinogenic and mutagenic mycotoxins that contaminate food and feed. The objective of our research is to predict aflatoxin outbreaks in Texas-grown maize using dynamic geospatial data from remote sensing satellites, soil properties data, and meteorological data by an ensemble of models. We developed three model pipelines: two included mechanistic models that use weekly aflatoxin risk indexes (ARIs) as inputs, and one included a weather-centric model; all three models incorporated soil properties as inputs. For the mechanistic-dependent models, ARIs were weighted based on a maize phenological model that used satellite-acquired normalized difference vegetation index (NDVI) data to predict maize planting dates for each growing season on a county basis. For aflatoxin outbreak predictions, we trained, tested and validated gradient boosting and neural network models using inputs of ARIs or weather, soil properties, and county geodynamic latitude and longitude references. Our findings indicated that between the two ARI-mechanistic models evaluated (AFLA-MAIZE or Ratkowsky), the best performing was the Ratkowsky-ARI neural network (nnet) model, with an accuracy of 73%, sensitivity of 71% and specificity of 74%. Texas has significant geographical variability in ARI and ARI-hotspot responses due to the diversity of agroecological zones (hot-dry, hot-humid, mixed-dry and mixed-humid) that result in a wide variation of maize growth and development. Our Ratkowsky-ARI nnet model identified a positive correlation between aflatoxin outbreaks and prevalence of ARI hot-spots in the hot-humid areas of Texas. In these areas, temperature, precipitation and relative humidity in March and October were positively correlated with high aflatoxin contamination events. We found a positive correlation between aflatoxin outbreaks and soil pH in hot-dry and hot-humid regions and minimum saturated hydraulic conductivity in mixed-dry regions. Conversely, there was a negative relationship between aflatoxin outbreaks and maximum soil organic matter (hot-dry region), and calcium carbonate (hot-dry, and mixed-dry). It is likely soil fungal communities are more diverse, and plants are healthier in soils with high organic matter content, thereby reducing the risk of aflatoxin outbreaks. Our results demonstrate that intricate relationships between soil hydrological parameters, fungal communities and plant health should be carefully considered by Texas corn growers for aflatoxin mitigation strategies.

Keywords: Aspergillus; aflatoxin; corn; gradient boosting; machine learning; neural network; soil.


Conflict of interest statement

The authors declare that the research was conducted in the absence of any commercial or financial relationships that could be construed as a potential conflict of interest.

Figures

Figure 1
Figure 1
Texas climate zones and phenology model. (A) BA climate zone geospatial distribution in TX counties. The Y-axis represents latitude, X-axis longitude. Brown: Hot-Dry, yellow: Hot-Humid, olive: Mixed-Dry, light-green: Mixed-Humid. (B) Third degree polynomial fit of NDVI data. The blue points represent the daily average NDVI for cultivated land in Sunray, Texas, in 2019. The red line is a third degree polynomial fit to these points. (C) Planting dates from phenology model. Each Texas county is color-coded based on the average planting date for cultivated land from 2008 to 2022. White counties indicate insufficient data for an estimate. Yellow counties represent early planting dates, while red counties correspond to later planting dates, up to Julian day 160. (D) Performance of phenology model on testing data. The blue points represent the predicted planting dates versus the actual planting dates for 29 testing data points used to validate the planting date prediction model. The red line represents the y = x line, where alignment of points would indicate a perfect model. The R2 value of the model is 0.85.
Figure 2
Figure 2
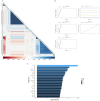
Texas AFL nnet model using weather-only input features. (A) Pair-wise correlation analysis of input variables used in the nnet model; (B) Results of fine tuning parameters (size and decay) of the nnet model by using cross-validation; (C) Top 20 influential input features and overall influence over the nnet model in the prediction of AFL. The correlation is depicted from positive (blue) to negative (red), with blank squares representing non-significant p-values of correlation between variables. For the correlation analysis, the p-value cut-off was 0.05, and the confidence level was 0.95. The blue hue in bar-plots represents relative influence of the input variables, with light blue high and dark blue low influence levels.
Figure 3
Figure 3
Texas AFL nnet model using AFLA-MAIZE ARI engineer input features. (A) Pair-wise correlation analysis of input variables used in the nnet model; (B) Results of fine tuning parameters (size and decay) of the nnet model by using cross-validation; (C) Top 20 influential input features and overall influence over the nnet model in the prediction of AFL. The correlation is depicted from positive (blue) to negative (red), with blank squares representing non-significant p-values of correlation between variables. For the correlation analysis, the p-value cut-off was 0.05, and the confidence level was 0.95. The blue hue in bar-plots represents relative influence of the input variables, with light blue high and dark blue low influence levels.
Figure 4
Figure 4
Texas AFL nnet model using Ratkowsky ARI engineer input features. (A) Pair-wise correlation analysis of input variables used in the nnet model; (B) Results of fine tuning parameters (size and decay) of the nnet model by using cross-validation; (C) Top 20 influential input features and overall influence over the nnet model in the prediction of AFL. The correlation is depicted from positive (blue) to negative (red), with blank squares representing non-significant p-values of correlation between variables. For the correlation analysis, the p-value cut-off was 0.05, and the confidence level was 0.95. The blue hue in bar-plots represents relative influence of the input variables, with light blue high and dark blue low influence levels.
Figure 5
Figure 5
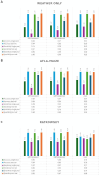
Summary of accuracy, sensitivity and specificity of the models (GBM-standard, GBM-adaboost, and nnet) used to predict AFL outbreaks in Texas. (A) Weather only input features, (B) AFLA-MAIZE ARI input, and (C) Ratkowsky ARI input.
Figure 6
Figure 6
Geospatial distribution of top influential ARI from Ratkowsky-ARI nnet model and their relationship with AFL contamination levels in TX. (A) Week 11 (March); (B) week 19 (May); (C) week 30 (July); (D) week 32 (August); (E) week 44 (October); (F) week 48 (November). In each panel left – geospatial distribution of weekly average precipitation; middle – hotspot geospatial distribution of soil property; right – Soil property in relation with AFL levels by BA-climate zone. Maps of geospatial distribution of the weekly ARI are shaded in red from 2003 to 2023 or 2024 for each specific week, the y-axis is latitude, and the x-axis is longitude. Red and blue color palette of geospatial hot-spot analysis used the historic mean of gi-value for weekly ARI as the middle point scale, red hues are gi-values above the historic mean, and blue hues are below the historic mean. Hot-spot specific red/blue hues are classified by the level of significance of the p-folded value: “very hot/cold” < =0.01, “hot”/“cold” < = 0.05, “somewhat hot/cold” < = 0.1. Box–Whisker plot depicts the maximum (25th – 1.5 * interquartile range “IQR”) and minimum [75th percentile +1.5 *interquartile range (IQR)], and the Box–Whisker plot depicts median, first (25th percentile) and third (75th percentile) quantiles distribution, each panel represents an ecoregion of Texas (Hot-dry, hot-humid, mixed-dry, mixed-humid); For AFL classification, high is >20 ppb, and low ≤20 ppb. The violin plot is shaded in red and depicts the density distribution of the weekly average ARI and levels of mycotoxin contamination; and the gray dots depict each data point.
Figure 7
Figure 7
Distribution of weekly weather factors in TX from 2003 to 2024 (A) average precipitation (cm), (B) average relative humidity, and (C) average temperature. Red line indicates the historic average for each specific weather factor.
Figure 8
Figure 8
Geospatial distribution of top influential soil properties from Ratkowsky-ARI nnet model and their relationship with AFL contamination levels in TX. Rock fragments from 0 to 25 cm depth (A) distribution in TX, (B) hot-spots, (C) box-plots distribution by climate zone; pH from 0 to 50 cm depth (percentage by weight) (D) distribution in TX, (E) hot-spots, (F) box-plots distribution by climate zone; maximum organic matter (weight fraction) (G) distribution in TX, (H) hot-spots, (I) box-plots distribution by climate zone; calcium carbonate – CaCo3 (J) distribution in TX, (K) hot-spots, (L) box-plots distribution by climate zone; minimum hydrology conductance (μm/s), (M) distribution in TX, (N) hot-spots, (O) box-plots distribution by climate zone; soil depth (cm) (P) distribution in TX, (Q) hot-spots, (R) box-plots distribution by climate zone. Maps of geospatial distribution of each soil property are shaded in red, and the y-axis is latitude, and the x-axis is longitude. Red and blue color palette of geospatial hot-spot analysis used the mean of gi-value for each soil property as the middle point scale, red hues are gi-values above the mean, and blue hues are below the mean. Hot-spot specific red/blue hues are classified by the level of significance of the p-folded value: “very hot/cold” < =0.01, “hot”/“cold” < = 0.05, “somewhat hot/cold” < = 0.1. Box–Whisker plot depicts the maximum (25th – 1.5 * interquartile range “IQR”) and minimum [75th percentile +1.5 *interquartile range (IQR)], and the Box–Whisker plot depicts median, first (25th percentile) and third (75th percentile) quantiles distribution, each panel represents an ecoregion of Texas (hot-dry, hot-humid, mixed-dry, mixed-humid); For AFL classification, high is >20 ppb, and low ≤20 ppb. The violin plot is shaded in red and depicts the density distribution of the soil property and levels of mycotoxin contamination; and the gray dots depict each data point.

Similar articles

Cited by

References

    1. Abdelfatah K., Senn J., Glaeser N., Terejanu G. (2019). Prediction and measurement update of fungal toxin geospatial uncertainty using a stacked Gaussian process. Agric. Syst. 176:102662. doi: 10.1016/j.agsy.2019.102662 - DOI
    1. Abdel-Hadi A., Schmidt-Heydt M., Parra R., Geisen R., Magan N. (2012). A systems approach to model the relationship between aflatoxin gene cluster expression, environmental factors, growth and toxin production by aspergillus flavus. J. R. Soc. Interface 9, 757–767. doi: 10.1098/rsif.2011.0482 - DOI - PMC - PubMed
    1. Banerjee P., Dehnbostel F. O., Preissner R. (2018). Prediction is a balancing act: importance of sampling methods to balance sensitivity and specificity of predictive models based on imbalanced chemical data sets. Frontiers. Chemistry 6:6. doi: 10.3389/fchem.2018.00362 - DOI - PMC - PubMed
    1. Baranyi J., Roberts T. A. (1995). Mathematics of predictive food microbiology. Int. J. Food Microbiol. 26, 199–218. doi: 10.1016/0168-1605(94)00121-L - DOI - PubMed
    1. Battilani P., Camardo Leggieri M., Rossi V., Giorni P. (2013). AFLA-maize, a mechanistic model for aspergillus flavus infection and aflatoxin B1 contamination in maize. Comput. Electron. Agric. 94, 38–46. doi: 10.1016/j.compag.2013.03.005 - DOI

LinkOut - more resources