The Extracellular Matrix Promotes Diabetic Oral Wound Healing by Modulating the Microenvironment
- PMID: 40110050
- PMCID: PMC11922533
- DOI: 10.34133/bmr.0169
The Extracellular Matrix Promotes Diabetic Oral Wound Healing by Modulating the Microenvironment
Abstract
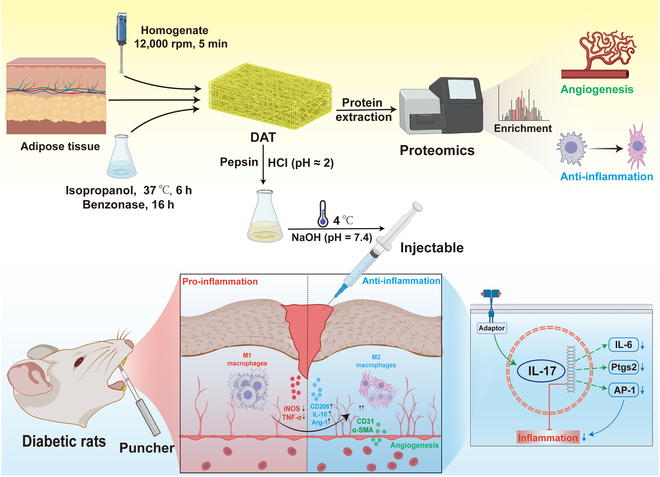
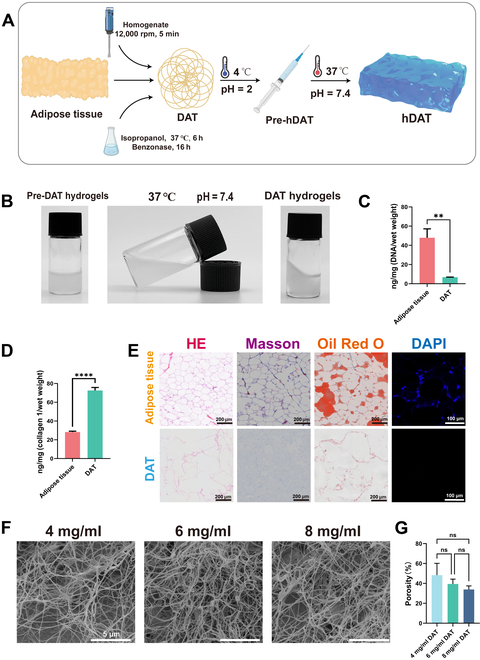
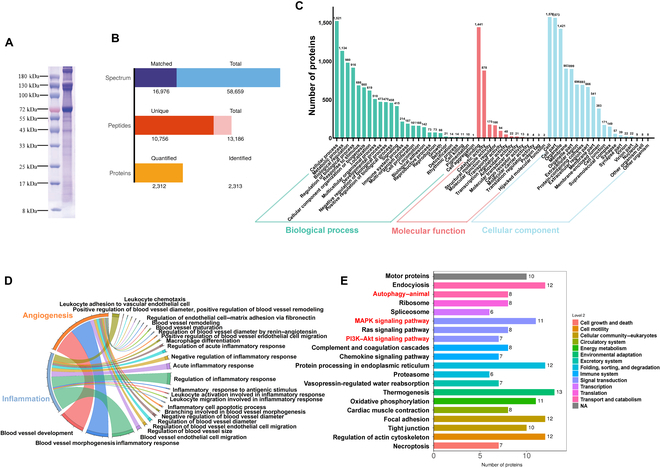
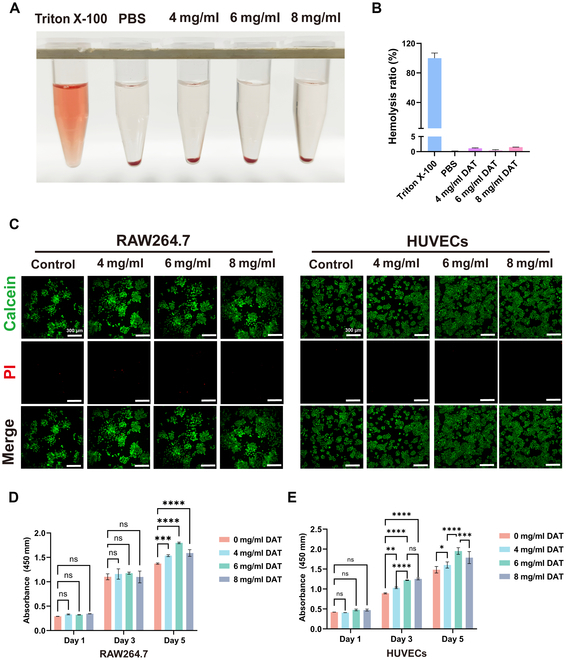
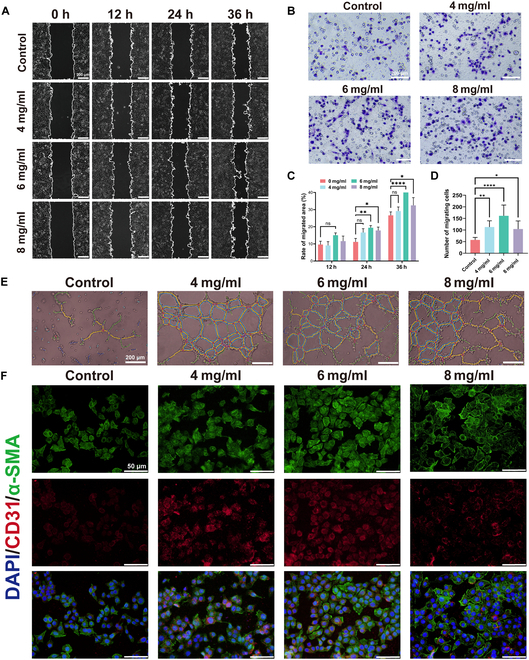
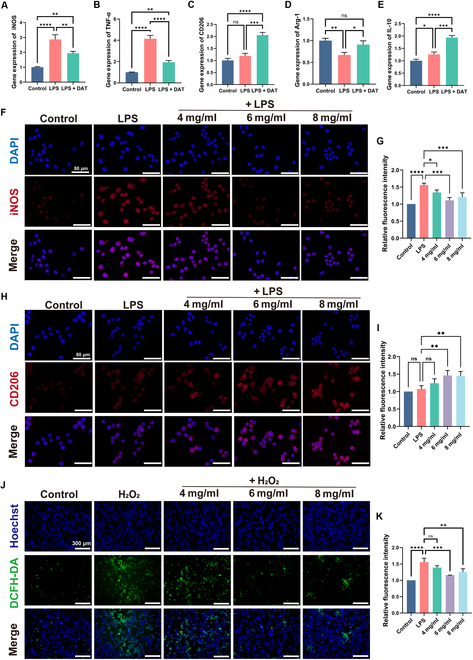
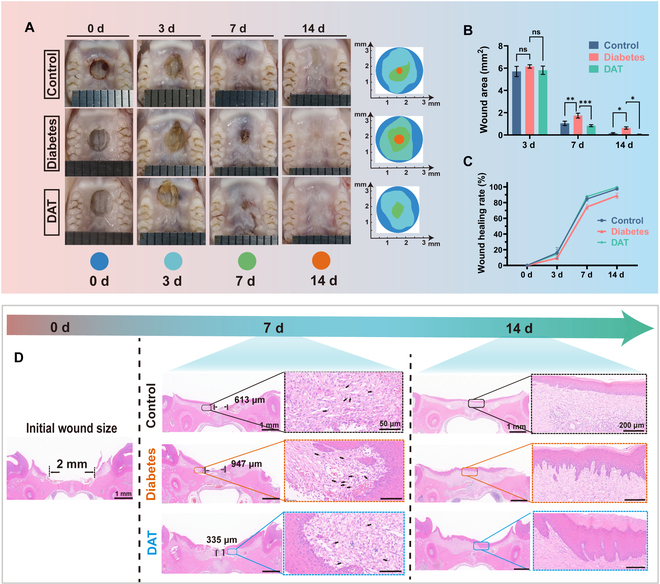
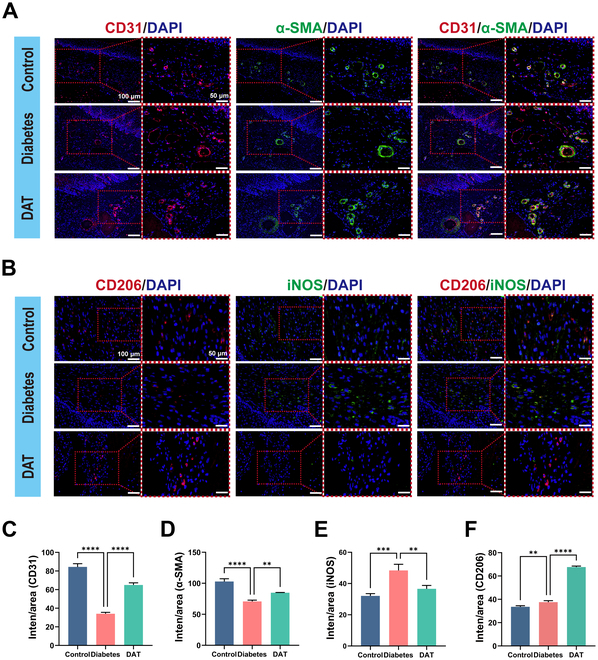
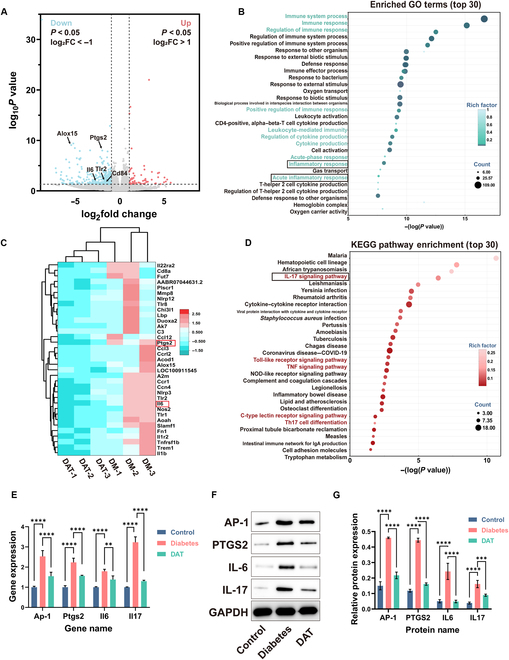
Oral wounds in diabetes mellitus (DM) often delay healing due to reduced angiogenesis and increased inflammatory response in the local microenvironment, even leading to graft necrosis and implant failure. Therefore, developing an effective program to promote healing is of great clinical value. Much of the current research is focused on promoting wound healing through surface adhesive materials that exert a pro-angiogenic, anti-inflammatory effect. However, the application of surface bonding materials in the oral cavity is very limited due to the humid and friction-prone environment. Decellularized extracellular adipose tissue (DAT) is an easily accessible and biocompatible material derived from adipose tissue. To further explore the potential of DAT, we used multi-omics to analyze its composition and possible mechanisms. Proteomic studies revealed that DAT contains anti-inflammatory, pro-angiogenic proteins that promote DM tissue regeneration. To adapt to the moist and chewing friction environment of the mouth, we modified DAT into a temperature-sensitive hydrogel material that can be injected intramucosally. DAT hydrogel has been verified to promote angiogenesis and exert anti-inflammatory effects through macrophage phenotypic transformation. Meanwhile, transcriptome analysis suggested that the inhibitory effect of DAT on the interleukin 17 signaling pathway might be a key factor in promoting DM oral wound healing. In conclusion, after multi-omic analysis, DAT hydrogel can exert good pro-angiogenic and anti-inflammatory effects through the interleukin 17 signaling pathway and can be adapted to the specific environment of the oral cavity. This provides a potential way to promote DM oral wound healing in a clinical setting.
Copyright © 2025 Zhongke Wang et al.
Conflict of interest statement
Competing interests: The authors declare that they have no competing interests.
Figures
Similar articles
-
Combining decellularized adipose tissue with decellularized adventitia extravascular matrix or small intestinal submucosa matrix for the construction of vascularized tissue-engineered adipose.Acta Biomater. 2023 Oct 15;170:567-579. doi: 10.1016/j.actbio.2023.08.060. Epub 2023 Sep 7. Acta Biomater. 2023. PMID: 37683968
-
Matrix composition in 3-D collagenous bioscaffolds modulates the survival and angiogenic phenotype of human chronic wound dermal fibroblasts.Acta Biomater. 2019 Jan 1;83:199-210. doi: 10.1016/j.actbio.2018.10.042. Epub 2018 Oct 29. Acta Biomater. 2019. PMID: 30385224
-
Injectable Nanocomposite Hydrogel for Accelerating Diabetic Wound Healing Through Inflammatory Microenvironment Regulation.Int J Nanomedicine. 2025 Feb 6;20:1679-1696. doi: 10.2147/IJN.S505918. eCollection 2025. Int J Nanomedicine. 2025. PMID: 39931526 Free PMC article.
-
Insulin modified Decellularized Adipose Tissue/Tremella Polysaccharide hydrogel loaded with ADSCs for skin wound healing.Biochem Biophys Res Commun. 2023 May 14;656:46-52. doi: 10.1016/j.bbrc.2023.03.027. Epub 2023 Mar 11. Biochem Biophys Res Commun. 2023. PMID: 36947966
-
Immunomodulation in diabetic wounds healing: The intersection of macrophage reprogramming and immunotherapeutic hydrogels.J Tissue Eng. 2024 Jul 27;15:20417314241265202. doi: 10.1177/20417314241265202. eCollection 2024 Jan-Dec. J Tissue Eng. 2024. PMID: 39071896 Free PMC article. Review.
References
-
- Wagenknecht LE, Lawrence JM, Isom S, Jensen ET, Dabelea D, Liese AD, Dolan LM, Shah AS, Bellatorre A, Sauder K, et al. . Trends in incidence of youth-onset type 1 and type 2 diabetes in the USA, 2002–18: Results from the population-based SEARCH for Diabetes in Youth study. Lancet Diabetes Endocrinol. 2023;11(4):242–250. - PMC - PubMed
-
- Saeedi P, Petersohn I, Salpea P, Malanda B, Karuranga S, Unwin N, Colagiuri S, Guariguata L, Motala AA, Ogurtsova K, et al. . Global and regional diabetes prevalence estimates for 2019 and projections for 2030 and 2045: Results from the International Diabetes Federation Diabetes Atlas, 9th edition. Diabetes Res Clin Pract. 2019;157: Article 107843. - PubMed
-
- Crawford AL, Laiteerapong N. Type 2 diabetes. Ann Intern Med. 2024;177(6):ITC81–ITC96. - PubMed
-
- Louiselle AE, Niemiec SM, Zgheib C, Liechty KW. Macrophage polarization and diabetic wound healing. Transl Res. 2021;236:109–116. - PubMed
LinkOut - more resources
Full Text Sources