. 2025 Mar 5:15:1527036.
doi: 10.3389/fonc.2025.1527036. eCollection 2025.

Integrated single-cell analysis reveals the regulatory network of disulfidptosis-related lncRNAs in bladder cancer: constructing a prognostic model and predicting treatment response

Affiliations

Integrated single-cell analysis reveals the regulatory network of disulfidptosis-related lncRNAs in bladder cancer: constructing a prognostic model and predicting treatment response

Jiafu Xiao et al. Front Oncol. .

Abstract

Background: Disulfidptosis is a newly discovered form of cell death, and long non-coding RNAs (lncRNAs) play a crucial role in tumor cell growth, migration, recurrence, and drug resistance, particularly in bladder cancer (BLCA). This study aims to investigate disulfidptosis-related lncRNAs (DRLs) as potential prognostic markers for BLCA patients.

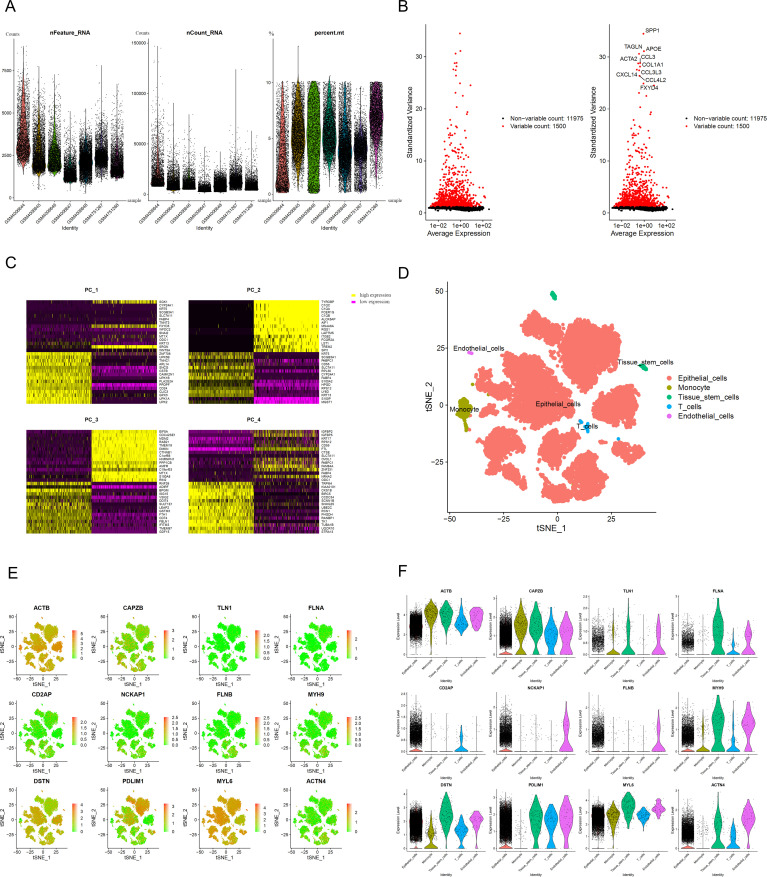
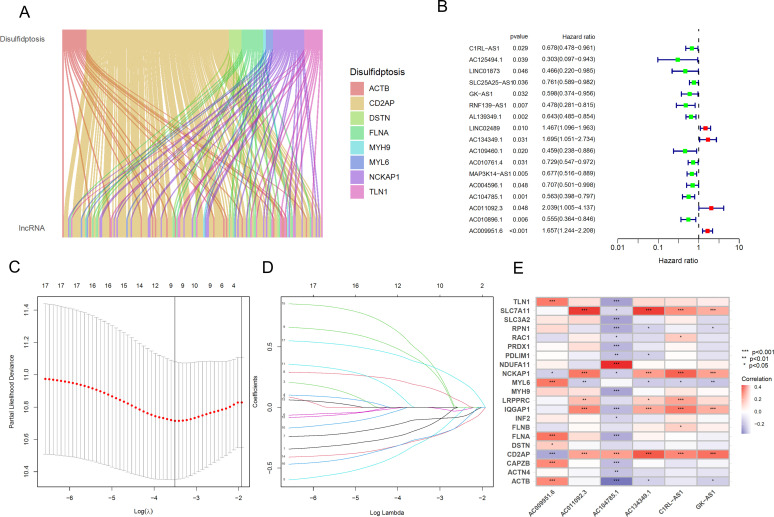
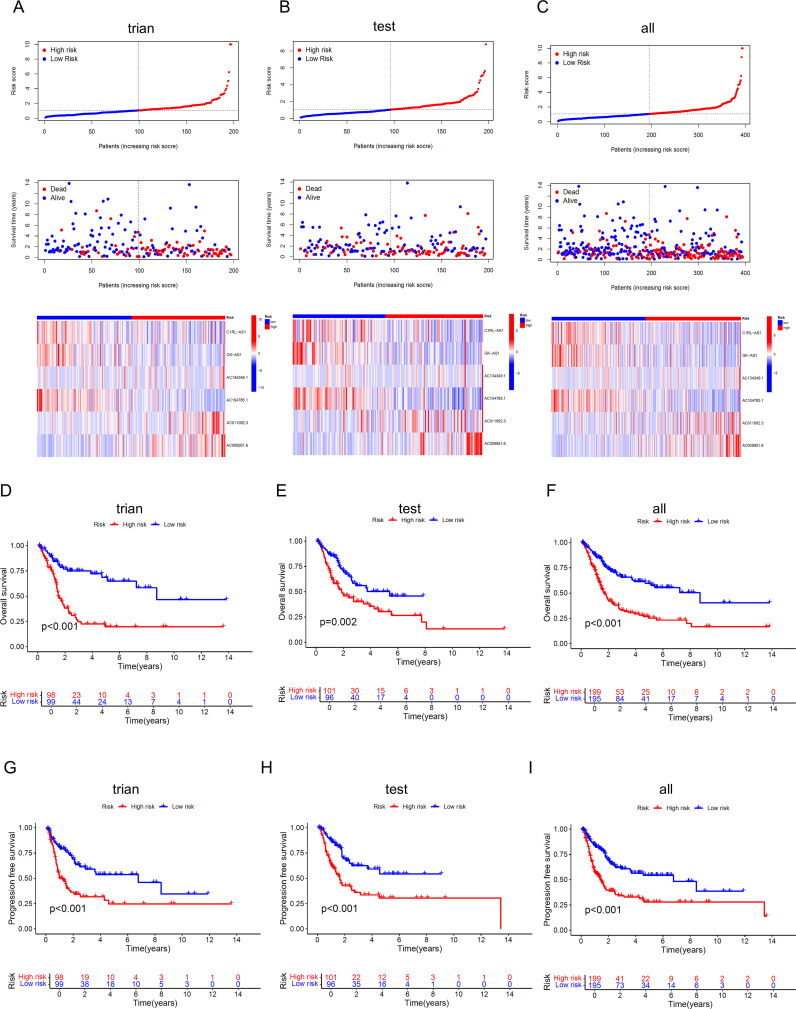
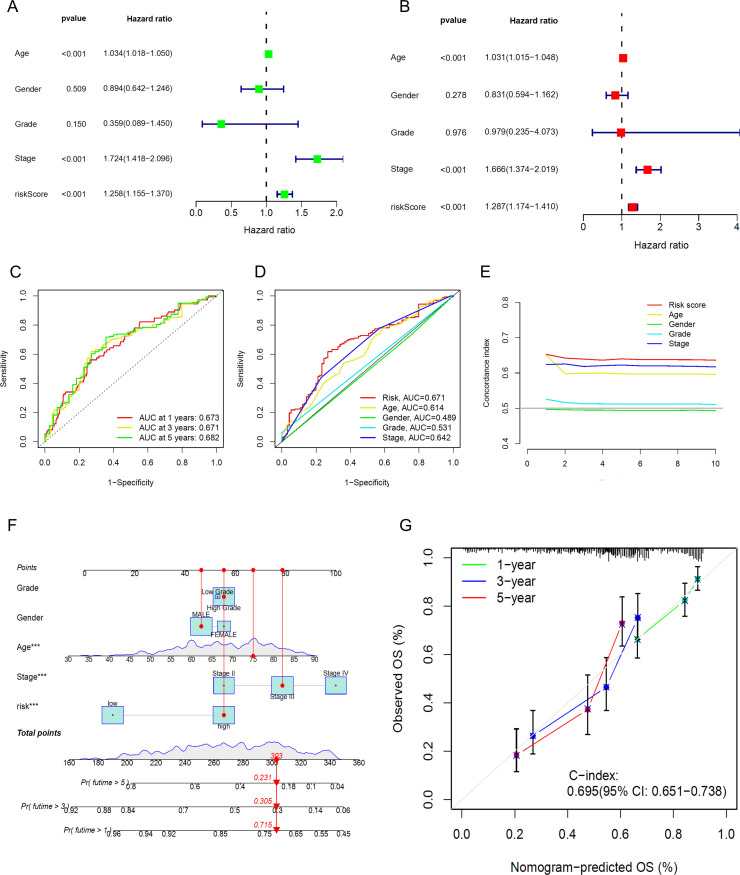
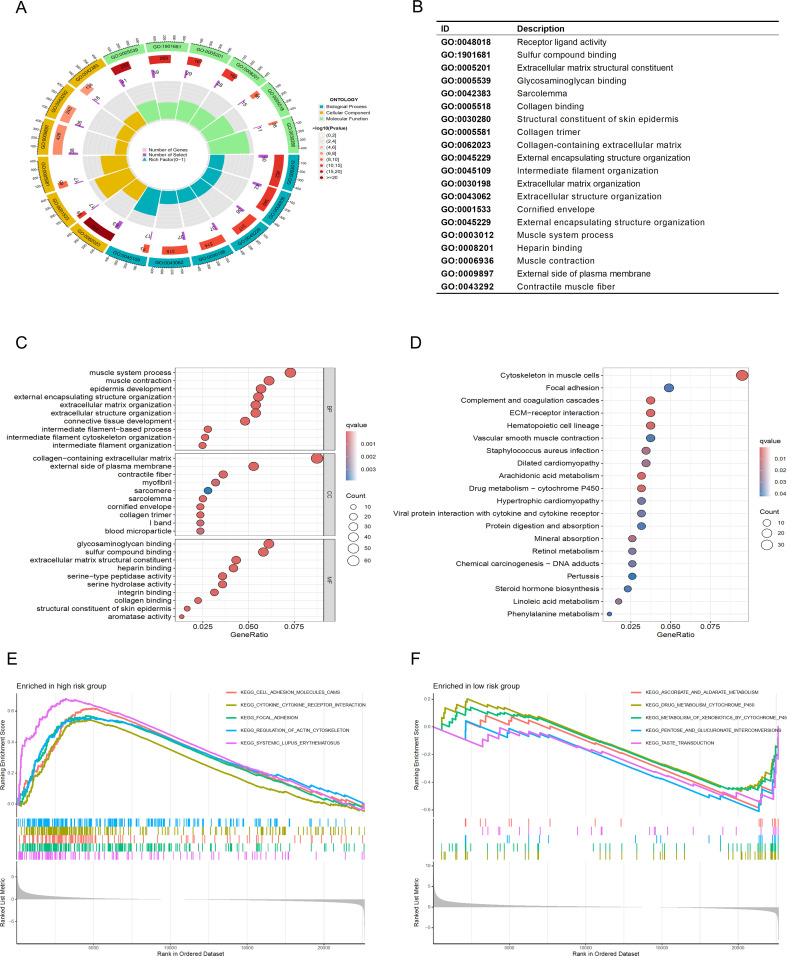
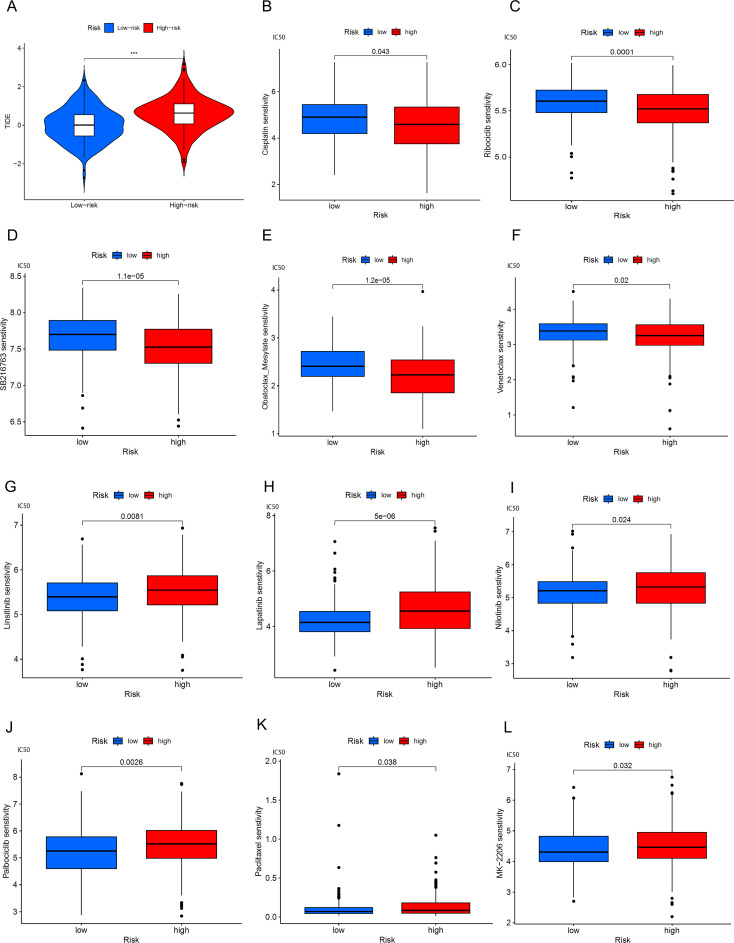
Methods: Utilizing single-cell sequencing data, RNA sequencing data, and corresponding clinical information sourced from the GEO and TCGA databases, this study conducted cell annotation and intercellular communication analyses to identify differentially expressed disulfide death-related genes (DRGs). Subsequently, Pearson correlation and Cox regression analyses were employed to discern DRLs that correlate with overall survival. A prognostic model was constructed through LASSO regression analysis based on DRLs, complemented by multivariate Cox regression analysis. The performance of this model was rigorously evaluated using Kaplan-Meier analysis, receiver operating characteristic (ROC) curves, and area under the ROC curve (AUC). Furthermore, this investigation delved into the potential signaling pathways, immune status, tumor mutation burden (TMB), and responses to anticancer therapies associated with varying prognoses in patients with BLCA.

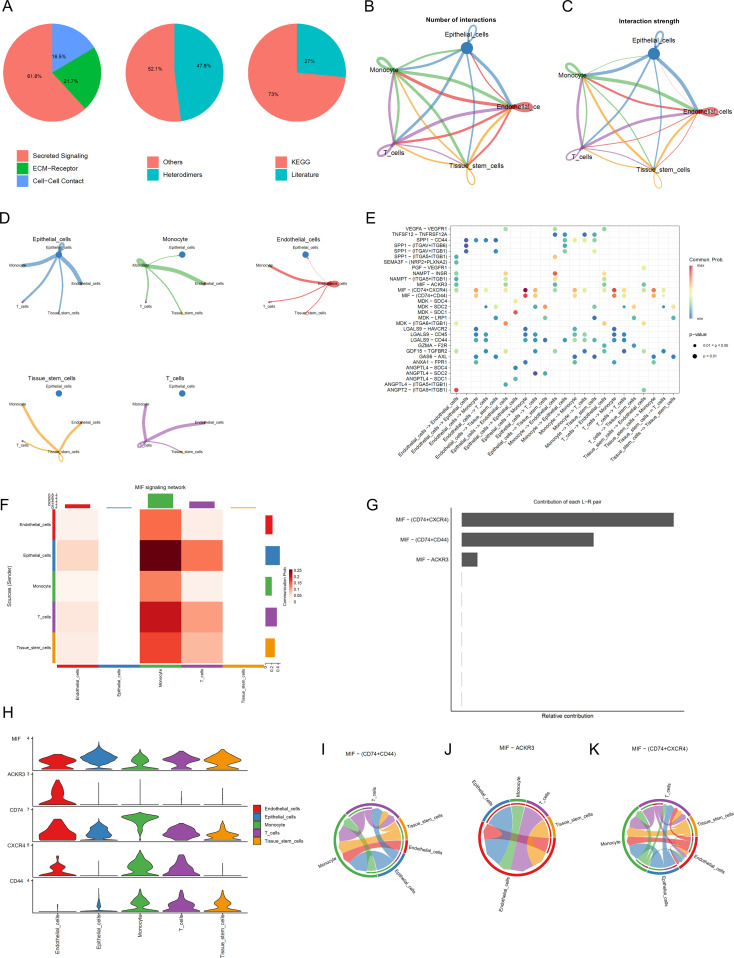
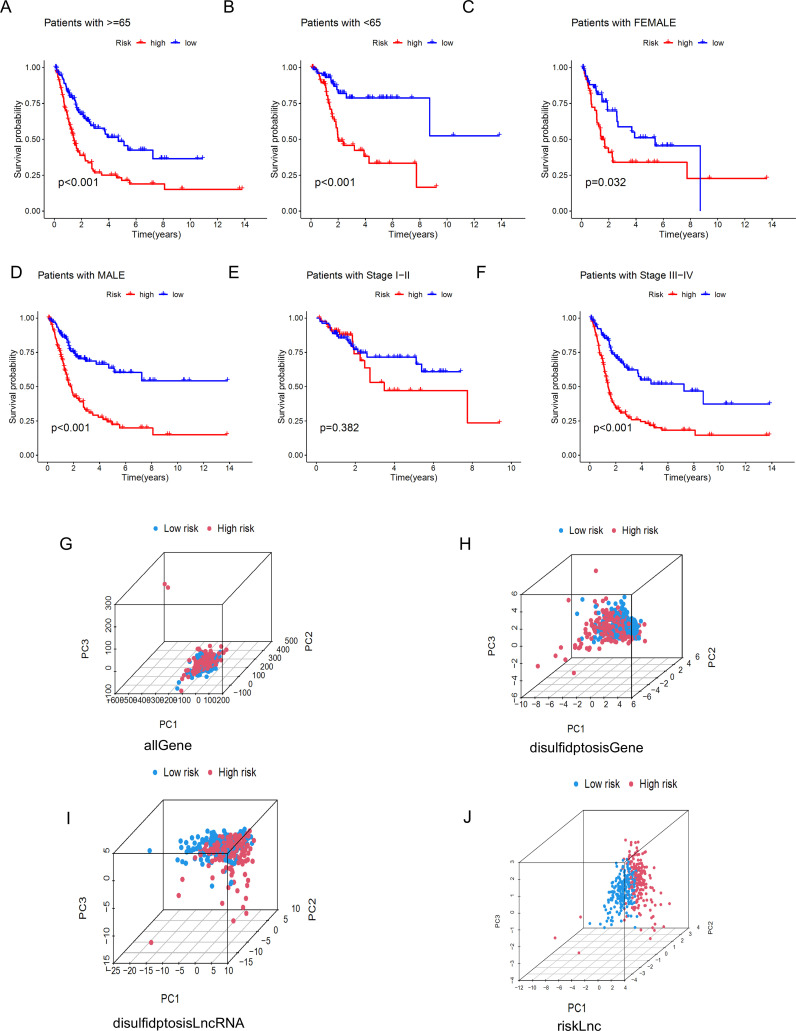
Results: We identified twelve differentially expressed DRGs and elucidated their corresponding intercellular communication relationships. Notably, epithelial cells function as ligands, signaling to other cell types, with the interactions between epithelial cells and both monocytes and endothelial cells exhibiting the strongest connectivity. This study identified six DRLs in BLCA-namely, C1RL-AS1, GK-AS1, AC134349.1, AC104785.1, AC011092.3, and AC009951.6, and constructed a nomogram to improve the predictive accuracy of the model. The DRL features demonstrated significant associations with various clinical variables, diverse immune landscapes, and drug sensitivity profiles in BLCA patients. Furthermore, RT-qPCR validation confirmed the aberrant expression levels of these DRLs in BLCA tissues, affirming the potential of DRL characteristics as prognostic biomarkers.

Conclusion: We established a DRLs model that serves as a predictive tool for the prognosis of BLCA patients, as well as for assessing tumor mutation burden, immune cell infiltration, and responses to immunotherapy and targeted therapies. Collectively, this study contributes valuable insights toward advancing precision medicine within the context of BLCA.

Keywords: bladder cancer; disulfidptosis; immune microenvironment; lncRNA; prognostic model; sequencing; single-cell RNA.


Conflict of interest statement

The authors declare that the research was conducted in the absence of any commercial or financial relationships that could be construed as a potential conflict of interest.

Figures

Figure 1
Figure 1
The flow chart of the study. *, p < 0.05; **, p < 0.01; ***, p < 0.001.
Figure 2
Figure 2
Single-cell analysis results (A), Gene count、sequencing depth and percentage of mitochondrial genes. (B) The 1500 most variable genes and the 10 most variable genes. (C) Heatmap of PCA (Principal Component Analysis). (D) Cluster map after cell annotation. (E) Scatter plots for 12 DRGs (Cell types are shown in D). (F) Violin plots for 12 DRGs.
Figure 3
Figure 3
Cell Communication Analysis (A) Percentage graph of receptor-ligand pair types. (B) Relationship graph of interaction quantity. (C) Relationship graph of interaction strength. (D) Communication network graph for individual cell types. (E) Bubble chart of receptor-ligand pairs FHeatmap of cell communication. (F) Represents the heatmap of cell communication (G) Analysis graph of receptor-ligand pairs. (H) Expression levels of interaction genes. (I-K) Cellular communication maps at the receptor-ligand pair level.
Figure 4
Figure 4
Identification and prognostic model construction of DRLs in bladder cancer. (A) Sankey diagram showing the correlation between DRGs and the expression of 144 lncRNAs. (B) Univariate Cox regression analysis to evaluate 17 prognostic-related lncRNAs. (C) Lasso regression curve for 9 lncRNAs. (D) Ten-fold cross-validation of variables in the LASSO model. (E) Expression correlation between the 6 lncRNAs used for model construction and DRGs. *p < 0.05; **p < 0.01; ***p < 0.001.
Figure 5
Figure 5
Identification and evaluation of the prognostic value of the DRLs model. (A-C) Curve charts of risk scores from low to high for each BLCA patient in the training set, validation set, and overall set, survival status of BLCA patients sorted from low to high, and heatmap of the correlation between the 6 key lncRNAs and risk scores. (D-F) KM curves for OS of high-risk and low-risk patients in the training set, validation set, and overall set, indicating that the model has significant survival discrimination capabilities. (G-I) KM curves for progression-free survival of high-risk and low-risk patients in the training set, validation set, and overall set.
Figure 6
Figure 6
Prognostic value of the DRLs model and construction and validation of the nomogram. (A) Univariate Regression Analysis. (B),Multivariate Regression Analysis. (C) ROC Curve Analysis for 1-year, 3-year, and 5-year Survival. (D) ROC Curve Analysis for Clinical Characteristics. (E) Concordance Index Analysis for Clinical Characteristics. (F) Nomogram. (G) Calibration Curves for 1-year, 3-year, and 5-year Survival.
Figure 7
Figure 7
Kaplan-Meier survival curves and PCA analysis demonstrate the prognostic value of the risk model in BLCA patients, stratified by various clinical characteristics. (A-F) These figures show the KM curves for low-risk and high-risk BLCA patients, categorized based on different clinical characteristics. (G-J) Represent PCA analyses for all genes, disulfidptosis genes, disulfidptosis lncRNAs, and risk lncRNAs, respectively.
Figure 8
Figure 8
Functional analysis of the risk model.(“BP:(Biological Process);CC:(Cellular Component);MF:(Molecular Function). The significance of enrichment has been adjusted using the Benjamini-Hochberg method, with a false discovery rate (FDR) less than 0.05; the intensity of the color represents the -log10(FDR) value.) (A, B) GO analysis demonstrates enrichment in molecular biological processes (BP), cellular components (CC), and molecular functions (MF). (C, D) KEGG pathway analysis shows significantly enriched pathways. (E, F) GSEA analysis based on the KEGG pathway database for the high-risk and low-risk groups.
Figure 9
Figure 9
Differences in the tumor immune microenvironment between the low-risk and high-risk groups. (A) Violin plots comparing StromalScore, ImmuneScore, and ESTIMATEScore between the low-risk and high-risk groups. (B), Proportions of 22 tumor-infiltrating immune cell types in BLCA patients. (C) Differences in various types of immune cells between the high-risk and low-risk groups. (D) Abundance ratio of immune cells in BLCA samples. (E, F) KM analysis of OS for patients classified by TMB status and risk score. (G, H) KM analysis of OS for patients categorized by combining TMB status and risk score *, p < 0.05; **, p < 0.01; ***, p < 0.001.
Figure 10
Figure 10
BLCA patients’ response to immune checkpoint blockade and other antitumor treatments. (A) Violin plots show the difference in TIDE scores between high-risk and low-risk BLCA groups. (B-F) Drugs with better efficacy in the high-risk group. (G-L) Drugs with better efficacy in the low-risk group, ***p < 0.001.
Figure 11
Figure 11
The relative expression levels of the 6 lncRNAs. (A-F) In the TCGA database, the expression levels of 6 types of lncRNA in bladder tumor tissue and normal bladder tissue. (G-L) Relative normalized expression of six DRLs in bladder tumor tissues compared to adjacent normal tissues. *p < 0.05; **p < 0.01; ***p < 0.001; ns, no significance.

Similar articles

Cited by

References

    1. Chen W, Zheng R, Baade PD, Zhang S, Zeng H, Bray F, et al. . Cancer statistics in China, 2015. CA: Cancer J Clin. (2016) 66:115–32. doi: 10.3322/caac.21338 - DOI - PubMed
    1. Bray F, Laversanne M, Sung H, Ferlay J, Siegel RL, Soerjomataram I, et al. . Global cancer statistics 2022: GLOBOCAN estimates of incidence and mortality worldwide for 36 cancers in 185 countries. CA: Cancer J Clin. (2024) 74:229–63. doi: 10.3322/caac.21834 - DOI - PubMed
    1. Sanli O, Dobruch J, Knowles MA, Burger M, Alemozaffar M, Nielsen ME, et al. . Bladder cancer. Nat Rev Dis Primers. (2017) 3:17022. doi: 10.1038/nrdp.2017.22 - DOI - PubMed
    1. Ferlay J, Shin H-R, Bray F, Forman D, Mathers C, Parkin DM. Estimates of worldwide burden of cancer in 2008: GLOBOCAN 2008. Int J Cancer. (2010) 127:2893–917. doi: 10.1002/ijc.v127:12 - DOI - PubMed
    1. Charlton ME, Adamo MP, Sun L, Deorah S. Bladder cancer collaborative stage variables and their data quality, usage, and clinical implications: a review of SEER data, 2004-2010. Cancer. (2014) 120 Suppl 23:3815–25. doi: 10.1002/cncr.v120.S23 - DOI - PMC - PubMed

LinkOut - more resources