. 2025 Mar 19:8:0636.
doi: 10.34133/research.0636. eCollection 2025.

Altered Gut Microbiota Contributes to Acute-Respiratory-Distress-Syndrome-Related Depression through Microglial Neuroinflammation

Affiliations

Altered Gut Microbiota Contributes to Acute-Respiratory-Distress-Syndrome-Related Depression through Microglial Neuroinflammation

Bowen Zhu et al. Research (Wash D C). .

Abstract

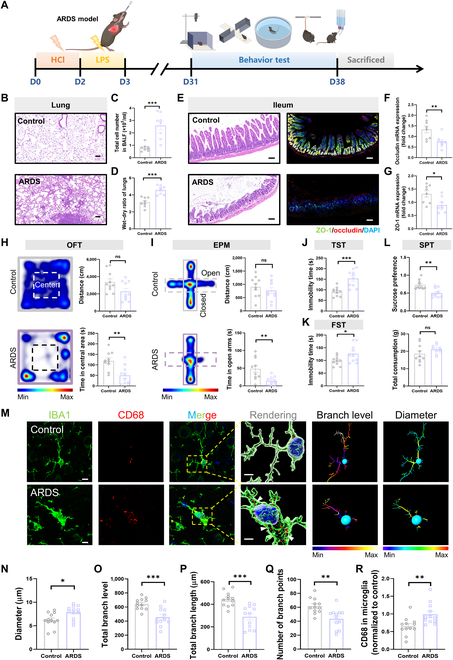
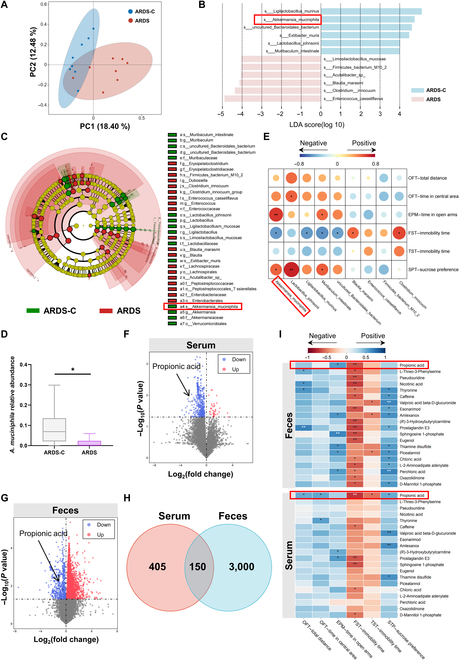
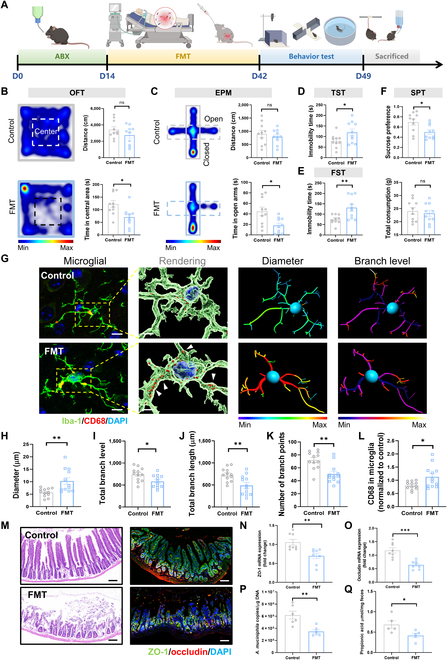
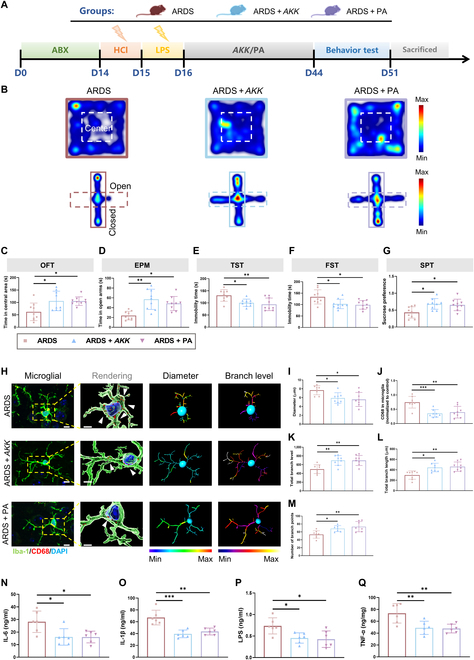
Acute respiratory distress syndrome (ARDS) survivors often suffer from long-term psychiatric disorders such as depression, but the underlying mechanisms remain unclear. Here, we found marked alterations in the composition of gut microbiota in both ARDS patients and mouse models. We investigated the role of one of the dramatically changed bacteria-Akkermansia muciniphila (AKK), whose abundance was negatively correlated with depression phenotypes in both ARDS patients and ARDS mouse models. Specifically, while fecal transplantation from ARDS patients into naive mice led to depressive-like behaviors, microglial activation, and intestinal barrier destruction, colonization of AKK or oral administration of its metabolite-propionic acid-alleviated these deficits in ARDS mice. Mechanistically, AKK and propionic acid decreased microglial activation and neuronal inflammation through inhibiting the Toll-like receptor 4/nuclear factor κB signaling pathway. Together, these results reveal a microbiota-dependent mechanism for ARDS-related depression and provide insight for developing a novel preventative strategy for ARDS-related psychiatric symptoms.


Figures

Fig. 1.
Fig. 1.
Akkermansia muciniphila (AKK) and propionic acid (PA) are down-regulated in acute respiratory distress syndrome (ARDS) patients with depression. (A) Schematic process of experimental design. Blood and stool samples were collected from 23 ARDS patients and 19 healthy volunteers. Samples were used for subsequent experiments. (B) β diversity of principal component analysis (PCA). (C) Analysis of the α diversity of gut microbiota in the feces of the 2 groups. (D and E) Linear discriminant analysis effect size (LEfSe) was used to find species with significant differences at all taxonomic levels of the gut microbiota in the feces of 2 groups. The comparison strategy was one-against-all, and the linear discriminant analysis (LDA) threshold was 2. (F) The relative abundance of AKK in the control group and ARDS group. (G) The relative abundance of gut microbiota in the ARDS depression group and ARDS nondepression group. (H) The concentration of AKK in feces was assessed by real-time polymerase chain reaction (qPCR) (n = 6). (I and J) The differential metabolites in serum and feces of ARDS and healthy control were revealed by volcano plots. X axis: log2 fold change (log2 FC); Y axis: −log10(adjusted P value). The cutoff was set using an FC of 2 and an adjusted P value of 0.01. (K) The Venn diagram indicates the intersection of 2 groups of changed metabolites. (L) Spearman’s correlation of PA in serum and feces. (M) Spearman’s correlation between AKK and PA in feces. (N) Relative levels of PA in serum and feces in depressed and nondepressed groups (Student t test, *P < 0.05, **P < 0.01, and ***P < 0.005; ns means not significant). HADS, Hospital Anxiety and Depression Scale.
Fig. 2.
Fig. 2.
Long-term depressive-like behavior disorder with breakdown of gut barrier integrity and microglial activation in ARDS mice. (A) The flowchart of the experiment shows the “2-hit” ARDS mouse model and the detection time of each cognitive behavior. (B) Hematoxylin–eosin staining was used to display the severity of lung injury. Scale bar = 100 μm. (C) and (D) are correlated with (B); the total cell number in bronchoalveolar lavage fluid (BALF) and the wet–dry ratio of lungs were calculated. (E) Immunofluorescence staining was used to detect the expression level of the tight junction protein zona occludens 1 (ZO-1, green) and occludin (red) in the mouse ileal tissues in each group. Scale bar = 50 μm. (F and G) Correlation with (E) and the messenger RNA (mRNA) expression levels of ZO-1 and occludin in the mouse ileal tissues were calculated. (H) Heatmap of mouse behavior in the open field test (OFT). Summarized data of distance and time in center area from the indicated group. (I) Heatmap of mouse behavior in the elevated plus maze (EPM). Summarized data of distance and time in open arm from the indicated group. (J) Measurement of immobility time in the tail suspension test (TST). (K) Measurement of immobility time in the forced swimming test (FST). (L) Summarized data of sucrose preference and total consumption from the indicated group. (M) Immunofluorescence micrographs of prefrontal cortex microglia (Iba-1, green; CD68, red). Inside the yellow box is a typical microglia. Scale bar = 10 μm. In the rendering, the white arrows indicate CD68. Scale bar = 5 μm. (N to R) Quantification of the branch diameter, branch level, branch length, number of branch points, and CD68 of prefrontal cortex microglia (both groups, n = 12 sections from 5 mice) (Student t test, *P < 0.05, **P < 0.01, and ***P < 0.005; ns means not significant). LPS, lipopolysaccharide; DAPI, 4′,6-diamidino-2-phenylindole; SPT, sucrose preference test; Iba-1, ionized calcium binding adaptor molecule 1.
Fig. 3.
Fig. 3.
AKK and metabolite PA are decreased in ARDS mice, which are associated with depressive behaviors. (A) β diversity of PCA. PC1 and PC2 can separate control mice from ARDS mice. (B and C) LEfSe was used to find species with significant differences at all taxonomic levels of the gut microbiota in the feces of the 2 groups of mice. The comparison strategy was one-against-all, and the LDA threshold was 2. (D) The relative abundance of AKK in the ARDS group and control group. (E) Correlation analysis heatmap of gut microbiota and measures of depression indicators in mice. Red represents a positive correlation; blue represents a negative correlation. (F and G) The differential metabolites in the serum and feces of ARDS and healthy control were revealed by volcano plots. X axis: log2 fold of change (log2 FC); Y axis: −log10(adjusted P value). The cutoff was set using an FC of 1 and an adjusted P value of 0.05. (H) The Venn diagram indicates the intersection of the 2 groups of changed metabolites. (I) Correlation analysis heatmap of fecal and serum metabolites in mice with depression indicators. Blue represents a positive correlation; red represents a negative correlation (Student t test, *P < 0.05 and **P < 0.01; ns means not significant). ARDS-C, control group.
Fig. 4.
Fig. 4.
Transplantation of the gut microbiota from ARDS patients to healthy mice leads to microglial activation, intestinal barrier damage, and depression-like behaviors. (A) Schematic and timeline of fecal microbiota transplant (FMT) and behavior tests. (B) Heatmap of mouse behavior in OFT. Summarized data of distance and time in center area from the indicated group. (C) Heatmap of mouse behavior in the EPM. Summarized data of distance and time in the open arm from the indicated group. (D) Measurement of immobility time in TST. (E) Measurement of immobility time in FST. (F) Summarized data of sucrose preference and total consumption from the indicated group. (G) Immunofluorescence micrographs of prefrontal cortex microglia (Iba-1, green; CD68, red). Inside the yellow box is a typical microglia. Scale bar = 10 μm. In the rendering, the white arrows indicate CD68. Scale bar = 5 μm. (H to L) Quantification of the diameter, branch level, branch length, number of branch points, and CD68 of prefrontal cortex microglia (both groups, n = 12 sections from 5 mice). (M) Immunofluorescence staining was used to detect the expression level of the tight junction protein ZO-1 (green) and occludin (red) in the mouse ileal tissues in each group. Scale bar = 50 μm. (N and O) Correlation with (M) and the mRNA expression levels of ZO-1 and occludin in the mouse ileal tissues were calculated. (P) The concentration of AKK in cecal content was assessed by qPCR. (Q) The contents of PA in the feces (Student t test, *P < 0.05 and **P < 0.01; ns means not significant). ABX, antibiotics.
Fig. 5.
Fig. 5.
AKK or PA treatment reduces the inflammation response and restores the behavior disorder of ARDS mice. (A) The flowchart shows the time points at which the mice were treated with AKK or PA after “2-hit” modeling, behavioral testing, and specimen collection (all groups, n = 9). (B) Representative heatmap of mouse behavior in the OFT and EPM. (C to G) Summarized data of mouse behavior in OFT, EPM, TST, FST, and SPT. (H) Immunofluorescence micrographs of prefrontal cortex microglia (Iba-1, green; CD68, red). Inside the yellow box is a typical microglia. Scale bar = 10 μm. In the rendering, the white arrows indicate CD68. Scale bar = 5 μm. (I to M) Quantification of the diameter, branch level, branch length, number of branch points, and CD68 of prefrontal cortex microglia (all groups, n = 8 sections from 5 mice). (N to Q) The levels of interleukin 6 (IL-6), interleukin 1 beta (IL-1β), LPS, and tumor necrosis factor alpha (TNF-α) in the cerebral cortex (n = 6). (one-way analysis of variance with Tukey’s multiple-comparisons tests, *P < 0.05, **P < 0.01, and ***P < 0.005; ns means not significant).
Fig. 6.
Fig. 6.
AKK and PA improve neuroinflammation by inhibiting Toll-like receptor 4 (TLR4)/nuclear factor κB (NF-κB) signaling in microglia. (A) PA treatment of primary microglia. (B) Immunofluorescence micrographs of microglia (Iba-1, green; CD68, red). Scale bar = 15 μm. (C to F) Levels of IL-6, IL-1β, and TNF-α and fluorescence intensity of CD68 in the microglia (n = 5). (G to J) Relative protein levels of TLR4, phospho-IκB (p-IκB), and p-P65 in mouse prefrontal cortex tissue by western blot (n = 3). (K to N) Relative protein levels of TLR4, p-IκB, and p-P65 in microglia by western blot (n = 3) (Student t test, *P < 0.05, **P < 0.01, ***P < 0.005, and ****P < 0.001; ns means not significant).
Fig. 7.
Fig. 7.
The microbiota–gut–brain axis regulates long-term depressive-like behaviors and neuroinflammation induced by ARDS, and supplementation of AKK and PA may be a promising therapeutic intervention strategy (image created with BioRender with permission).

References

    1. Bos LDJ, Ware LB. Acute respiratory distress syndrome: Causes, pathophysiology, and phenotypes. Lancet. 2022;400(10358):1145–1156. - PubMed
    1. Matthay MA, Zemans RL, Zimmerman GA, Arabi YM, Beitler JR, Mercat A, Herridge M, Randolph AG, Calfee CS. Acute respiratory distress syndrome. Nat Rev Dis Primers. 2019;5(1): Article 18. - PMC - PubMed
    1. Bienvenu OJ, Friedman LA, Colantuoni E, Dinglas VD, Sepulveda KA, Mendez-Tellez P, Shanholz C, Pronovost PJ, Needham DM. Psychiatric symptoms after acute respiratory distress syndrome: A 5-year longitudinal study. Intensive Care Med. 2018;44(1):38–47. - PMC - PubMed
    1. Aranda J, Oriol I, Martín M, Feria L, Vázquez N, Rhyman N, Vall-Llosera E, Pallarés N, Coloma A, Pestaña M, et al. . Long-term impact of COVID-19 associated acute respiratory distress syndrome. J Infect. 2021;83(5):581–588. - PMC - PubMed
    1. Huang M, Parker AM, Bienvenu OJ, Dinglas VD, Colantuoni E, Hopkins RO, Needham DM, National Institutes of Health, National Heart, Lung, and Blood Institute Acute Respiratory Distress Syndrome Network. Psychiatric symptoms in acute respiratory distress syndrome survivors: A 1-year national multicenter study. Crit Care Med. 2016;44(5):954–965. - PMC - PubMed

LinkOut - more resources