. 2025 May;12(5):986-997.
doi: 10.1002/acn3.70032. Epub 2025 Mar 20.

Abnormal Synchronization Between Cortical Delta Power and Ripples in Hippocampal Sclerosis

Affiliations

Abnormal Synchronization Between Cortical Delta Power and Ripples in Hippocampal Sclerosis

Takamitsu Iwata et al. Ann Clin Transl Neurol. 2025 May.

Abstract

Objective: Discriminating between epileptogenic and physiological ripples in the hippocampus is important for identifying epileptogenic (EP) zones; however, distinguishing these ripples on the basis of their waveforms is difficult. We hypothesized that the nocturnal synchronization of hippocampal ripples and cortical delta power could be used to classify epileptogenic and physiological ripples in the hippocampus.

Methods: We enrolled 38 patients with electrodes implanted in the hippocampus or parahippocampal gyrus between April 2014 and March 2023 at our institution. We divided 11 patients (11 hippocampi) who were pathologically diagnosed with hippocampal sclerosis into the EP group and five patients (six hippocampi) with no epileptogenicity in the hippocampus into the nonepileptogenic (NE) group. Hippocampal ripples were detected using intracranial electroencephalography with hippocampal or parahippocampal electrodes. Cortical delta power (0.5-4 Hz) was assessed using cortical electrodes. The Pearson correlation coefficient between the ripple rates and cortical delta power (Corr-RD) was calculated on the basis of the intracranial electroencephalographic signals recorded each night.

Results: Although hippocampal ripples were similar among the EP and NE groups based on their waveforms and frequency properties, the Corr-RDs in the EP group (mean [standard deviation]: 0.20 [0.049]) were significantly lower than those in the NE group (0.67 [0.070]). On the basis of the minimum Corr-RDs, the two groups were classified with 94.1% accuracy.

Interpretation: Our results demonstrate that the Corr-RD is a biomarker of hippocampal epileptogenicity.

Keywords: delta band power; epileptogenicity; hippocampus; pathological ripple; sharp‐wave ripple.


Conflict of interest statement

The authors declare no conflicts of interest.

Figures
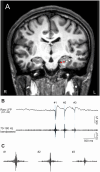
FIGURE 1
FIGURE 1
Electrodes in the hippocampus and detection of ripples. (A) An image showing preoperative magnetic resonance imaging (MRI) and postimplantation computed tomography (CT) data illustrating the electrode placement within the hippocampus. (B) Hippocampal LFPs are the bipolar potential recorded from A1–A2 (top) processed using a bandpass filter with a range of 70–180 Hz (bottom). The blue shaded area indicates the detected ripples. (C) Magnified views of three representative SWRs.
FIGURE 2
FIGURE 2
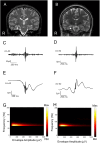
Representative hippocampal ripples detected in patients in the NE and EP groups. (A, B) Preoperative magnetic resonance imaging (MRI) data of two representative patients: Pt 15 in the NE group (A) and Pt 22 in the EP group (B). The arrowhead indicates the hippocampi, in which intracranial electrodes were implanted. The right hippocampus of Pt 22 shows hippocampal sclerosis. (C, D) Illustrative single ripple waveforms recorded with the implanted electrodes for patients in the NE group (C) and EP group (D). (E, F) Mean waveform of the field potential recorded with the implanted electrodes for patients in the NE group (E) and EP group (F). (G, H) The distributions of the peak slow‐wave amplitude and peak frequency of every ripple event are shown as a color map for the representative patients from the NE group (G) and EP group (H). The density plot reveals that all events for both patients are included in a single cluster with similar frequencies and envelope amplitudes.
FIGURE 3
FIGURE 3
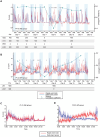
Representative examples of the hippocampal ripple event rates, cortical delta power, and seizures during 10 days of iEEG recording. (A) Time course of the hippocampal ripple event rate (red) and cortical delta power (blue) over nine consecutive days for a representative patient in the NE group (Pt 15). The light blue background indicates the time of day when the room was dark. The square symbol represents the correlation coefficient between the ripple event rate and the delta power over the whole day. The asterisk indicates the timing of the seizure. The lower column indicates the amount of antiepileptic agent provided. (B) Time course of the ripple event rate (red) and cortical delta power (blue) over nine consecutive days for a representative patient in the EP group (Pt 22). The light blue background indicates the time of day when the room was dark. The square symbol represents the correlation coefficient between the ripple event rate and the delta power over the whole day. The asterisk indicates the timing of the seizure. The lower column indicates the amount of the antiepileptic agent provided. (C, D) The lines show the mean and 95% confidence intervals of the Z‐scored ripple event rate (red) and delta power (blue) over 24 h for patients in the NE group (C) and EP group (D).
FIGURE 4
FIGURE 4
Corr‐RD values of long‐term recordings differ between the EP and NE groups. (A) Fisher z‐transformed correlation coefficients between the hippocampal ripple event rate and the cortical delta power are plotted for each day after electrode implantation for all patients in the EP (red) and NE (blue) groups. (B) Mean correlation coefficients aligned on the day with the minimum correlation coefficient are plotted with the mean frequency of the seizure events. The error bars represent the 95% confidence intervals. (C) The minimum value of the correlation coefficient between the hippocampal ripple event rate and the cortical delta power for each patient in each group is plotted. (D) ROC curve for classifying the NE and EP groups on the basis of the minimum value of the correlation coefficient.

References

    1. Kucewicz M. T., Cimbalnik J., Matsumoto J. Y., et al., “High Frequency Oscillations Are Associated With Cognitive Processing in Human Recognition Memory,” Brain 137, no. 8 (2014): 2231–2244. - PMC - PubMed
    1. Liu S., Sha Z., Sencer A., et al., “Exploring the Time‐Frequency Content of High Frequency Oscillations for Automated Identification of Seizure Onset Zone in Epilepsy,” Journal of Neural Engineering 13, no. 2 (2016): 26026. - PubMed
    1. Scott J. M., Ren S., Gliske S. V., and Stacey W. C., “Preictal Variability of High‐Frequency Oscillation Rates in Refractory Epilepsy,” Epilepsia 61, no. 11 (2020): 2521–2533. - PMC - PubMed
    1. González Otárula K. A., von Ellenrieder N., Cuello‐Oderiz C., Dubeau F., and Gotman J., “High‐Frequency Oscillation Networks and Surgical Outcome in Adult Focal Epilepsy,” Annals of Neurology 85, no. 4 (2019): 485–494. - PubMed
    1. Zijlmans M., Jiruska P., Zelmann R., Leijten F. S. S., Jefferys J. G. R., and Gotman J., “High‐Frequency Oscillations as a New Biomarker in Epilepsy,” Annals of Neurology 71, no. 2 (2012): 169–178. - PMC - PubMed

LinkOut - more resources