

Metabolic stress and age drive inflammation and cognitive decline in mice and humans
- PMID: 40110679
- PMCID: PMC11923576
- DOI: 10.1002/alz.70060
Metabolic stress and age drive inflammation and cognitive decline in mice and humans
Abstract
Introduction: Metabolic stressors (obesity, metabolic syndrome, prediabetes, and type 2 diabetes [T2D]) increase the risk of cognitive impairment (CI), including Alzheimer's disease (AD). Immune system dysregulation and inflammation, particularly microglial mediated, may underlie this risk, but mechanisms remain unclear.
Methods: Using a high-fat diet-fed (HFD) model, we assessed longitudinal metabolism and cognition, and terminal inflammation and brain spatial transcriptomics. Additionally, we performed hippocampal spatial transcriptomics and single-cell RNA sequencing of post mortem tissue from AD and T2D human subjects versus controls.
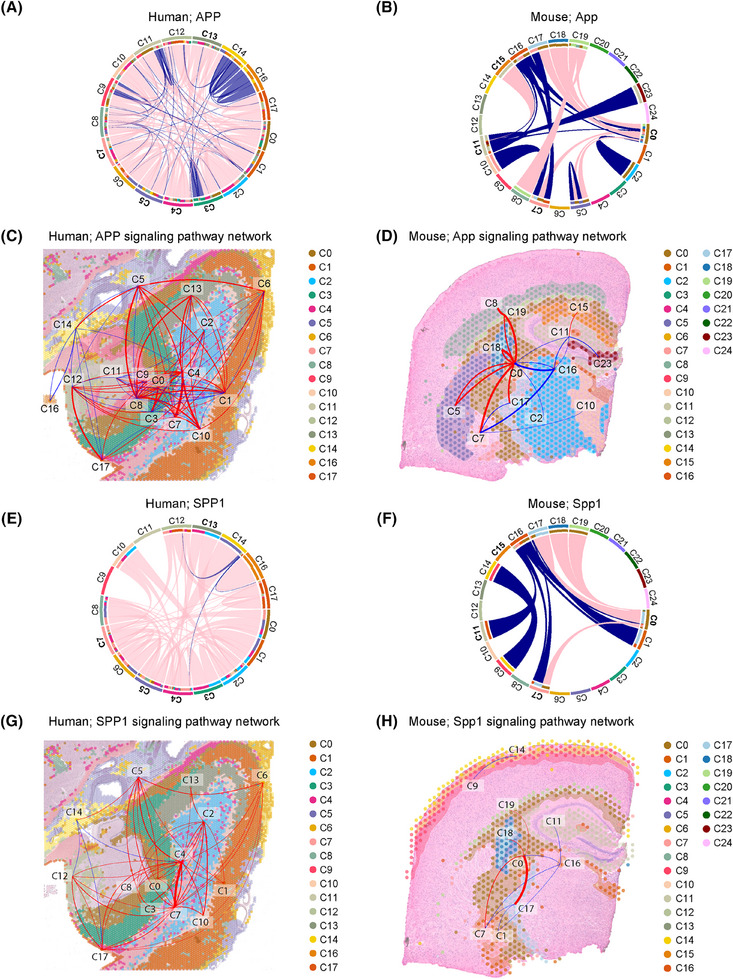
Results: HFD induced progressive metabolic and CI with terminal inflammatory changes, and dysmetabolic, neurodegenerative, and inflammatory gene expression profiles, particularly in microglia. AD and T2D human subjects had similar gene expression changes, including in secreted phosphoprotein 1 (SPP1), a pro-inflammatory gene associated with AD.
Discussion: These data show that metabolic stressors cause early and progressive CI, with inflammatory changes that promote disease. They also indicate a role for microglia, particularly microglial SPP1, in CI.
Highlights: Metabolic stress causes persistent metabolic and cognitive impairments in mice. Murine and human brain spatial transcriptomics align and indicate a pro-inflammatory milieu. Transcriptomic data indicate a role for microglial-mediated inflammatory mechanisms. Secreted phosphoprotein 1 emerged as a potential target of interest in metabolically driven cognitive impairment.
Keywords: cognitive impairment; hippocampus; human; inflammation; microglia; mouse; obesity; prediabetes; type 2 diabetes.
© 2025 The Author(s). Alzheimer's & Dementia published by Wiley Periodicals LLC on behalf of Alzheimer's Association.
Conflict of interest statement
The authors declare no conflicts of interest. Author disclosures are available in the supporting information.
Figures


References
-
- Zhang X‐X, Tian Y, Wang Z‐T, Ma Y‐H, Tan L, Yu J‐T. The epidemiology of Alzheimer's disease modifiable risk factors and prevention. J Prev Alzheimers Dis. 2021;8:313‐321. - PubMed
-
- Blüher M. Obesity: global epidemiology and pathogenesis. Nat Rev Endocrinol. 2019;15(5):288‐298. - PubMed
-
- Palmer MK, Toth PP. Trends in lipids, obesity, metabolic syndrome, and diabetes mellitus in the United States: an NHANES analysis (2003‐2004 to 2013‐2014). Obesity. 2019;27:309‐314. - PubMed
MeSH terms
Grants and funding
- Kenneth and Frances Eisenberg Emerging Scholar Fund
- U01AG046170/National Institutes of Health (AD Knowledge Portal)
- R01AG032990/National Institutes of Health (AD Knowledge Portal)
- RF1AG057440/National Institutes of Health (AD Knowledge Portal)
- P30AG19610/National Institutes of Health (AD Knowledge Portal)
- U01AG006576/National Institutes of Health (AD Knowledge Portal)
- P30 DK020572/DK/NIDDK NIH HHS/United States
- P30 EY007003/EY/NEI NIH HHS/United States
- R01AG15819/National Institutes of Health (AD Knowledge Portal)
- P30 AG053760/AG/NIA NIH HHS/United States
- Kiriluk Family Fund for Brain Health Research
- R01AG025711/National Institutes of Health (AD Knowledge Portal)
- P50AG016574/National Institutes of Health (AD Knowledge Portal)
- R01DK130913/NH/NIH HHS/United States
- AACSF-22-970586/ALZ/Alzheimer's Association/United States
- U24AG061340/National Institutes of Health (AD Knowledge Portal)
- P30 CA046592/CA/NCI NIH HHS/United States
- U01AG46152/National Institutes of Health (AD Knowledge Portal)
- P30AG053760/NH/NIH HHS/United States
- R01AG017216/National Institutes of Health (AD Knowledge Portal)
- Frank L. and Helen Gofrank Foundation Research Program in Alzheimer's Disease and Brain Health
- R01AG036836/National Institutes of Health (AD Knowledge Portal)
- R01AG018023/National Institutes of Health (AD Knowledge Portal)
- K08 AG084902/AG/NIA NIH HHS/United States
- R01AG003949/National Institutes of Health (AD Knowledge Portal)
- Arizona Department of Health Services and the Arizona Biomedical Research Commission (AD Knowledge Portal)
- K99AG071667/NH/NIH HHS/United States
- U01AG046139/National Institutes of Health (AD Knowledge Portal)
- P30AG072931/NH/NIH HHS/United States
- Robert E. Nederlander Sr. Program for Alzheimer's Research
- Sinai Medical Staff Foundation Research on Studying Diet and Brain Health Fund
- NeuroNetwork for Emerging Therapies
- Edith S. Briskin/SKS Foundation NeuroNetwork Emerging Scholar Fund
- Mayo and Michael J. Fox Foundations (AD Knowledge Portal)
- T32 GM007863/GM/NIGMS NIH HHS/United States
- P30CA046592/NH/NIH HHS/United States
- P30AG72975/National Institutes of Health (AD Knowledge Portal)
- Tauber Family Student Internship Program
- P30EY007003/NH/NIH HHS/United States
- S10 OD028612/OD/NIH HHS/United States
- U24NS072026/National Institutes of Health (AD Knowledge Portal)
- Cure PSP (AD Knowledge Portal)
- R01NS080820/National Institutes of Health (AD Knowledge Portal)
- R01 DK130913/DK/NIDDK NIH HHS/United States
- P30AG10161/National Institutes of Health (AD Knowledge Portal)
- S10OD28612-01-A1/NH/NIH HHS/United States
- U01AG61356/National Institutes of Health (AD Knowledge Portal)
- K99 AG071667/AG/NIA NIH HHS/United States
- Andrea and Lawrence A. Wolfe Brain Health Initiative
- P30 AG072931/AG/NIA NIH HHS/United States
- Taubman Foundation
- U01AG006786/National Institutes of Health (AD Knowledge Portal)
- R01AG17917/National Institutes of Health (AD Knowledge Portal)
- Handleman Emerging Scholar Fund
- P30DK020572/NH/NIH HHS/United States
- Robert and Katherine Jacobs Environmental Health Initiative
LinkOut - more resources
Full Text Sources
Medical
Research Materials
Miscellaneous
