. 2025 Jul;66(7):2538-2553.
doi: 10.1111/epi.18366. Epub 2025 Mar 20.

Toward molecular phenotyping of temporal lobe epilepsy by spatial omics

Collaborators, Affiliations

Toward molecular phenotyping of temporal lobe epilepsy by spatial omics

Isabeau Vermeulen et al. Epilepsia. 2025 Jul.

Abstract

Objective: In temporal lobe epilepsy (TLE), detection of the epileptogenic zone predicts a good surgical outcome. When submitted to 18F-fluorodeoxyglucose positron emission tomography (PET), some patients display lateralized, focal hypometabolism in the temporal lobe (PET+), whereas others appear normometabolic (PET-). However, the mechanism behind this metabolic difference remains unclear. This study aimed to identify differential molecular mechanisms in these patient subtypes.

Methods: Neocortical and hippocampal biopsies of TLE patients (n = 3 PET+, n = 3 PET-) and nonepileptic postmortem controls (n = 3) were analyzed for lipid distribution using mass spectrometry imaging (MSI). Laser capture microdissection of the neocortical gray matter and hippocampal cornu ammonis and dentate gyrus was guided by MSI-derived lipid profiles and histological annotations. Dissected areas were then subjected to liquid chromatography- tandem mass spectrometry-based label-free quantitative proteomic analysis.

Results: MSI showed distinct lipid profiles, namely, phosphatidylserines were more abundant in PET+ samples in both the neocortex and hippocampus. Proteomic analysis showed significant differences between TLE and nonepileptic postmortem controls involving pathways in neuron excitability and neurotransmitter transporters, which were upregulated in TLE. Compared to PET-, all PET+ specimens displayed significantly dysregulated calcium signaling. Additionally, the neocortex of PET+ patients showed a shift from mitochondrial to cytosolic (cytoplasm of the cell) processes, whereas the hippocampus was characterized by a disruption of glycosylation and polyamine metabolism.

Significance: The applied spatial omics approach demonstrated localized molecular differences between metabolic subtypes of TLE patients. These findings may further specify these TLE subtypes and provide leads for targeted treatment.

Keywords: MALDI‐MSI; lipidomics; metabolism; proteomics; temporal lobe epilepsy.


Conflict of interest statement

None of the authors has any conflict of interest to disclose.

Figures
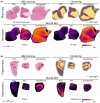
FIGURE 1
FIGURE 1
Integration of hematoxylin and eosin (H&E) staining with matrix‐assisted laser desorption/ionization mass spectrometry imaging (MALDI‐MSI) clustering lipid data. (A) H&E staining (including tissue annotations) together with the clustering data from the MALDI‐MSI experiments (in negative polarity) allowed us to select the neocortical layers (NL) in the neocortex samples for laser microdissection (LMD) with examples of MALDI images (phosphatidylethanolamines [PE] 36:1 and PE 40:6). (B) H&E staining (including tissue annotations) together with the clustering data from the MALDI‐MSI experiments (in negative polarity) allowed us to select the cornu ammonis (CA) and dentate gyrus (DG) in the human hippocampus samples for LMD analysis. MALDI‐MSI revealed distinct lipid profiles in these two regions with examples of MALDI images (PE 40:6, sulfatides [SHexCer] 42:2). The red circles in the figure (LMD regions) are the regions from which a 5‐mm2 region of interest was taken. PET, positron emission tomography.
FIGURE 2
FIGURE 2
Differential protein abundance and principal component analysis in neocortex samples. (A) Principal component analysis indicates differences between the positron emission tomography (PET)‐positive (PET+), PET‐negative (PET−), and nonepileptic postmortem control neocortex samples using component 1 (33.7% of variance) and component 3 (12.7% of variance). (B) Volcano plot highlighting proteins that are significantly differently abundant between nonepileptic postmortem controls and epilepsy neocortex. These volcano plots illustrate the −log10 p‐value versus the log 2‐fold change of protein abundance, with more abundant proteins in epilepsy (red) and less abundant proteins in epilepsy (blue). (C) Volcano plot of differentially abundant proteins, highlighting proteins that are statistically significant in PET+ and PET− comparison. These volcano plots illustrate the −log10 p‐value versus the log 2‐fold change of protein abundance, with proteins more abundant in PET+ (red) and less abundant in PET+ (blue). APOA2, apolipoprotein type 2; AT1A2, adenosine triphosphatase subunit alpha 1; HBG2, hemoglobin subunit 2.
FIGURE 3
FIGURE 3
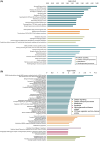
Pathway enrichment analysis in neocortex and hippocampus samples. (A) Unique enriched pathways in the comparison between positron emission tomography (PET)‐positive (PET+) and PET‐negative (PET−) samples in the neocortex and (B) in the hippocampus with their corresponding p‐value (p < 0.05 and false discovery rate < 5%). Each color represents a different main pathway. APC/C, anaphase promoting complex/cyclosome; ATP, adenosine triphosphate; CDK5, cyclin‐dependent kinase 5; CLEC7A, C‐type lectin domain family 7 member (Dectin‐1); CREB1, cAMP response element‐binding protein 1; CPOI, coat protein complex I; EGFR(VIII), epidermal growth factor receptor (Variant III); EML4, echinoderm microtubule associated protein‐Like 4; EPH, erythropoietin‐producing hepatoma; EPHB, ephrin type‐B receptor; ER, endoplasmic reticulum; ERBB2, erb‐B2 receptor tyrosine kinase 2 (HER2); ERBB2 ECD, erb‐B2 receptor tyrosine kinase 2 extracellular domain; GTPases, guanosine triphosphate hydrolases; KEAP1‐NFE2L2, kelch‐like ECH‐associated protein 1‐nuclear factor erythroid 2 related factor 2; L1CAM, L1 cell adhesion molecule; NCAM, neural cell adhesion molecule; NMDA, N‐Methyl‐D‐aspartate; NTRK3, neurotrophic receptor tyrosine kinase 3; NUDC, nuclear migration protein C; PAKs, p21‐activated kinases; PRKCZ, protein kinase C zeta; RAS, rat sarcoma virus; RHOBTB(2 or 3), rho‐related BTB domain containing protein (2 or 3); RHOU, ras homolog family member U; SLC2A4 (GLUT4), solute carrier family 2 member 4 (glucose transporter type 4); SNARE, soluble N‐ethylmaleimide sensitive factor attachment protein receptor; TCR, T cell receptor; TGF‐beta, transforming growth factor‐beta; TMD/JMD, transmembrane domain/Juxtamembrane domain; TRKC, tropomyosin receptor kinase C; UCH, ubiquitin C‐terminal hydrolase; VEGF(A), vascular endothelial growth factor (A); VEGFR2, vascular endothelial growth factor reactive oxygen species (eceptor 2).
FIGURE 4
FIGURE 4
Differential protein abundance in hippocampal epilepsy and positron emission tomography (PET)‐positive (PET+) versus PET‐negative (PET−) comparisons. (A) Volcano plot of differentially abundant proteins in the hippocampus, highlighting proteins that are statistically significant in nonepileptic postmortem control and epilepsy comparison. These volcano plots illustrate the −log10 p‐value versus the log 2‐fold change of protein abundance with more abundance in epilepsy (red) and less abundant in epilepsy (blue). (B) Volcano plot of differentially abundant proteins, highlighting proteins that are statistically significant in PET+ and PET− comparison. These volcano plots illustrate the −log10 p‐value versus the log 2‐fold change of protein abundance with more abundant in PET+ (red) and less abundant in PET+ (blue). APOA2, apolipoprotein type 2; HBE, hemoglobin subunit epsilon; HBG2, hemoglobin subunit 2; IGHG1, immunoglobulin heavy constant gamma‐1.
FIGURE 5
FIGURE 5
Proposed summary of the impaired biological mechanisms in the neocortex and hippocampus related to metabolic changes in temporal lobe epilepsy (TLE). NMDA, N‐methyl‐D‐aspartate. (Created with  https://BioRender.com/f28c368 .)

References

    1. Alomar SA, Moshref RH, Moshref LH, Sabbagh AJ. Outcomes after laser interstitial thermal ablation for temporal lobe epilepsy: a systematic review and meta‐analysis. Neurosurg Rev. 2023;46:261. - PubMed
    1. Wiebe S, Blume WT, Girvin JP, Eliasziw M. A randomized, controlled trial of surgery for temporal‐lobe epilepsy New England. J Med. 2001;345:311–318. - PubMed
    1. Engel J, McDermott MP, Wiebe S, Langfitt JT, Stern JM, Dewar S, et al. Early surgical therapy for drug‐resistant temporal lobe epilepsy: a randomized trial. JAMA. 2012;307:922–930. - PMC - PubMed
    1. Johnson GW, Cai LY, Narasimhan S, Gonzalez HFJ, Wills KE, Morgan VL, et al. Temporal lobe epilepsy lateralisation and surgical outcome prediction using diffusion imaging. J Neurol Neurosurg Psychiatry. 2022;93:599–608. - PMC - PubMed
    1. Haemels M, Van Weehaeghe D, Cleeren E, Dupont P, van Loon J, Theys T, et al. Predictive value of metabolic and perfusion changes outside the seizure onset zone for postoperative outcome in patients with refractory focal epilepsy. Acta Neurol Belg. 2022;122:325–335. - PubMed

MeSH terms

Substances

LinkOut - more resources