. 2025 Mar 20;135(10):e184021.
doi: 10.1172/JCI184021. eCollection 2025 May 15.

TP53 mutations and TET2 deficiency cooperate to drive leukemogenesis and establish an immunosuppressive environment

Affiliations

TP53 mutations and TET2 deficiency cooperate to drive leukemogenesis and establish an immunosuppressive environment

Pu Zhang et al. J Clin Invest. .

Abstract

Mutations and deletions in TP53 are associated with adverse outcomes in patients with myeloid malignancies, and there is an urgent need for the development of improved therapies for TP53-mutant leukemias. Here, we identified mutations in TET2 as the most common co-occurring mutation in patients with TP53-mutant acute myeloid leukemia (AML). In mice, combined hematopoietic-specific deletion of TET2 and TP53 resulted in enhanced self-renewal compared with deletion of either gene alone. Tp53/Tet2 double-KO mice developed serially transplantable AML. Both mice and patients with AML with combined TET2/TP53 alterations upregulated innate immune signaling in malignant granulocyte-monocyte progenitors, which had leukemia-initiating capacity. A20 governs the leukemic maintenance by triggering aberrant noncanonical NF-κB signaling. Mice with Tp53/Tet2 loss had expansion of monocytic myeloid-derived suppressor cells (MDSCs), which impaired T cell proliferation and activation. Moreover, mice and patients with AML with combined TP53/TET2 alterations displayed increased expression of the TIGIT ligand, CD155, on malignant cells. TIGIT-blocking antibodies augmented NK cell-mediated killing of Tp53/Tet2 double-mutant AML cells, reduced leukemic burden, and prolonged survival in Tp53/Tet2 double-KO mice. These findings describe a leukemia-promoting link between TET2 and TP53 mutations and highlight therapeutic strategies to overcome the immunosuppressive bone marrow environment in this adverse subtype of AML.

Keywords: Hematology; Inflammation; Leukemias; Mouse models; Oncology; p53.


Figures
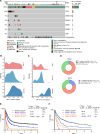
Figure 1
Figure 1. TET2 mutations are common in TP53-mutant AML and confer an inferior outcome.
(A) Oncoprint of patients with TP53-mutant AML with indication of the top 6 most common co-occurring genetic events as well as cytogenetics and tumor mutational burden (TMB) among 216 patients with AML with somatic TP53 mutations. Data are from Alliance (our unpublished observations), Beat AML (10), and Rodriguez-Meira et al. (11). (B) Density estimation of variant allele frequency (VAF) of TP53 mutations across 668 TP53-mutant patients (subdivided by patients with 1 TP53 mutation, >1 TP53 mutation, or TP53 mutation plus deletion). Data are from AACR Project GENIE (12). (C) As in B but for TET2 mutations from 80 TP53-mutant patients (subdivided by patients with 1 TET2 mutation, >1 TET2 mutation, or TET2 mutation plus deletion). (D) The portion and VAF of TET2 and TP53 mutations in 26 patients with TP53/TET2 comutations. Data are from Alliance, Beat AML (10), and Rodriguez-Meira et al. (11). (E) Kaplan-Meier survival curve in 1,603 patients with AML based on TP53 and TET2 mutational status from Alliance. OS, overall survival. (F) As in E but for an independent cohort of 653 patients with AML from the University of Chicago. A log-rank test was used for survival statistics.
Figure 2
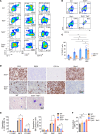
Figure 2. Hematopoietic–cell specific Tp53- and Tet2-KO mice develop lethal leukemia.
(A) Kaplan-Meier survival curves of Tp53–/–Tet2–/–, Tet2–/–, Tp53–/–, and WT mice. n = 32 WT mice, n = 23 Tp53–/– mice, n = 19 Tet2–/– mice, and n = 21 Tp53–/–Tet2–/– mice. **P < 0.01; ***P < 0.001. (B and C) Box-and-whisker plots of (B) hematocrit (HCT) and (C) white blood cell (WBC) counts of 4-month-old mice with different genotypes. (D) H&E staining of spleen and bone marrow in moribund mice of various genotypes. Scale bar: 100 μm; original magnification, ×2 (spleen, left); ×60 (spleen, right, and bone marrow). Data are representative of n = 6–7 mice/genotype. (E) Box-and-whisker plots of percentage of bone marrow blasts, based on D at the age of 4 months. For box-and-whisker plots in B, C, and E, boxes represent median, first, and third quartiles, with whiskers extending to 1.5× interquartile range. n = 6–7 mice/genotype. ANOVA with Dunnett’s test was used for significance. *P < 0.05; **P < 0.01; ***P < 0.001. Tp53–/–Tet2–/–, Vav-cre Tet2fl/fl Tp53fl/fl; Tet2–/–, Vav-cre Tet2fl/fl; Tp53–/–, Vav-cre Tp53fl/fl; WT, Vav-cre.
Figure 3
Figure 3. Tp53/Tet2 double-KO mice develop AML characterized by expansion of granulocyte macrophage progenitors.
(A) Representative flow cytometry analysis of lineages of CD45dimSSClo cells in spleens from Tp53–/–Tet2–/–, Tet2–/–, Tp53–/–, and WT mice at the time of sacrifice (4 months of age). (B) Representative flow cytometry analysis of CD11b+cKIT+ cells in peripheral blood from moribund 4-month-old Tp53–/–Tet2–/– mice and age-matched controls. (C) Frequency of CD11b+ and cKIT+ cells among CD45.2+ cells in peripheral blood of moribund 4-month-old Tp53–/–Tet2–/– mice and age-matched controls. n = 3–6 mice/group. *P < 0.05. Mean ± SEM. ANOVA with Dunnett’s test was used for significance. (D) Top: Immunohistochemical staining of spleens of representative moribund mice for the proteins indicated. Scale bar: 100 μm. Bottom: Wright-Giemsa stain of peripheral blood of Tp53–/–Tet2–/– and littermate WT mice. Data are representative of n = 6 mice/group. Scale bar: 10 μm. (E) Left: Frequencies of long-term hematopoietic stem cells (LT-HSC), multipotent progenitors (MPP), and short-term HSCs (ST-HSC) among bone marrow lineage-negative Sca1+cKIT+ (LSK) cells of 16-week-old mice with the indicated genotypes. Right: Frequencies of common myeloid progenitors (CMP), granulocyte macrophage progenitors (GMPs), and megakaryocyte-erythroid progenitors (MEPs) among bone marrow LinSca-1cKIT+ cells of 16-week-old mice with the indicated genotypes. n = 3 mice/group; Mean ± SD. ANOVA with Dunnett’s test. (F) Percentage of bone marrow EdU+ GMPs in 16-week-old mice with the indicated genotypes. n = 5 mice/group. *P<0.05. ANOVA with Dunnett’s test was used for significance. Tp53–/–Tet2–/–, Vav-cre Tet2fl/fl Tp53fl/fl; Tet2–/–, Vav-cre Tet2fl/fl; Tp53–/–, Vav-cre Tp53fl/fl; WT, Vav-cre.
Figure 4
Figure 4. Increased hematopoietic progenitor self-renewal in Tp53/Tet2 double-KO mice.
(A) Number of colonies from plating of 10,000 cells from the bone marrow of 16-week-old Vav-cre Tp53fl/flTet2fl/fl mice and controls in methylcellulose. Mean ± SD of 3 technical replicates. (B) Kaplan-Meier curves of recipient CD45.1+ mice following competitive transplantation of bone marrow cells (1 × 10⁶ cells) from leukemic CD45.2+ primary transgenic mice with the indicated genotypes into lethally irradiated recipient mice with CD45.1+ supporting bone marrow cells (1 × 10⁶ cells). n = 10 WT mice, n = 10 Tp53–/– mice, n = 12 Tet2–/– mice, and n = 10 Tp53–/–Tet2–/– mice. (C) Box-and-whisker plots of CD45.2+ cells in peripheral blood of mice from B. Boxes represent median, first, and third quartiles, with whiskers extending to 1.5× interquartile range. n = 10 mice/genotype. (D) Disease incidence in moribund recipient mice following competitive transplantation of bone marrow cells from primary transgenic mice with the indicated genotypes. T-ALL, T acute lymphoblastic leukemia; CMML, chronic myelomonocytic leukemia; AML, acute myeloid leukemia. Tp53–/–Tet2–/–, Vav-cre Tet2fl/fl Tp53fl/fl; Tet2–/–, Vav-cre Tet2fl/fl; Tp53–/–, Vav-cre Tp53fl/fl; WT, Vav-cre. A log-rank test was used for survival statistics; otherwise, ANOVA with Dunnett’s test was used for P values. *P < 0.05; **P < 0.01; ***P < 0.001.
Figure 5
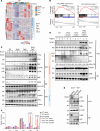
Figure 5. Myeloid predisposition and enhanced innate immune signaling in Tp53–/–Tet2–/– precursor cells.
(A) Heatmap of top differentially expressed genes (FDR < 0.05) within the myeloid differentiation pathway of LSK cells from 4-month-old mice with different genotypes. Key myeloid transcriptional factors upregulated in Tp53/Tet2 double-KO LSK cells relative to other groups are highlighted. (B) GSEA plots of inflammatory responses and the Myc pathway in LSK cells from Tp53–/–Tet2–/– mice with AML relative to control mice. (C) Western blot of TLR2, A20, noncanonical NF-κB pathway components (NIK, p52/p100, and phosphorylated p100 [p-p100] in whole-cell lysate [WCL] and RelB in nuclear extract [NE]) and canonical NF-κB pathway members (p65, phosphorylated-IKKα [p-IKKα], and IKKα) in cKit+ bone marrow cells from age-matched mice with indicated genotypes (3 mice per group). β-Actin and Lamin B1 served as housekeeping controls in WCL and NE, respectively. (D) Western blot of TLR2, A20, NIK, and p52/p100 in WCL and RelB in NE from patients with combined TET2 and TP53 mutations, either mutation alone, or neither TET2 or TP53 mutations (WT). β-Actin and Lamin B1 served as housekeeping controls in WCL and NE, respectively. Analysis of fold change normalized to the control lane is shown below immunoblot where indicated. (E) Western blot of A20, phosphorylated IkBα (p-IkBα), and total IkBα in WCL and RelB and RelA in NE in cKit+ bone marrow cells of Tp53–/–Tet2–/– mice treated with control (sgNeg) or 1 of 2 A20-targeting sgRNAs. β-Actin and Lamin B1 served as housekeeping controls in WCL and NE, respectively. (F) Mean number of methylcellulose colonies in cells from E and WT bone marrow cells treated with control or 1 of 2 A20-targeting sgRNAs. Mean ± SD shown. **P < 0.01. Results are representative of 2–3 independent experiments. Tp53–/–Tet2–/–, Vav-cre Tet2fl/fl Tp53fl/fl; Tet2–/–, Vav-cre Tet2fl/fl; Tp53–/–, Vav-cre Tp53fl/fl; WT, Vav-cre.
Figure 6
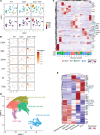
Figure 6. Tp53/Tet2 comutant AML displays unique transcriptional signatures.
(A) UMAP plots of single-cell transcriptomes of bone marrow mononuclear cells from Vav-cre control mice (WT), Vav-cre Tp53fl/fl mice, or Vav-cre Tet2fl/fl Tp53fl/fl mice. Cell density (2D kernel density estimate mapped to color scale) plots are shown underneath. n = 2 mice/group; 3 weeks after engraftment into CD45.1+ mice. (B) UMAP projection of the expression of selected myeloid marker genes. Expression is displayed by color scale as log10-transformed expression (size factor normalized unique molecular identifier counts). (C) Heatmap with hierarchical clustering showing top differentially expressed genes in clusters from A across the different groups of mice. The normalized proportion allocations of cells of various phenotypes in each cluster are shown as stacked bar plots underneath the heatmap. (D) Annotated subpopulations (Leiden clusters) of AML blast clusters (partition clusters 3 and 6) (49) showing identified AML subtypes. (E) Heatmap showing top differentially expressed genes identified in each AML subtype from D. Tp53–/–Tet2–/–, Vav-cre Tet2fl/fl Tp53fl/fl;Tp53–/–, Vav-cre Tp53fl/fl; WT, Vav-cre.
Figure 7
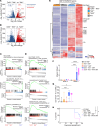
Figure 7. Mutant Tp53 and Tet2 cooperatively transform murine GMP progenitors.
Volcano plots depicting top differentially expressed genes in GMPs (LincKIT+Sca1 CD16/32+ CD34+) from (A) Tp53–/–Tet2–/– versus Tet2–/– or (B) Tp53–/–Tet2–/– versus Tp53–/– mice. (C) GSEA plots of pathways enriched in GMPs from Tp53–/–Tet2–/– mice with AML relative to Tet2–/– control mice. (D) As in C but for GMPs from Tp53–/–Tet2–/– mice with AML relative to Tp53–/– control mice. (E) Heatmap of top differentially expressed genes (adjusted P < 0.05) within the STEMNESS_UP pathway of GMP cells from 4-month-old mice with different genotypes. Key genes upregulated in Tp53–/–Tet2–/– GMP cells are highlighted. (F) CD45.2+ (mutant) to CD45.1+ (WT) cell ratios and (G) CD11b+Gr1+ percentage in CD45.2+ cells in the peripheral blood of recipient mice engrafted with CD45.2+ cell types (either GMPs or whole bone marrow [BM]) from the animals with the indicated genotypes. For box-and-whisker plots, boxes represent median, first, and third quartiles, with whiskers extending to 1.5× interquartile range. P values are shown (ANOVA with Dunnett’s test). ***P < 0.001; **** P < 0.0001. (H) Kaplan-Meier curves of lethally irradiated CD45.1+ mice receiving whole BM or GMP cells from mice with different genotypes. Log-rank test was used for survival statistics. *P < 0.05. Tp53–/–Tet2–/–, Vav-cre Tet2fl/fl Tp53fl/fl; Tet2–/–, Vav-cre Tet2fl/fl; Tp53–/–, Vav-cre Tp53fl/fl; WT, Vav-cre.
Figure 8
Figure 8. Monocytic MDSCs emerge in Tp53–/–Tet2–/– leukemic environment to cause T cell dysfunction.
(A) Representative FACS plots of the frequency of monocytic (CD11b+Ly6GLy6C+) and granulocytic MDSCs (CD11b+Ly6G+Ly6C) in splenocytes from Vav-cre Tet2fl/flTp53fl/fl (Tp53–/–Tet2–/–), Vav-cre Tet2fl/fl (Tet2–/–), Vav-cre Tp53fl/fl (Tp53–/–), and WT mice (n = 6 mice/group). Suppression of T cell proliferation by isolated MDSCs: T cells from WT mouse spleens were isolated and stimulated with anti-CD3/CD28 Dynabeads. Subsequently, T cells were cocultured with MDSCs isolated from Tp53–/–Tet2–/–, Tet2–/–, Tp53–/–, and WT mouse spleens for 72 hours. Cell division was measured with CFSE proliferation assays. n = 6 mice/group. (B) Quantification of the percentage of monocytic and granulocytic MDSCs in CD45.2+ splenocytes across genotypes, as in A. (C) Quantification of the percentage of CFSE dilution in T cell proliferation and percentage of cytokine-expressing T cells upon coculture with MDSCs isolated from Tp53–/–Tet2–/–, Tet2–/–, Tp53–/–, and WT mice. P values are shown (ANOVA with Dunnett’s test). *P < 0.05; **P < 0.01; ****P < 0.0001. (D) Representative flow plot showing the division of CD4+ or CD8+ T cells with CFSE staining in response to MDSC coculture in the presence or absence of blocking antibodies or arginase inhibitor (Nor-NOHA). cKit+CD11b+Ly6C+Ly6G monocytic MDSCs from Tet2–/–Tp53–/– mice were sorted and cocultured with anti-CD3/CD28–activated congenic CD8+ or CD4+ T cells at 1:8 ratio in the presence of IL-2 for 72 hours. In the selected conditions, coculture was performed in the presence of blocking antibodies or Nor-NOHA (N-Hydroxy-nor-L-arginine). (E) Percentage of CFSE dilution in T cell proliferation in T cell–MDSC coculture under different treatment conditions. For box-and-whisker plots, boxes represent median, first, and third quartiles, with whiskers extending to 1.5 × interquartile range. n = 6 mice/group. P values are shown (ANOVA with Dunnett’s test). *P < 0.05; **P < 0.01; ***P < 0.001; ****P < 0.0001. Tp53–/–Tet2–/–, Vav-cre Tet2fl/fl Tp53fl/fl; Tet2–/–, Vav-cre Tet2fl/fl; Tp53–/–, Vav-cre Tp53fl/fl; WT, Vav-cre.
Figure 9
Figure 9. Immunosuppressive microenvironment of TP53/TET2 double-mutant AML that is partially alleviated by TIGIT inhibition.
(A) Representative t-distributed stochastic neighbor embedding (t-SNE) plots of multicolor flow cytometric analysis of selected immune checkpoint molecule levels on murine splenocytes from mice with the indicated genotypes. (B) Histograms of CD155 and CD112 expression by flow cytometry on LK cells of the bone marrow of Tp53–/–Tet2–/– or Cre+ control mice (WT). (C) Quantification of CD155 on murine cKIT+ progenitors of different genotypes by flow cytometry. Values (mean fluorescence intensity [MFI]) are shown as mean ± SEM; n = 3 mice/group; P values are shown (ANOVA with Dunnett’s test). ****P < 0.0001. (D) Representative flow plots and (E) quantification of CD155 expression on CD45dimSSCloCD33+ blasts from patients with AML harboring different mutations by spectral flow. Values (mean fluorescence intensity MFI) are shown as mean ± SEM; n = 7–12 patients/group; P values are shown (ANOVA with Dunnett’s test). ****P < 0.0001. (F) Schematic of experiment to analyze the effect of NK depletion on anti-TIGIT antibody efficacy. (G) Box-and-whisker plots of percentage of NKp46+NK1.1+ cells in peripheral blood of mice at 2 weeks posttreatment initiation. **P < 0.01. (H) CD45.2+ (mutant) to CD45.1+ (WT) cell ratios and (I) CD11b+Gr1+ percentage in CD45.2+ cells in the peripheral blood of recipient mice. For box-and-whisker plots, boxes represent median, first, and third quartiles, with whiskers extending to 1.5× interquartile range. P values are shown (ANOVA with Dunnett’s test). *P < 0.05; **P < 0.01. ***P < 0.001; ****P < 0.0001. (J) Kaplan-Meier curves of lethally irradiated PepBoyJ CD45.1+ mice receiving whole or NK-depleted CD45.1+ supporting bone marrow cells and 1 × 10⁶ bone marrow cells from Tp53–/–Tet2–/– mice followed by IgG2a isotype control or anti-TIGIT antibody treatment. Log-rank test was used for survival statistics. ****P < 0.0001. Tp53–/–Tet2–/–, Vav-cre Tet2fl/fl Tp53fl/fl; Tet2–/–, Vav-cre Tet2fl/fl; Tp53–/–, Vav-cre Tp53fl/fl; WT, Vav-cre.

References

    1. Döhner H, et al. Diagnosis and management of AML in adults: 2022 recommendations from an international expert panel on behalf of the ELN. Blood. 2022;140(12):1345–1377. doi: 10.1182/blood.2022016867. - DOI - PubMed
    1. Liu Y, et al. Deletions linked to TP53 loss drive cancer through p53-independent mechanisms. Nature. 2016;531(7595):471–475. doi: 10.1038/nature17157. - DOI - PMC - PubMed
    1. Chen SS, et al. Mutant p53 drives clonal hematopoiesis through modulating epigenetic pathway. Nat Commun. 2019;10(1):5649. doi: 10.1038/s41467-019-13542-2. - DOI - PMC - PubMed
    1. Loizou E, et al. A gain-of-function p53-mutant oncogene promotes cell fate plasticity and myeloid leukemia through the pluripotency factor FOXH1. Cancer Discov. 2019;9(7):962–979. doi: 10.1158/2159-8290.CD-18-1391. - DOI - PMC - PubMed
    1. Boettcher S, et al. A dominant-negative effect drives selection of TP53 missense mutations in myeloid malignancies. Science. 2019;365(6453):599–604. doi: 10.1126/science.aax3649. - DOI - PMC - PubMed

MeSH terms