. 2025 Mar 20;16(1):364.
doi: 10.1007/s12672-025-02110-4.

A novel PAK1/TCF1 regulatory axis promotes non-small cell lung cancer progression

Affiliations

A novel PAK1/TCF1 regulatory axis promotes non-small cell lung cancer progression

Chuangang Lu et al. Discov Oncol. .

Abstract

Background: Non-small cell lung cancer (NSCLC) is the leading cause of cancer death, necessitating the identification of novel therapeutic targets. P21-activated kinases-1 (PAK1) plays a crucial role in oncogenesis, including NSCLC. Recent findings have elucidated T cell factor 1 (TCF1) as an anti-tumour factor, influencing T cell biology. However, the precise mechanism by which PAK1 promotes NSCLC progression via TCF1 regulation remains unclear.

Methods: We collected 23 pairs of NSCLC tissue samples and obtained NSCLC RNA sequencing data and corresponding clinicopathologic information from The Cancer Genome Atlas (TCGA). Quantitative reverse transcription polymerase chain reaction (qRT-PCR) and immunohistochemistry (IHC) assessed PAK1 and TCF1 expression in NSCLC tissues and cells. Gain and loss-of-function experiments evaluated PAK1 and TCF1 effects on cell proliferation, invasion, migration, and apoptosis in vitro. Mechanistically, western blot (WB) and immunoprecipitation analysis evaluated the interaction between PAK1 and TCF1 in NSCLC. Finally, we assessed the clinical prognostic, disease progression, and immunotherapy response of PAK1 and TCF1 and their correlation with immune cell infiltration, immune checkpoint inhibitors (PD1, PDL1).

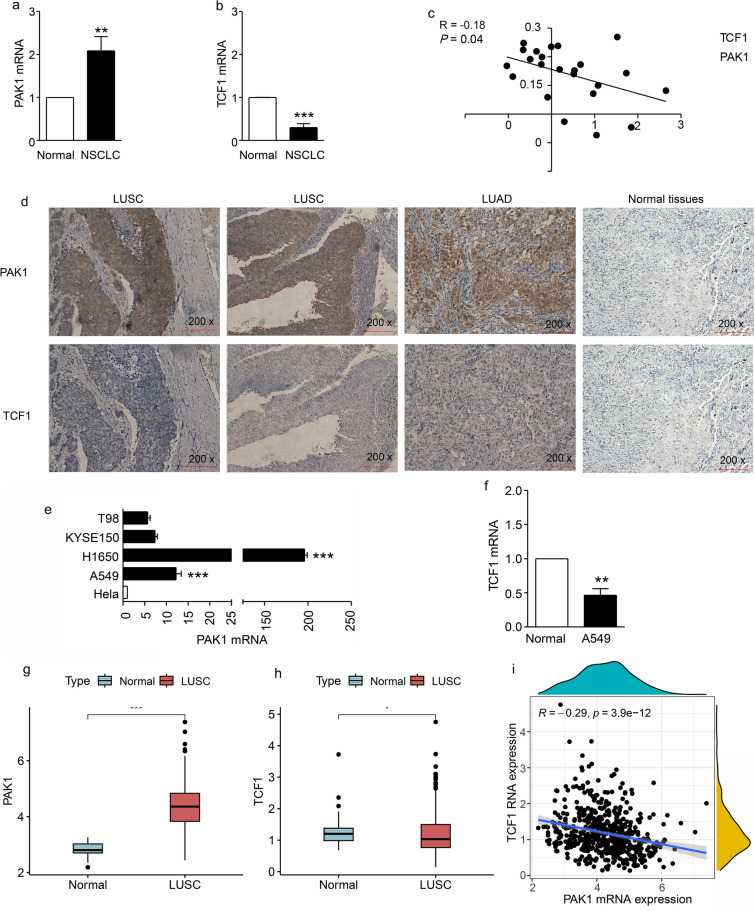
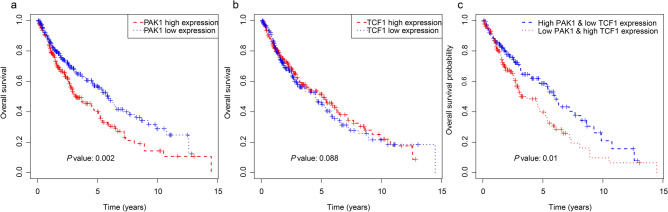
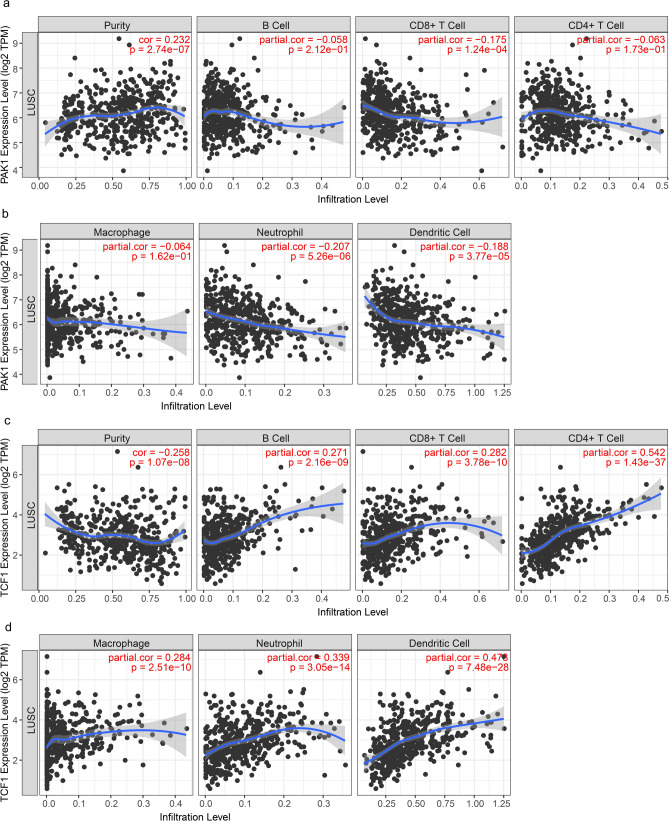
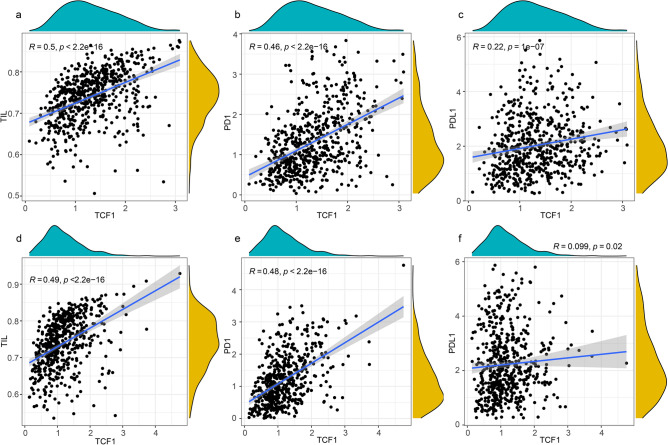
Results: PAK1 expression was elevated in NSCLC tissues and cells, while TCF1 was significantly downregulated. PAK1 expression showed a significant inverse correlation with TCF1 mRNA in NSCLC. Silencing PAK1 (using shRNAs) and inhibiting PAK1 with the small molecule IPA-3 suppressed NSCLC cell malignancy in a dose-dependent manner, upregulating TCF1 expression, and vice versa. TCF1 amplification with the small molecule (TWS119) inhibited NSCLC cell proliferation, migration, and invasion in a dose-dependent manner without affecting PAK1 expression. Immunoprecipitation analysis confirmed PAK1 and TCF1 interaction in NSCLC. Joint survival analysis indicated that high PAK1 and low TCF1 expression were associated with unfavourable survival in patients with NSCLC. Lastly, the TCF1 was significantly correlated with immune cell infiltration [CD8+ T cell, and tumor infiltrating lymphocytes (TILs)], immune checkpoint inhibitors (PD1, PDL1), and can accurately predict the immunotherapeutic response.

Conclusion: This study demonstrates, for the first time, that PAK1 negatively regulates TCF1, contributing to NSCLC pathogenesis. The PAK1/TCF1 regulatory axis emerges as a critical determinant of carcinogenesis and a promising therapeutic target for NSCLC.

Keywords: PAK1; TCF1; Carcinogenesis; Non-small cell lung cancer; Therapeutic targets.


Conflict of interest statement

Declarations. Ethics approval and consent to participate: The studies involving human samples were reviewed and approved by the Research Ethics Committee of Third People’s Hospital of Hainan Province, and complied with the Declaration of Helsinki (No. LLKY2406211). All of the participants signed written informed consent and agreed to the use of their samples and data for scientific research. Competing interests: The authors declare no competing interests.

Figures

Fig. 1
Fig. 1
Analysis of PAK1 and TCF1 expression and their relationship in non-small cell lung cancer (NSCLC) tissues and cells as well as TCGA lung squamous cell carcinoma (LUSC) cohort. Expression of PAK1 (a) (mean ± SD, n = 23, **P < 0.01,) and TCF1 (b) (mean ± SD, n = 23, *** P < 0.001,) assayed by qRT-PCR in NSCLC tissue. c Inverse association between the TCF1 and PAK1 levels of mRNAs in human NSCLC tissue (R2 = −0.18, P = 0.04). d Human NSCLC (LUSC, lung adenocarcinoma (LUAD), and normal lung tissues) were subjected to immunohistochemical analyses with anti-PAK1 and TCF1 antibodies. Representative images from tissues with different histologic types are shown: LUSC; LUAD; Magnification, 200×. e Expression of PAK1 assayed by qRT-PCR in A549, H1650, KYSE150, Hela and T98 cell lines. PAK1 was highly expressed in A549 and H1650. (mean ± SD, ***P < 0.001). f The expression of TCF1 were analyzed by qRT-PCR in A549 cells (mean ± SD, **P < 0.01). All data are representative of at least three independent experiments. Comparison of the expression of PAK1 (g) and TCF1 (h) between LUSC samples and normal samples in TCGA LUSC transcriptome data. The asterisks indicate a significant statistical P value calculated using the Wilcoxon test (*P < 0.05; **P < 0.01; ***P < 0.001). i Correlation between PAK1 expression and TCF1 expression. Correlation coefficient and P value were calculated by Spearman correlation analysis
Fig. 2
Fig. 2
PAK1 plays a critical role in tumorigenesis of A549 lung cancer cell line. a Expression of PAK1 in enforced expression-PAK1 and expressing shRNA targeting PAK1 stable A549 cell line. (mean ± SD, ***P < 0.001). b Western blotting showing total PAK1 in A549 stably expressing PAK1 and A549 expressing PAK1 shRNAs cell lines. c Cell proliferation assay of A549 stably expressing PAK1 cell line (left) and knocking down PAK1 stable A549 cell line (right) (mean ± SD, *P < 0.05, **P < 0.01, ***P < 0.001). d A549 stable cell lines with PAK1 amplification were analyzed by Wound healing assay. The cell morphology images were captured over 40 h at a magnification of 10×. Scale bar, 100 μm (mean ± SD, *P < 0.05, **P < 0.01, ***P < 0.001). e Invasion of A549 cell line stably expressing PAK1 or expressing shRNA targeting PAK1, assayed by Transwell migration assay (48 h after seeding). The number of migrated cells were counted and represented in the bar chart (right). (mean ± SD, **P < 0.01, ***P < 0.001). f Anchorage-independent growth of A549 cells expressing shRNA targeting PAK1 was measured by colony formation assay. The number of colonies was counted by image J and represented in the bar chart. (mean ± SD, ***P < 0.001). g FACS analysis for Annexin V and PI staining to assess apoptosis/necrosis in shPAK1 stable A549 cell line. The percentage of A549 cells stained with Annexin V was shown in bar chart. ***P < 0.001
Fig. 3
Fig. 3
Targeting PAK1 signaling with IPA-3 inhibits the growth and migration of A549. a Total and phosphorylated PAK1 and TCF1 in A549 cells treated with IPA-3 (4 μg/ml) for 0 h, 2 h and 6 h were assessed by Western blotting. b Cell viability of A549 cells treated with increasing amounts of IPA3 (DMSO, 1, 4, 7 and 10 μg/ml) was measured by MTT assay every 24 h (mean ± SD, *P < 0.05, ***P < 0.001). c The growth of A549 cells treated with increasing amounts of IPA3 (DMSO, 1, 4, 7 μg/ml) at different time points (0, 6, 18, 24, 30, 40 h) was evaluated by Wound healing assay. The cell morphology images were captured over 40 h at a magnification of 10×. Scale bar, 100 μm (mean ± SD, *P < 0.05, ***P < 0.001). d Migration of A549 cell treated with increasing amounts of IPA3 (1, 4, 7 μg/ml) for 48 h was assayed by Transwell assay. The number of migrated cells were counted and represented in the bar chart (right) (mean ± SD, **P < 0.01, ***P < 0.001). e Growth of A549 cell treated with increasing amount of IPA3 (1, 4, 7 μg/ml) for 10 days was estimated by plate colony formation assay. The number of colonies were counted by image J and represented in the bar chart (mean ± SD, **P < 0.01, ***P < 0.01)
Fig. 4
Fig. 4
Amplification of TCF1 induced by TWS119 restrains the transformation of A549 cells. a Expression of TCF1 and PAK1 in A549 cells treated with TWS119 (3 μM) for 6 h were examined by Western blot. The ratio of TCF1/β-catenin was shown in bar chart (right). b Cell proliferation of A549 cells treated with TWS119 at the indicated doses for 5 days was measured by MTT assay (mean ± SD, **P < 0.01, ***P < 0.001). c Proliferation and migration of A549 cells treated with increasing concentration of TWS119 (1, 3, 7 μM) at different time points were analyzed by Wound healing assay (mean ± SD, **P < 0.01, ***P < 0.001). d Invasion analysis of A549 cells treated with increasing concentrations of TWS119 (1, 3, 7 μM) for 48 h was performed by Transwell assay (mean ± SD, **P < 0.01, ***P < 0.001). e Growth of A549 cells treated with increasing amounts of TWS119 (1, 3, 7 μM) for 10 days was estimated by a plate colony formation assay. The number of colonies was counted by image J and represented in the bar chart. Tightly packed colonies were visualized by staining, and the number of colonies for each condition was shown (right) (mean ± SD, **P < 0.01, ***P < 0.001)
Fig. 5
Fig. 5
PAK1 directly interacts with TCF1. a Plasmids encoding Flag-TCF1 (400 ng) and HA-PAK1 with increasing amounts (0, 50 and 100 ng) were co-transfected into HEK293T cells for 24 h, cells were harvested and evaluated by Immunoblot analysis with the indicated antibodies. b Plasmids encoding HA-PAK1 with increasing amounts (0, 50 and 100 ng) were transfected into HEK293T cells for 24 h, endogenous TCF1 was observed by IB using indicated antibody. c HEK293T cells were co-transfected with Plasmids encoding Flag-TCF1 and HA-PAK1 and cultured for 24 h. TCF1 was immunoprecipitated using an anti-Flag antibody. Co-immunoprecipitated PAK1 was detected using an anti-HA antibody. IP immunoprecipitation, IB immunoblotting, WCL whole cell lysate. d Expression of TCF1 assayed by qRT-PCR in A549 stably expressing exogenous PAK1 (left) or A549 cells expressing PAK1 shRNAs (mean ± SD, *P < 0.05, ***P < 0.001). e Histologic analysis for PAK1 and TCF1 was performed on A549 cells stably expressing exogenous PAK1 or A549 cells expressing PAK1 shRNAs. Note This is because the WB run out to wrap the antibodies will crop the membrane to wrap the antibodies separately. Therefore images of some full-length spots are not available
Fig. 6
Fig. 6
The clinical prognostic value of PAK1 and TCF1 expression were evaluated through Kaplan–Meier survival curve and Joint survival analysis in TCGA LUSC cohort. a Kaplan–Meier survival curve of NSCLC patients with high and low PAK1 expression. PAK1 with high PAK1 expression are those with PAK1 expression levels higher than the median expression level of PAK1 in dataset. The P value (log-rank test) is indicated. b Kaplan–Meier survival curve of NSCLC patients with high and low TCF1 expression. TCF1 with high TCF1 expression are those with PAK1 expression levels higher than the median expression level of TCF1 in dataset. The P value (log-rank test) is indicated. c Joint survival analysis of NSCLC patients with high PAK1 and low TCF1 expression vs. low PAK1 and high TCF1 expression. The P value (log-rank test) is indicated
Fig. 7
Fig. 7
Analyzing the correlation between PAK1 or TCF1 and infiltrating immune cells in TCGA LUSC cohort through TIMER2.0. a The correlation between PAK1 and tumour purity, B cell, CD8+ T cell, CD4+ T cell. b The correlation between PAK1 and macrophage, neutrophil, and dendritic cell. c The correlation between TCF1 and tumour purity, B cell, CD8+ T cell, CD4+ T cell. d The correlation between TCF1 and macrophage, neutrophil, and dendritic cell. Correlation coefficient and P value were calculated by Spearman correlation analysis
Fig. 8
Fig. 8
Correlation of TCF1 with tumor infiltrating lymphocytes (TILs), PD1 and PDL1. a The correlation between TCF1 and TILs in LUAD. b The correlation between TCF1 and PD1 in LUAD. c The correlation between TCF1 and PDL1 in LUAD. d The correlation between TCF1 and TILs in LUSC. e The correlation between TCF1 and PD1 in LUSC. f The correlation between TCF1 and PDL1 in LUSC. Correlation coefficient and P value were calculated by Spearman correlation analysis

References

    1. Megyesfalvi Z, Gay CM, Popper H, et al. Clinical insights into small cell lung cancer: tumor heterogeneity, diagnosis, therapy, and future directions. CA Cancer J Clin. 2023;73(6):620–52. 10.3322/caac.21785. - PubMed
    1. Xu S, Chen X, Ying H, Chen J, Ye M, Lin Z, Zhang X, Shen T, Li Z, Zheng Y, Zhang D, Ke Y, Chen Z, Lu Z. Multi-omics identification of a signature based on malignant cell-associated ligand-receptor genes for lung adenocarcinoma. BMC Cancer. 2024;24(1):1138. 10.1186/s12885-024-12911-5. - PMC - PubMed
    1. Xu S, Lu Z. The role of LMNB2 as a diagnostic and prognostic biomarker in lung adenocarcinoma. Asian J Surg. 2024;S1015–9584(24):01799–808. 10.1016/j.asjsur.2024.08.056. - PubMed
    1. Belli S, Pesapane A, Servetto A, et al. Combined blockade of mTOR and p21-activated kinases pathways prevents tumour growth in KRAS-mutated colorectal cancer. Br J Cancer. 2023;129(7):1071–82. 10.1038/s41416-023-02390-z. - PMC - PubMed
    1. Babagana M, Johnson S, Slabodkin H, Bshara W, Morrison C, Kandel ES. P21-activated kinase 1 regulates resistance to BRAF inhibition in human cancer cells. Mol Carcinog. 2017;56(5):1515–25. 10.1002/mc.22611. - PMC - PubMed

LinkOut - more resources