. 2025 Mar 20:14:e101350.
doi: 10.7554/eLife.101350.

Tissue inflammation induced by constitutively active STING is mediated by enhanced TNF signaling

Affiliations

Tissue inflammation induced by constitutively active STING is mediated by enhanced TNF signaling

Hella Luksch et al. Elife. .

Abstract

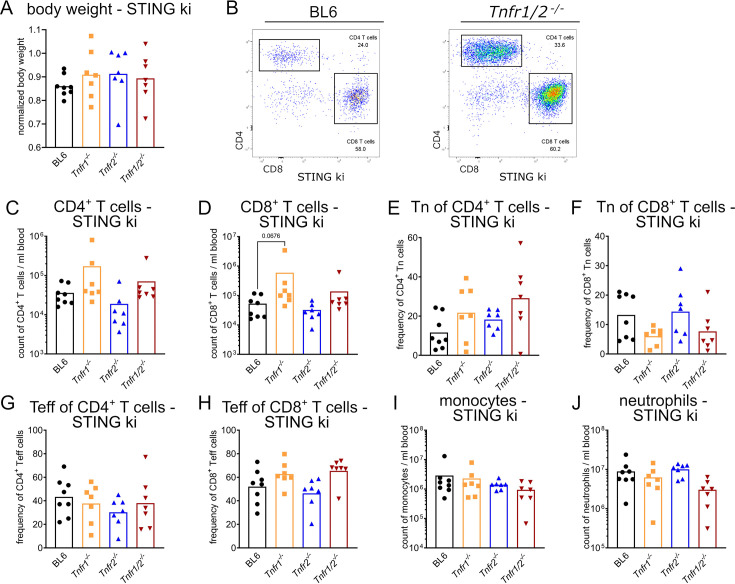
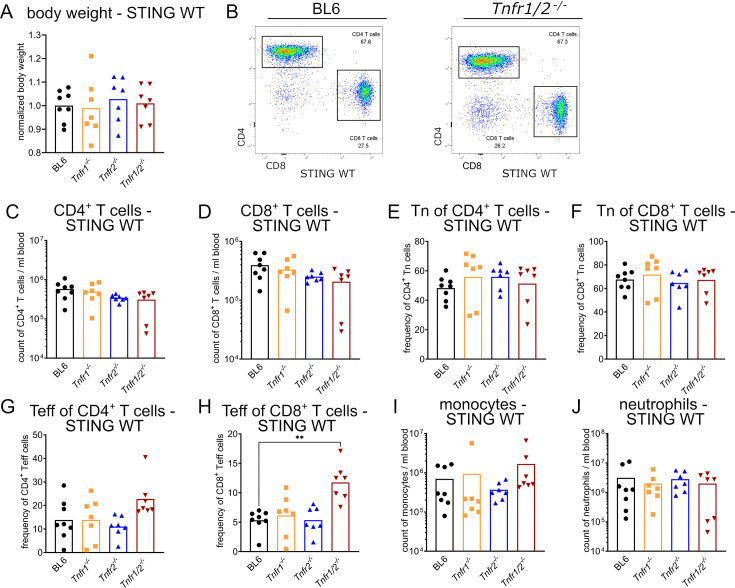
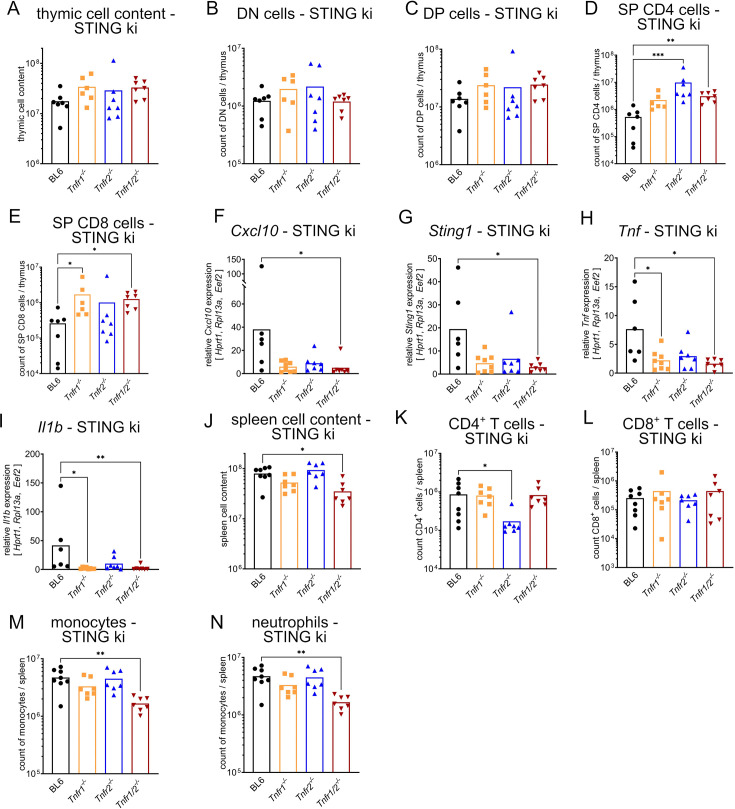
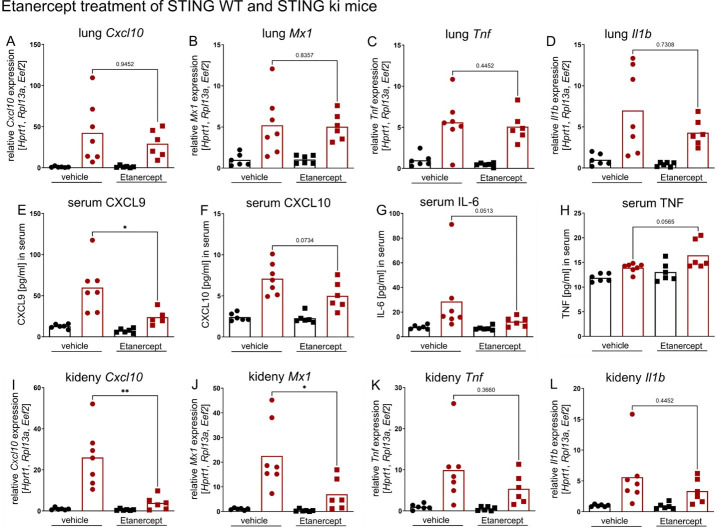
Constitutive activation of STING by gain-of-function mutations triggers manifestation of the systemic autoinflammatory disease STING-associated vasculopathy with onset in infancy (SAVI). In order to investigate the role of signaling by tumor necrosis factor (TNF) in SAVI, we used genetic inactivation of TNF receptors 1 and 2 in murine SAVI, which is characterized by T cell lymphopenia, inflammatory lung disease, and neurodegeneration. Genetic inactivation of TNFR1 and TNFR2, however, rescued the loss of thymocytes, reduced interstitial lung disease, and neurodegeneration. Furthermore, genetic inactivation of TNFR1 and TNFR2 blunted transcription of cytokines, chemokines, and adhesions proteins, which result from chronic STING activation in SAVI mice. In addition, increased transendothelial migration of neutrophils was ameliorated. Taken together, our results demonstrate a pivotal role of TNFR signaling in the pathogenesis of SAVI in mice and suggest that available TNFR antagonists could ameliorate SAVI in patients.

Keywords: SAVI; STING; TNF; immunology; inflammation; mouse; systemic autoinflammation; vasculopathy.


Conflict of interest statement

HL, FS, DG, DS, LH, ES, WT, SW, CG, AL, RB, LT, BF, AR No competing interests declared

Figures

Figure 1.
Figure 1.. Disruption of TNFR signaling did not significantly prevent T cell lymphopenia in blood of STING ki mice.
(A) Normalized body weight of 10-week-old STING ki mice, compared to body weight data from strain C57BL/6NJ (#005304, Jackson Laboratory). (B) Representative FACS plots of blood CD4+ T cells and CD8+ T cells from STING ki mice on C57BL/6 (BL6) or Tnfr1/2-/- background. (C) Numbers of blood CD4+ T cells in STING ki mice of indicated genotype. (D) Numbers of blood CD8+ T cells in STING ki mice of indicated genotype. (E) Frequency of blood naïve (Tn) CD4+ T cell population in STING ki mice of indicated genotype. (F) Frequency of blood naïve (Tn) T cells of CD8+ T cell population in STING ki mice of indicated genotype. (G) Frequency of blood effector (Teff) CD4+ T cell population in STING ki mice of indicated genotypes. (H) Frequency of blood effector (Teff) CD8+ T cell population in STING ki mice of indicated genotypes. (I) Numbers of blood monocytes in STING ki mice of indicated genotypes. (J) Numbers of blood neutrophils in STING ki mice of indicated genotypes. Markers represent individual mice, bars represent mean of n=7–8 mice per group pooled from nine independent preparations analyzed by Kruskal-Wallis test including Dunn’s multiple comparisons test.
Figure 1—figure supplement 1.
Figure 1—figure supplement 1.. Disruption of TNFR signaling did not change the T cell numbers in the blood of STING WT mice.
(A) Normalized body weight of 10-week-old STING WT mice, compared to body weight data from strain C57BL/6NJ (#005304, Jackson Laboratory). (B) Representative FACS plots of blood CD4+ T cells and CD8+ T cells from STING WT mice on C57BL/6 (BL6) or Tnfr1/2-/- background. (C) Numbers of blood CD4+ T cells in STING WT mice of indicated genotype. (D) Numbers of blood CD8+ T cells in STING WT mice of indicated genotype. (E) Frequency of blood naïve (Tn) CD4+ T cell population in STING WT mice of indicated genotype. (F) Frequency of blood naïve (Tn) T cells of CD8+ T cell population in STING WT mice of indicated genotype. (G) Frequency of blood effector (Teff) CD4+ T cell population in STING WT mice of indicated genotypes. (H) Frequency of blood effector (Teff) CD8+ T cell population in STING WT mice of indicated genotypes. The absence of TNFR1/2 led to significant increase of effector CD8+ T cell number in STING WT mice. (I) Numbers of blood monocytes in STING WT mice of indicated genotypes. (J) Numbers of blood neutrophils in STING WT mice of indicated genotypes. Markers represent individual mice, bars represent mean of n=7–8 mice per group pooled from nine independent preparations analyzed by Kruskal-Wallis test including Dunn’s multiple comparisons test.
Figure 2.
Figure 2.. Inhibition of TNFR signaling regulates frequencies and numbers of thymic and splenic cells in STING ki mice.
(A) Cellular count of all isolated cells per thymus in STING ki mice of indicated genotype. (B) Numbers of DN, (C) DP, (D) SP CD4+, and (E) SP CD8+ thymocytes per thymus in STING ki mice of indicated genotype. (F) Relative gene expression of Cxcl10, (G) Sting1, (H) Tnf, and (I) Il1b in thymus tissue from STING ki mice of indicated genotype. (J) Cellular count of all isolated cells per spleen in STING ki mice of indicated genotype. (K) Number of splenic CD4+ T cells, (L) splenic CD8+ T cells, (M) splenic monocytes, and (N) splenic neutrophils in STING ki mice of indicated genotypes. Markers represent individual mice, bars represent mean of n=7–8 mice per group pooled from nine independent preparations analyzed by Kruskal-Wallis test including Dunn’s multiple comparisons test. *p<0.05, **p<0.005, ***p<0.001.
Figure 2—figure supplement 1.
Figure 2—figure supplement 1.. Inhibition of TNFR signaling did not affect frequencies and numbers of thymic and splenic cells in STING WT mice.
(A) Cellular count of all isolated cells per thymus in STING WT mice of indicated genotype. (B) Numbers of DN, the loss of TNFR2 function in STING WT mice resulted in a reduction of DN cell number, (C) DP, (D) SP CD4+, and (E) SP CD8+ thymocytes per thymus in STING WT mice of indicated genotype. (F) Relative gene expression of Cxcl10, (G) Sting1, (H) Tnf, and (I) Il1b in thymus tissue from STING WT mice of indicated genotype. (J) Cellular count of all isolated cells per spleen in STING WT mice of indicated genotypes. (K) Number of splenic CD4+ T cells, (L) splenic CD8+ T cells, (M) splenic monocytes, and (N) splenic neutrophils in STING WT mice of indicated genotypes. Markers represent individual mice, bars represent mean of n=7–8 mice per group pooled from nine independent preparations analyzed by Kruskal-Wallis test including Dunn’s multiple comparisons test. *p<0.05.
Figure 2—figure supplement 2.
Figure 2—figure supplement 2.. Inhibition of TNFR signaling could not restore the development of lymph nodes.
(A) Representative images of blue stained popliteal lymph nodes (white arrow) and (B) iliac lymph nodes (white arrow) of STING WT and STING ki mice with indicated genotype.
Figure 3.
Figure 3.. Lack of TNFR signaling improves the number of dopaminergic neurons in the substantia nigra of STING ki mice.
(A) Representative images of TH-positive dopaminergic neurons, Iba1-positive microglia, and GFAP-positive astrocytes in the substantia nigra pars compacta (SNc, encircled area) of indicated genotypes. Scale bar represents 200 µm. (B–D) Number of Iba1-positive (B), GFAP-positive (C), TH-positive (D) cells in the SNc of the indicated genotypes expressed relative to the number of TH-positive neurons in the SNc of the corresponding mouse line without STING ki. Markers represent individual mice. Bars represent mean of all n=5–6 per group pooled from two independent preparations. Analysis by Mann-Whitney test. *p<0.05.
Figure 4.
Figure 4.. Knockout of TNFR signaling prevents manifestation of severe inflammatory lung disease in STING ki mice.
(A) Gene expression of Cxcl10, (B) Sting1, (C) Tnf, and (D) Il1b in lung tissue from STING ki mice of indicated genotype. (E) Content of CCL2 and (F) IL-6 in lung tissue extracts from STING ki mice of indicated genotype. (G) Representative H/E lung sections of 10-week-old STING WT and STING ki mice of indicated genotype. (H) Quantification of lung disease severity from STING ki mice of indicated genotypes, data were analyzed by one-way ANOVA including Dunnett’s multiple comparisons test. Markers represent individual mice, bars represent mean of n=7–8 mice per group pooled from nine independent preparations analyzed by Kruskal-Wallis test including Dunn’s multiple comparisons test. *p<0.05, **p<0.005, ****p<0.0001.
Figure 4—figure supplement 1.
Figure 4—figure supplement 1.. Knockout of TNFR signaling did not affect the content of serum chemokines and cytokines.
(A) Gene expression of Cxcl10, (B) Sting1, (C) Tnf, and (D) Il1b in lung tissue from STING WT mice of indicated genotype. (E) Content of CCL2 and (F) IL-6 in lung tissue extracts from STING WT mice of indicated genotype. (G) Quantification of lung disease severity from STING WT mice of indicated genotype. (H) Content of serum CXCL9 in STING ki mice, (I) serum CXCL9 in STING WT mice, (J) serum CXCL10 in STING ki mice, (K) serum CXCL10 in STING WT mice, (L) serum CCL2 in STING ki mice, (M) serum CCL2 in STING WT mice, (N) serum IL-6 in STING ki mice, and (O) serum IL-6 in STING WT mice of indicated genotype. Markers represent individual mice, bars represent mean of n=7–8 mice per group pooled from nine independent preparations analyzed by Kruskal-Wallis test including Dunn’s multiple comparison test.
Figure 5.
Figure 5.. TNFR signaling is required for the transcriptional upregulation of inflammatory mediators and adhesion factors in murine lung endothelial cells from STING ki mice.
Heatmap of normalized read counts for indicated transcript, summarized in specific pathways after bioinformatics analysis using DAVID (Database for Annotation, Visualization, and Integrated Discovery, LHRI). (A) Cytokine-cytokine receptor interaction. (B) Chemokine signaling pathway. (C) Cell adhesion molecules and leukocyte transendothelial migration. Remarkable genes are highlighted in bold and red letters. (D–G) Analysis of neutrophil attachment and transmigration across endothelial cell monolayers under flow. Schematic representations (left) of experimental setup, circles demonstrate neutrophils; ovals demonstrate endothelial cells, black shapes for STING WT, and red shapes for STING ki genotype. All experimental setups were performed with endothelial cell monolayer without preincubation (medium) or preincubation with TNF or LPS. Quantification of attached neutrophils (medium, TNF, LPS) and transendothelial migrated (TEM) neutrophils (after LPS preincubation = LPS-TEM). (D) Influence of STING ki endothelial cells compared to STING WT endothelial cells in attachment and transmigration of STING WT neutrophils. (E) Attachment and transmigration of STING ki neutrophils across the endothelial cell monolayer of indicated genotypes (STING WT or STING ki). (F) Influence of STING WT or STING ki neutrophils on their attachment and transmigration on STING WT endothelial cell monolayer. (G) Attachment and transmigration of STING WT or STING ki neutrophils across the STING ki endothelial cell monolayer. Markers represent separate measurements, bars represent mean of n=6–12 murine lung endothelial monolayers with five analyzed fields of view per sample analyzed by Mann-Whitney test. *p<0.05, **p<0.005, ***p<0.001, ****p<0.0001.
Author response image 1.
Author response image 1.. Etanercept treatment of STING WT (in black) and STING ki (in red) mice.
(A) Relative expression level of Cxcl10, (B) Mx1, (C) Tnf and (D) Il1b in lung tissue of Etanercept or saline treated STING WT and STING ki mice. (E) Quantification of CXCL9, (F) CXCL10, (G) IL-6 and (H) TNF in serum samples from STING WT and STING ki mice after treatment. (I) Relative expression level of Cxcl10, (J) Mx1, (K) Tnf and (L) Il1b in kidney tissue of treated mice.

Update of

  • doi: 10.1101/2024.04.25.591149

References

    1. Anastasiou M, Newton GA, Kaur K, Carrillo-Salinas FJ, Smolgovsky SA, Bayer AL, Ilyukha V, Sharma S, Poltorak A, Luscinskas FW, Alcaide P. Endothelial STING controls T cell transmigration in an IFNI-dependent manner. JCI Insight. 2021;6:e149346. doi: 10.1172/jci.insight.149346. - DOI - PMC - PubMed
    1. Atretkhany KSN, Gogoleva VS, Drutskaya MS, Nedospasov SA. Distinct modes of TNF signaling through its two receptors in health and disease. Journal of Leukocyte Biology. 2020;107:893–905. doi: 10.1002/JLB.2MR0120-510R. - DOI - PubMed
    1. Balka KR, Louis C, Saunders TL, Smith AM, Calleja DJ, D’Silva DB, Moghaddas F, Tailler M, Lawlor KE, Zhan Y, Burns CJ, Wicks IP, Miner JJ, Kile BT, Masters SL, De Nardo D. TBK1 and IKKε act redundantly to mediate STING-Induced NF-κB responses in myeloid cells. Cell Reports. 2020;31:107492. doi: 10.1016/j.celrep.2020.03.056. - DOI - PubMed
    1. Belhacéne N, Gamas P, Gonçalvès D, Jacquin M, Beneteau M, Jacquel A, Colosetti P, Ricci JE, Wakkach A, Auberger P, Marchetti S. Severe thymic atrophy in a mouse model of skin inflammation accounts for impaired TNFR1 signaling. PLOS ONE. 2012;7:e47321. doi: 10.1371/journal.pone.0047321. - DOI - PMC - PubMed
    1. Bennion BG, Ingle H, Ai TL, Miner CA, Platt DJ, Smith AM, Baldridge MT, Miner JJ. A human gain-of-function STING mutation causes immunodeficiency and gammaherpesvirus-induced pulmonary fibrosis in mice. Journal of Virology. 2019;93:e01806–e01818. doi: 10.1128/JVI.01806-18. - DOI - PMC - PubMed

MeSH terms

Substances

Associated data