. 2025 Apr 22;44(4):115435.
doi: 10.1016/j.celrep.2025.115435. Epub 2025 Mar 19.

Visual threat avoidance while host seeking by Aedes aegypti mosquitoes

Affiliations

Visual threat avoidance while host seeking by Aedes aegypti mosquitoes

Geoff T Meyerhof et al. Cell Rep. .

Abstract

The mosquito Aedes aegypti infects hundreds of millions of people annually with disease-causing viruses. When a mosquito approaches a host, the host often swats defensively. Here, we reveal the mosquito's escape behavior during host seeking in response to a threatening visual cue-a newly appearing shadow. We found that reactions to a shadow are far more aversive when it appears quickly versus slowly. Remarkably, mosquitoes evade shadows under very dim light conditions. Knockout of the TRP channel compromises the ability of mosquitoes to avoid threatening shadows, but only under high light conditions. Conversely, removing two of the five rhodopsins normally present in the compound eyes, Op1 and Op2, diminishes shadow aversion, but only under low light. Upon removal of a threatening visual cue, mosquitoes quickly re-initiate host seeking. Thus, female Aedes balance their need to host seek with visual threat avoidance by rapidly transitioning between these two behavioral states.

Keywords: Aedes aegypti; CP: Neuroscience; TRP channel; avoidance; behavior; host seeking; mosquito; opsin; rhodopsin; shadow; vision.


Conflict of interest statement

Declaration of interests The authors declare no competing interests.

Figures

Figure 1.
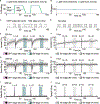
Figure 1.. Experimental setup for testing response to visual threats
(A) Profile of the setup. The cage is filmed with a webcam with an IR pass filter. Each cage contains ≥30 mosquitoes, which are attracted to the back wall owing to human odor and 37°C heat emanating from IR lights, which dissipates to 33°C at the cage surface. (B) Top view of setup without the shadow. The Arduino microcontroller receives commands from the CPU, then sends commands to the stepper motor to laterally move a light blocker along its track, which when occluding the light source, casts a shadow. (C) Top view of setup with a full shadow, when the light blocker is directly in front of the light source. (D) Sample video frame displaying mosquitoes landed on the back wall of the cage. Landing events, behavior, and takeoffs were scored using custom video tracking. (E) Mosquito track times (single recording). Most tracks are <25 s. (F) Heatmap of tracks (72 mosquito trials, each 150 s). See also Figure S1.
Figure 2.
Figure 2.. Behavioral responses to a visual threat in mosquito cages
(A and B) Shadow-movement pattern on the back wall. (A) 230 lux. (B) 0 lux. (C) Vector of shadow movement (230 lux). Rectangular OFF-edge shadow (60 cm/s) at times 30 and 90 s, and an ON-edge shadow (4 cm/s) at 60 and 120 s (D) Vector of shadow movement (0 lux). No shadow cast at 0 lux. (E) Percentage of mosquitoes landed on the back wall (230 lux). Purple shading, 60 cm/s OFF-edge shadow. Green shading, 4 cm/s ON-edge shadow. (F) Percentage of mosquitoes landed on the back wall (0 lux). Narrow gray shading, 60 cm/s movement of blocker. Wide gray shading, 4 cm/s movement of blocker. (G and H) Percentage of landed mosquitoes searching along the back wall. (G) 230 lux. (H) 0 lux. (I and J) Percentage of total takeoffs/second. (I) 230 lux. (J) 0 lux. (E, G, and I) Black traces, averages from 72 trials; gray traces, results from each individual trial. (F, H, and J) Black lines, averages from 18 trials; gray lines, results from each individual trial. Dark gray shading denotes fast light blocker movements. Light gray shading denotes slow light blocker movements. See also Figure S2
Figure 3.
Figure 3.. Behavioral transition probabilities without a shadow, and during a fast light-to-dark shadow
(A) Behavioral transition probabilities in the absence of a light-to-dark shadow (calculated over a 2-s window). (B) Behavioral transition probabilities during a light-to-dark shadow. (C) Percentage of times the mosquitoes made the transitions shown in (A). (D) Percentage of times the mosquitoes made the transitions shown in (B).
Figure 4.
Figure 4.. Fast light-to-dark shadows trigger an escape response
(A–D) (Left) Cartoons of setups for the control experiments. (Right) Distributions of spontaneous takeoffs from 20,000 random samples in each videos set (see STAR Methods). The mean spontaneous takeoff rate (x¯ TO; red) was determined via random sampling. The observed takeoff rate (obs. TO; purple) is the takeoff rate in response to the stimulus. Normalized takeoffs represent the difference between x¯ TO and obs. TO. (A) Shadow-movement experiment. (B) Flash light off. (C) No light block (LB). (D) LB apparatus moved but positioned so that no shadow is cast. (E) Normalized takeoffs from protocols depicted in (A–D). One-way ANOVA (p< 0.001) followed by Tukey’s honestly significant difference (HSD) test. (F) Effects of shadow speed and polarity on takeoffs. ON-edge shadows (blue dots), and OFF-edge shadows (orange dots). Speeds tested for ON- and OFF-edge shadows: 60, 31, and 15 cm/s. Additional speeds for OFF-edge shadows: 8 and 4 cm/s. One-way ANOVA (p < 0.001) followed by Tukey’s HSD test. (E–F) n = six cages with 30 mosquitoes/condition, each recorded three times. (G) Polar histogram displaying probability of mosquito orientation on the back cage wall. Orientations subdivided into four groups each spanning 60° to specify mosquitoes facing up, down, left, or right. Probabilities from 29,312 landing events from 36 cages of 30 mosquitoes. (H) Normalized takeoffs by mosquitoes facing up vs. down. (I) Normalized takeoffs by mosquitoes facing left versus right. (H and I), Two-tailed unpaired Student’s t tests. p > 0.05. (G–I), n = 6, each consisting of six cages of 30 mosquitoes measured three times each. (J) Heatmap displaying effects of shadow speed and light intensity on normalized takeoffs (Norm. takeoffs) for OFF-edge shadows. Columns, light intensity. Rows, shadow speed. n = 6 cages of 30 mosquitoes per condition, each recorded three times. ***p < 0.001. Means ± SEMs. See also Figure S2.
Figure 5.
Figure 5.. Males respond to visual threats by initiating takeoffs
(A) Percentages of males and females that landed on the back wall of cages laced either with human odor or 10% sucrose. The back walls were all exposed to 33°C heat from IR lights. Orange trace, females presented with human odor. Black trace, males presented with human odor. Pink trace, males presented with 10% sucrose. (B) Percentage of landed mosquitoes searching along the back wall. Orange trace, fed females. Blue trace, 16-h starved females. Pink trace, males attracted to the back wall with 10% sucrose. (C) Normalized takeoffs from fast-moving light-to-dark (OFF-edge) shadows (60 cm/s) for males (starved) in the dark (0 lux) or exposed to 230 lux, or females (fed or starved) exposed to 230 lux. One-way ANOVA (p < 0.001) with Tukey’s honestly significant difference post hoc test. n = 6 cages each measured three times. **p < 0.01. ***p < 0.001. Means ± SEMs. See also Figure S3.
Figure 6.
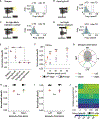
Figure 6.. Function of Ae. aegypti TRP in the light response
(A) Cartoons of trpQF2 and trpGFP. The black vertical lines represent transmembrane domains. The positions of the forward (fwd) and reverse (rev) primers used for the RT-qPCR are indicated. (B) Relative trp mRNA expression in control and trpQ/G measured by RT-qPCR. n = 3 biological replicates. (C) trp reporter expression in an ommatidium from a trpQF2>mCD8::GFP retina viewed by confocal microscopy: GFP (green), phalloidin (red). The asterisks indicate cell bodies of photoreceptor cells visualized with mCD8::GPF. The phalloidin labels the fused rhabdomeres. 13-μm-thick optical section. Scale bars, 6 μm. (D–O) ERGs in response to the indicated light intensities. The ages and genotypes of the mosquitoes are indicated. Mosquitoes were exposed to two 25-s pulses of light, separated by 5-s dark adaptation. The shading indicates means ± SEMs. n= 6–7. (D) One-day-old control. 1,000 lux. (E) One-day-old trpQ/G. 1,000 lux. (F) One-day-old control. 230 lux. (G) One-day-old trpQ/G. 230 lux. (H) Five-day-old control. 1,000 lux. (I) Five-day-old trpQ/G. 1,000 lux. (J) Five-day-old control. 230 lux. (K) One-day-old trpQ/G. 230 lux. (L) Ten-day-old control. 1,000 lux. (M) Ten-day-old trpQ/G. 1,000 lux. (N) Ten-day-old control. 230 lux. (O) Ten-day-old trpQ/G. 230 lux. (P and Q) Final ERG amplitudes from first light stimulus for the traces shown in (D–O). Two-way ANOVA with factors of age (P: p > 0.05; Q: p< 0.05), genotype (P: p < 0.001; Q: p < 0.001), and age:genotype interaction (P: p < 0.001; Q: p > 0.05). Group means compared via Tukey’s honestly significant difference test. ***p < 0.001. Means ± SEMs. See also Figure S4.
Figure 7.
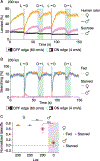
Figure 7.. TRP and opsins impact shadow detection at different light intensities
(A) Shadow-movement pattern with 30-s dark time between the OFF- and ON-edge shadows. The initiation of the first (1) and second (2) OFF-edge shadows are indicated. The first OFF-edge shadow was preceded by ≥7 min of light. The second OFF-edge shadow was preceded by 30 s in the dark and then 30 s of light (11 s of ON-edge shadow and 18 s of full light). (B) Normalized takeoffs from control and trpQ/G mosquitoes exposed to the two OFF-edge shadows indicated in (A).Three-way ANOVA with factors of genotype (p < 0.001), dark time (p < 0.05), and light intensity (p < 0.001). Group means compared by Tukey’s honestly significant difference (HSD) test. (C) One-second dark time between each of the four OFF- and ON-edge shadows. (D) Normalized takeoffs from control and trpQ/G mosquitoes under the 1-second-long dark time shadow protocol indicated in (C). Two-way ANOVA with factors of genotype (p < 0.001) and shadow-movement number (p = 0.12). Group means were compared using Tukey’s HSD test. (E) Normalized takeoffs by the indicated mosquitoes at 4–230 lux or in the dark (0 lux). Two-way ANOVA with factors of genotype (p < 0.001), lux (p < 0.001), and genotype:lux interaction (p < 0.001). n = 6 cages of 30 female mosquitoes per condition, each recorded three times. ***p < 0.001. *p < 0.05. Means ± SEMs. See also Figures S5 and S6.

References

    1. Montell C, and Zwiebel LJ (2016). Mosquito sensory systems. Adv. Insect Physiol 51, 293–328.
    1. McMeniman CJ, Corfas RA, Matthews BJ, Ritchie SA, and Vosshall LB (2014). Multimodal integration of carbon dioxide and other sensory cues drives mosquito attraction to humans. Cell 156, 1060–1071. - PMC - PubMed
    1. Chandel A, DeBeaubien NA, Ganguly A, Meyerhof GT, Krumholz AA, Liu J, Salgado VL, and Montell C (2024). Thermal infrared directs host-seeking behaviour in Aedes aegypti mosquitoes. Nature 633, 615–623. - PMC - PubMed
    1. Barredo E, and DeGennaro M (2020). Not just from blood: mosquito nutrient acquisition from nectar sources. Trends Parasitol. 36, 473–484. - PubMed
    1. Priyadarshana TS, and Slade EM (2023). A meta-analysis reveals that dragonflies and damselflies can provide effective biological control of mosquitoes. J. Anim. Ecol. 92, 1589–1600. - PubMed