. 2025 Jul 1;117(7):1438-1455.
doi: 10.1093/jnci/djaf065.

The nucleosome remodeling and deacetylase-SWItch/sucrose non-fermentable antagonism regulates the coordinated activation of epithelial-to-mesenchymal transition and inflammation in oral cancer

Affiliations

The nucleosome remodeling and deacetylase-SWItch/sucrose non-fermentable antagonism regulates the coordinated activation of epithelial-to-mesenchymal transition and inflammation in oral cancer

Roberto Stabile et al. J Natl Cancer Inst. .

Abstract

Background: Phenotypic plasticity and inflammation, 2 well-established hallmarks of cancer, play key roles in local invasion and distant metastasis by enabling the rapid adaptation of tumor cells to dynamic micro-environmental changes.

Results: Here, we show that in oral squamous carcinoma cell carcinoma (OSCC), the competition between the Nucleosome Remodeling and Deacetylase (NuRD) and SWItch/Sucrose Non-Fermentable (SWI/SNF) chromatin remodeling complexes plays a pivotal role in regulating both epithelial-mesenchymal plasticity (EMP) and inflammation. By perturbing these complexes, we demonstrated their opposing downstream effects on the inflammatory pathways and EMP regulation. In particular, downregulation of the BRG1-specific SWI/SNF complex deregulates key inflammatory genes, such as TNF-α and IL6, in opposite ways when compared with the loss of CDK2AP1, a key member of the NuRD complex. We showed that CDK2AP1 genetic ablation triggers a pro-inflammatory secretome encompassing several chemokines and cytokines, thus promoting the recruitment of monocytes into the tumor microenvironment (TME). Furthermore, CDK2AP1 deletion stimulates their differentiation into M2-like macrophages, as validated on tumor microarrays from OSCC patient-derived tumor samples. Further analysis of the inverse correlation between CDK2AP1 expression and TME immune infiltration revealed specific downstream effects on the abundance and localization of CD68+ macrophages.

Conclusions: Our study sheds light on the role of chromatin remodeling complexes in OSCC locoregional invasion and highlights the potential of CDK2AP1 and other members of NuRD and SWI/SNF chromatin remodeling complexes as prognostic markers and therapeutic targets.


Conflict of interest statement

None declared.

Figures

Figure 1.
Figure 1.
CDK2AP1 ablation in OSCC cell lines underlies epithelial to mesenchymal plasticity. A. Left panel: CDK2AP1 immunoblot analysis of our panel of OSCC parental (CA1-P and LM-P) and KO (CA1-A11 and -B3; LM-B4 and -B6) cell lines. The 12 kDa CDK2AP1 protein was observed exclusively in the parental cell lines. β-Actin (BACT) was used as the loading control. The blots shown here are representative examples of 3 independent experiments. Right panel: RT-qPCR expression analysis of the EMT transcription factor SLUG and the EMT marker fibronectin (FN1) in CDK2AP1-proficient and -deficient cell lines. Experiments were performed in triplicate, and mRNA expression was normalized to that of GAPDH. P values denote 1-way ANOVA and 1-sample t-tests against the parental cell lines (*P<.05, **P<.01, ***P<.001). B. Left panel: CDK2AP1 immunoblot analysis of CA1 and LM OSCC cell lines transduced with CDK2AP1-shRNA and induced with doxycycline (DOX) at different time points. β-Actin (BACT) was used as the loading control. The blots shown here are representative examples of 3 independent experiments. Right panel: RT-qPCR analysis of the above EMT markers in CDK2AP1-shRNA cells at the same time points evaluated in the immunoblot depicted in A. Experiments were performed in triplicate, and mRNA expression was normalized to that of GAPDH. P values denote 1-way ANOVA and 1-sample t-tests against the NO-DOX condition (*P<.05, **P<.01, ***P<.001). C. Analysis of parental and CDK2AP1-KO OSCC cell lines grown in rat-tail type I collagen medium. The top panels depict images of cells resuspended in single cells and grown in 3D collagen matrix. Images were taken after 72 h in culture to evaluate morphological differences. Higher-magnification images (20×) are shown in the top-left corner inlet. Scale bars correspond to 200 μm. The bottom panels show histological sections stained with hematoxylin and eosin (H&E) relative to the invasion assay. The cells were seeded on top of the collagen layer and allowed to grow through the matrix. The images correspond to the 5th day of culture. Scale bars correspond to 250 μm. D. Immunohistochemistry (IHC) analysis of tumors obtained by subcutaneous transplantation of either parental or KO CA1 cells in NSG-recipient mice. Apart from H&E (first column), the sections were stained with antibodies directed against human mitochondria, CDK2AP1, E-cadherin (E-Cad), and N-cadherin (N-Cad). Higher magnification images (20×) of specific tumor areas are shown in the inlets in the bottom-left corners. Lower magnification (4×) scale bars: 1 mm; higher magnification scale bars: 250 μm.
Figure 2.
Figure 2.
CDK2AP1 deletion promotes inflammation via phosphorylation of p65. A. Overrepresentation analysis (ORA) of CHIP-seq data relative to CDK2AP1-dependent NuRD peaks obtained from Modh-Sarip et al. The analysis was centered on gene promoter regions (<1 kb from the transcription start site [TSS]). Only significantly altered pathways are depicted (P < .05). B. Gene set enrichment analysis (GSEA) relative to expression profiles obtained from parental and KO CA1 and LM cells. Significantly altered pathways (NES >1 and P < .01) are shown. C. p65 immunoblot analysis in parental and CDK2AP1-KO CA1 cell lines. Both pan- and P-specific antibodies were employed to detect the abundance of the S536 (PS536-P65) phosphorylated fraction. Experiments were performed in triplicate, and β-actin (BACT) was used as a loading control. D. Representative immunofluorescence images of parental and CDK2AP1-KO CA1 cell cultures under normal conditions (Ctr/A11/B3) after treatment with 10 ng/mL TNF-α (TNFa) or with condition medium (CM) from the CDK2AP1-KO clones for 1 h. Cells were fixed with 4% paraformaldehyde and stained with antibodies against p65 (red), or phosphorylated PS536-P65 (yellow). Nuclei and actin filaments were visualized using DAPI staining and phalloidin, respectively. Scale bar: 50 µm. E. Dot plots showing quantification of the immunofluorescence data from panel D and Figure S2, E. The upper graph depicts nuclear p65 abundance, while the lower graph shows PS536-p65 levels in CDK2AP1-KO and parental cell lines. P values were calculated using the Wilcoxon test.
Figure 3.
Figure 3.
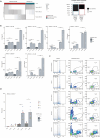
CDK2AP1 ablation results in increased immune-infiltration in vivo and PBMC chemotaxis in vitro. A. Left panel: distribution of patient-derived OSCCs based on CDK2AP1 IHC staining intensity. A pre-established 35% threshold was employed to resolve low/negative from positive tumor cells (see also Figure 3, A). For each patient, the fraction of cancer cells for each staining intensity for CDK2AP1 (S0, S1, and S2) is reported in gray scale. The tumors (n=100) were obtained from the RONCDOC patient cohort (for additional details, see Stabile et al. and the Methods section of the present study). Right panel: Stacked bar plot showing the proportion of tumor infiltration (none or partial vs. dense infiltration) across the CDK2AP1 positive/low-negative patient groups. B. Quantification of chemotaxis-relevant cyto- and chemokines by cytometric bead assay in cell culture medium (for more details, see Methods). Experiments were performed in triplicate; P values denote 1-way ANOVA and Tukey’s test against the parental cell line (*P<.05; **P<.01; ***P<.001). C. In vitro analysis of PBMC chemotaxis. The migration of PBMCs (obtained from 3 independent healthy donors) was assessed using a transwell assay (for more details, see Methods). PBMCs were allowed to migrate from the upper to the lower chamber for 3 h. The lower chamber contained one of the following media: serum-free medium, CCL19-supplemented serum-free medium (20 ng/mL); complete medium including 10% FCS, parental CA1- or LM- conditioned complete media, CDK2AP1-KO conditioned complete medium (CA1-A11 and -B3, LM-B4 and -B6). After 3 h, the migrating cells were collected from the lower transwell chamber and quantified by cytofluorimetry. Among the migrating events, lymphocytes were distinguished from monocytes based on their size. Experiments were performed in triplicate with PBMCs from 3 independent healthy donors. D. Quantification of PBMC chemotaxis assessed in vitro as described in C. P values denote 1-way ANOVA and Tukey test of the CDK2AP1-KO clones against the respective parental cell line (*P<.05; **P<.01; ***P<.001).
Figure 4.
Figure 4.
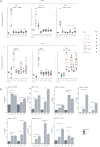
The secretome of CDK2AP1 KO cells promotes polarization of macrophages towards a M2c state. A. Expression of M1-like (CD80, HLA-DR, and PD-L1) and M2-like (CD200R, CD206, and CD163) macrophage markers after 48 h polarization with purified cytokines or with the supernatant of the parental and CDK2AP1-KO cell lines. PBMCs from 6 independent healthy donors were used (see Methods). P values denote 1-way ANOVA and Tukey’s test of the CDK2AP1-KO clones against the respective parental cell lines (*P<.05, **P<.01, ***P<.001). B. Cyto- and chemokines specific to distinct states of macrophage polarization were quantified using a cytometric bead assay in the supernatant of the culture media of the parental and CDK2AP1-KO cell lines (see Methods). Experiments were performed in triplicate; P values denote 1-way ANOVA and Tukey’s test against the parental cell line (*P<.05; **P<.01; ***P<.001).
Figure 5.
Figure 5.
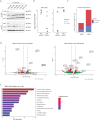
Perturbing SWI/SNF complexes influences the same genes and pathway regulated by CDK2AP1. A. BRM and BRG1 immunoblot analysis of CA1 OSCC cells transduced with BRM- or BRG1-shRNA vectors and induced by doxycycline (DOX) for up to 5 days (120 h). β-Actin (BACT) was used as the loading control. The blots shown here are representative examples of 3 independent experiments. B. RNAseq-based validation of the effects of specific BRM- and BRG1-shRNAs on the expression levels of their respective SMARCA2 (BRM) and SMARCA4 (BRG1) targets. C. Overview of differentially expressed genes upon induction with BRM- and BRG1-shRNAs in the CA1 parental cell line. Only genes with statistical significance (P adj. < 0.1 and log fold change>1.5) were up- or downregulated when compared with the uninduced cell line. D. Volcano plots relative to differentially expressed genes following BRG1 and BRM knockdown by shRNA. Downward and upregulated genes (log2 fold change> 1.5; P < .01) are shown on the left and right sides of each plot, respectively. E. Gene Ontology Pathway Analysis (GO) of the expression profiles of the CA1 parental cell line upon BRG1 knockdown (P < .01; odds ratio 2).
Figure 6.
Figure 6.
TMA multiplex IF and ISH analysis enable improved characterization and spatial distribution of specific TME markers as a function of CDK2AP1 expression. A. Representative images of TMA fields were analyzed for the presence and distribution of different immune cell markers. Next to the IF images (left column), digital reconstructions by Visiopharm and SPIAT of the tumor and stromal cells are depicted. Initial Visiopharm analysis only allowed the resolution of epithelial and stromal (green) cells. Upon SPIAT analysis, T lymphocytes, monocytes, macrophages, and M2c macrophages were resolved. CDK2AP1- refers to CDK2AP1 low/negative cores, whereas CDK2AP1+ refers to CDK2AP1 positive cores. B. Violin plots relative to the differences in tumor and stromal cells, including (M2c) macrophages, monocytes, and T lymphocytes between the tumor core and tumor margins. P values denote paired t-tests. C. Violin plot relative to the same parameters analyzed in B across CDK2AP1-high and -low/neg cores. The dotted line in the “Macrophage M2-like” graph refers to the 5% of abundance level per TMA core. P values denote paired t-tests. D. Representative IHC images of CDK2AP1 protein expression in -low/neg (top) and -positive (bottom) TMA tumor cores (left column). Differences in macrophage abundance were shown by IF analysis and SPIAT digital reconstruction. CDK2AP1- refers to CDK2AP1 low/negative cores, whereas CDK2AP1+ refers to CDK2AP1 positive cores.

References

    1. Huang C, Chen L, Savage SR, et al. ; Clinical Proteomic Tumor Analysis Consortium. Proteogenomic insights into the biology and treatment of HPV-negative head and neck squamous cell carcinoma. Cancer Cell. 2021;39:361-379.e16. - PMC - PubMed
    1. Sung H, Ferlay J, Siegel RL, et al. Global Cancer Statistics 2020: GLOBOCAN estimates of incidence and mortality worldwide for 36 cancers in 185 countries. CA Cancer J Clin. 2021;71:209-249. https://pubmed.ncbi.nlm.nih.gov/33538338/ - PubMed
    1. Lawrence MS, Sougnez C, Lichtenstein L, et al. Comprehensive genomic characterization of head and neck squamous cell carcinomas. Nature 2015;517:576-582. - PMC - PubMed
    1. Ng JH, Iyer NG, Tan MH, Edgren G. Changing epidemiology of oral squamous cell carcinoma of the tongue: a global study. Head Neck. 2017;39:297-304. https://pubmed.ncbi.nlm.nih.gov/27696557/ - PubMed
    1. Hoesseini A, van Leeuwen N, Offerman MPJ, et al. Predicting survival in head and neck cancer: external validation and update of the prognostic model OncologIQ in 2189 patients. Head Neck. 2021;43:2445-2456. https://pubmed.ncbi.nlm.nih.gov/33960553/ - PMC - PubMed

MeSH terms

Substances

Grants and funding