. 2025 Mar 21;387(6740):eado8316.
doi: 10.1126/science.ado8316. Epub 2025 Mar 21.

Synaptic architecture of a memory engram in the mouse hippocampus

Affiliations

Synaptic architecture of a memory engram in the mouse hippocampus

Marco Uytiepo et al. Science. .

Abstract

Memory engrams are formed through experience-dependent plasticity of neural circuits, but their detailed architectures remain unresolved. Using three-dimensional electron microscopy, we performed nanoscale reconstructions of the hippocampal CA3-CA1 pathway after chemogenetic labeling of cellular ensembles recruited during associative learning. Neurons with a remote history of activity coinciding with memory acquisition showed no strong preference for wiring with each other. Instead, their connectomes expanded through multisynaptic boutons independently of the coactivation state of postsynaptic partners. The rewiring of ensembles representing an initial engram was accompanied by input-specific, spatially restricted upscaling of individual synapses, as well as remodeling of mitochondria, smooth endoplasmic reticulum, and interactions with astrocytes. Our findings elucidate the physical hallmarks of long-term memory and offer a structural basis for the cellular flexibility of information coding.


Conflict of interest statement

Competing interests: The authors declare no competing interests.

Figures

Fig. 1.
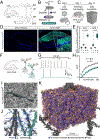
Fig. 1.. Workflow for identifying the ultrastructural hallmarks of memory engrams.
(A) Excitatory pathways in the CA1. SO - stratum oriens; SP - pyramidal cell layer; SR - stratum radiatum; SLM - stratum lacunosum moleculare; EC - entorhinal cortex; Th - thalamus. (B) Irreversible labeling of transiently activated neurons with APEX2-mGFP. (C) Overview of the experimental design. (D) Confocal images of APEX2-mGFP fluorescence in the hippocampi of fear-conditioned FosDD-Cre mice. TMP (i.p., 50 μg/g) or a vehicle solution was administered 30 minutes post-training. (E) Quantifications of reporter-positive (+) cells in areas CA1 and CA3. No CFC + vehicle, n = 4 mice; no CFC + TMP, n = 3; CFC + vehicle, n = 3; CFC+ TMP, n = 4. In this and similar panels, graphs display individual data points (open circles), mean values (filled circles), standard errors (boxes), standard deviations (vertical whiskers), and medians (horizontal lines). p values were calculated using t-tests. (F to H) Electrical properties of (–) and (+) CA1 PNs, assessed 7 days after CFC. (F) Schematic of whole-cell recordings. (G) Representative traces of evoked action potentials (APs). (H) Number of APs (Mean ± S.E.M.), plotted relative to stimulus intensity. n =3 mice/8 neurons per group. p value was determined by t-test. (I) Example of APEX2 tracing in a 2D-EM micrograph (axonal fiber marked by arrows). (J) 3D views of (–) and (+) SchC axons and dendrites (arrows) in the CA1sr of fear-conditioned mice. Only a few unlabeled projections are shown. (K) Saturated reconstruction of excitatory synapses in ~1/9th of the typical 3D stack used for analysis. See also Movie 1, figs. S1 to S7, and Data S1.
Fig. 2.
Fig. 2.. Synaptic networks of PNs in the CA3-CA1 pathway.
(A) Schematic of experience-dependent labeling and potential connectivity between (–) and (+) PNs in the CA1sr of fear-conditioned mice. (B) 3D views of dendritic branches of CA1 PNs. Enlarged images display local connectomes. Anchor points exemplify the Euclidian coordinates of spines. (C) Distributions of distances between spines (lognormal curves with fitting parameters; in this and similar panels, sample sizes (n), medians (m), standard deviations of logarithmic values (σ), and p values are indicated) and the total spine counts per dendrite length, assessed across different mice (box with data overlap plot on the right). (D) 3D views of SchC axons of (–) and (+) CA3 PNs. Magnified images display pre- and postsynaptic structures. D - dendrites. (E) Distributions of distances between terminals along individual axons and total terminal counts per fiber length. (F) Heatmaps representing the wiring of (–) and (+) axons with (–) and (+) dendrites. The color-coded boxes in vertical columns denote single spines. (G) Fractions of terminals formed on dendrites of (–) and (+) CA1 PNs. (H) Examples of synapses with morphologically distinct spines. M - mushroom; T - thin; S - stubby; F - filopodia; B - bifurcated. (I) Fractions of M- T- S- F- and B-type spines innervated by (–) and (+) axons. All quantifications are from 3 separate mice. p values were calculated using Mann-Whitney tests for distribution fits and t-tests with Welch correction for box plots. See also Movies 2 to 4, figs. S8 and S9, and Data S2.
Fig. 3.
Fig. 3.. Expansion of PN connectomes via MSBs.
(A) 3D views of MSBs of (–) and (+) SchC axons connecting to distinct dendrites (D1-D4) of CA1 PNs in fear-conditioned mice. (B to I) Long-term effects of presynaptic activity associated with CFC (n = 3 mice) or CS (n = 2). Datasets were categorized based on axonal labeling. (B) Count distributions of SSBs between MSBs (SSB gaps) and averaged fractions of MSBs relative to SSBs on each axon, as determined in individual mice. (C) Overall spine-to-terminal ratios for (–) and (+) axons. (D) Fractions of terminals contacting the indicated numbers of spines. (E) Fractions of spines contacted by MSBs. (F) Percentages of MSBs innervating different numbers of spines, ranging from 2 to 6. (G) Number of dendrites innervated by individual terminals. (H) Fractions of compound synapses. (I) Number of different dendrites innervated by MSBs (excluding compound synapses). (J and K) Analysis of MSB networks in fear-conditioned mice (n = 3). (J) Heatmaps representing axonal wiring via MSBs. Each box in the vertical columns shows the number of color-coded postsynaptic counterparts of each MSB formed by individual axons (SSBs are omitted). (K) Fractions of MSBs of (–) and (+) axons connecting to (–) and (+) dendrites. p values were calculated using t-tests with Welch correction. (L) Graphical summary of the results shown in Figs. 2 and 3. See also Movie 5, fig. S10, and Data S3.
Fig. 4.
Fig. 4.. Relationships between activity patterns and extrapolated synaptic weights.
The sizes of individual excitatory synapses were measured in the CA1sr of fear-conditioned mice (n = 3). Panels show lognormal distributions of spine head and terminal volumes with fitting parameters. Each dataset was categorized into 4 groups, as indicated in the legends. (A) Head volumes for all spines on dendrites of (–) and (+) CA1 PNs innervated by (–) and (+) SchC fibers. (B) Volumes of all axonal terminals. (C) Head volumes of spines contacted by SSBs. (D) SSB volumes. (E) Head volumes of spines contacted by MSBs. (F) MSB volumes. Volumetric measurements are displayed in nm3. p values were calculated using Kruskal-Wallis ANOVA. Detailed post-hoc statistical analyses for individual groups are available in Data S4. See also Movie 6 and fig. S11.
Fig. 5.
Fig. 5.. Structural proportionalities of MSBs.
The relationships between the sizes of core structural elements of individual MSB-type synapses were examined in the CA1sr of fear-conditioned mice (n = 3). Datasets were categorized as shown in the legends. (A to C) Correlations between the indicated parameters in synapses grouped by the activity histories of CA3 neurons. Scatter plots with confidence ellipses, sample sizes (n), Spearman correlation coefficients (rs), Fisher transformation scores (z) and p values are shown. (A) Spine head vs. terminal volumes. (B) PSD vs. terminal volumes. (C) ASI vs. terminal volumes. (D to F) The same analyzes were performed for (+) MSBs innervating (–) and (+) CA1 PNs. (G and H) Relationships between terminal volumes (G) and vesicle pool sizes (H) and the number of innervated spines (1 spine - SSB; 2 or more spines - MSB). Pearson correlation coefficients (r) are indicated for each comparison. Volumetric measurements are displayed in nm3. See also Movie 6, fig. S12, and Data S4.
Fig. 6.
Fig. 6.. Reconstructions of mitochondria and SA.
(A) 3D views of mitochondria and SER in SchC axons and their target dendrites (D1-D12) in the CA1sr. (B) Enlarged image highlighting presynaptic mitochondria and postsynaptic SA. (C to E) Analysis of mitochondria in terminals formed by (–) and (+) axons of fear-conditioned mice. (C) Distributions of mitochondrial volumes. Graphs display lognormal curves with fitting parameters. (D) Relationships between mitochondrial and terminal volumes. Scatter plots with confidence ellipses, sample sizes (n), Spearman correlation coefficients (rs), Fisher transformation scores (z) and p values are shown. (E) Pearson correlation between the volumes of presynaptic mitochondria in (+) axons and the number of innervated spines (1 spine - SSB; 2 or more spines - MSB). (F to I) Fractions of SA-positive spines innervated by (–) and (+) axons in mice subjected to CFC or CS. Pooled datasets and comparisons between individual animals are shown. (J) Fractions of SA-positive spines in synapses subdivided into 4 groups based on the activity histories of CA3 and CA1 neurons. All quantifications are from 2 mice per group. Volumetric measurements are displayed in nm3. p values were calculated using Mann-Whitney tests for distribution fits and t-tests with Welch correction for box plots. See also Movie 7, fig. S13, and Data S5.
Fig. 7.
Fig. 7.. Interfacing of synapses with astrocytes.
(A) Saturated reconstruction of astrocytic processes in the CA1sr. (B) Enlarged 3D view of astrocytes (denoted by asterisks) contacting an MSB. (C and D) Fractions of SSB- (C) and MSB-type (D) synapses with (–) and (+) terminals contacting astrocytes in mice subjected to CFC (n = 3) or CS (n = 2). (E to I) Quantifications of astrocyte/terminal interfaces (ATIs) in fear-conditioned mice (n = 3). Datasets were categorized by presynaptic label. (E and F) Distributions of ATI volumes for SSBs (E) and MSBs (F) with fitting parameters. (G and H) Spearman correlations between ATI and SSB (G) and MSB (H) terminal volumes. (I) Pearson correlations between ATI volumes and the number of innervated spines (1 spine - SSB; 2 or more spines - MSB). Volumetric measurements are displayed in nm3. p values were calculated using Mann-Whitney tests for distribution fits and t-tests with Welch correction for box plots. See also Movie 8, fig. S14, and Data S5.

Update of

References

    1. Holtmaat A, Svoboda K, Experience-dependent structural synaptic plasticity in the mammalian brain. Nat Rev Neurosci 10, 647–658 (2009). - PubMed
    1. Josselyn SA, Tonegawa S, Memory engrams: Recalling the past and imagining the future. Science 367, (2020). - PMC - PubMed
    1. Berry KP, Nedivi E, Spine Dynamics: Are They All the Same? Neuron 96, 43–55 (2017). - PMC - PubMed
    1. Caroni P, Donato F, Muller D, Structural plasticity upon learning: regulation and functions. Nat Rev Neurosci 13, 478–490 (2012). - PubMed
    1. Magee JC, Grienberger C, Synaptic Plasticity Forms and Functions. Annu Rev Neurosci 43, 95–117 (2020). - PubMed

MeSH terms

LinkOut - more resources