. 2025 May;12(18):e2412498.
doi: 10.1002/advs.202412498. Epub 2025 Mar 20.

Macrophage HM13/SPP Enhances Foamy Macrophage Formation and Atherogenesis

Affiliations

Macrophage HM13/SPP Enhances Foamy Macrophage Formation and Atherogenesis

Yu Cao et al. Adv Sci (Weinh). 2025 May.

Abstract

Aryl Hydrocarbon Receptor-Interacting Protein (AIP) reduces macrophage cholesterol-ester accumulation and may prevent atherogenic foamy macrophage formation. Analyzing AIP-associated regulatory gene networks can aid in identifying key regulatory mechanism(s) underlying foamy macrophage formation. A weighted gene co-expression network analysis on the Stockholm Atherosclerosis Gene Expression (STAGE) patient cohort identifies AIP as a negative correlate of Histocompatibility Minor 13 (HM13), which encodes the ER-associated degradation (ERAD) protein Signal Peptide Peptidase (HM13/SPP). The negative correlation between AIP and HM13/SPP on mRNA and protein levels is validated in oxLDL-stimulated macrophages and human plaque foamy macrophages. Mechanistically, AIP, via its chaperone interaction with Aryl Hydrocarbon Receptor (AHR), inhibits p38-c-JUN-mediated HM13 transactivation, thereby suppressing macrophage lipid accumulation. Myeloid HM13/SPP overexpression enhances oxLDL-induced foamy macrophage formation in vitro as well as atherogenesis and plaque foamy macrophage load in vivo, while myeloid HM13/SPP knockout produces the opposite effects. Mechanistically, myeloid HM13/SPP enhances oxLDL-induced foamy macrophage formation in vitro as well as atherogenesis and plaque foamy macrophage load in vivo via promoting ERAD-mediated proteasomal degradation of the metabolic regulator Heme Oxygenase-1 (HO-1). In conclusion, AIP downregulates macrophage HM13/SPP, a driver of oxLDL-induced lipid loading, foamy macrophage generation, and atherogenesis.

Keywords: AIP; HM13; HO‐1; SPP; atherosclerosis; foamy macrophage; macrophage.


Conflict of interest statement

The authors declare no conflict of interest.

Figures
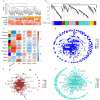
Figure 1
Figure 1
Weighted Gene Co‐Expression Network Analysis (WGCNA) Identifies Three AIP‐Associated Gene Modules in Human Atherosclerotic Plaques. a) Sample dendrogram and trait heatmap illustrating the atherosclerosis trait (“Athero trait”) variable (orange = atherosclerotic aortic root, light blue = non‐atherosclerotic IMA) and the associated normalized expression of the four atherosclerosis RGN driver genes (i.e., AIP, DRAP1, PLR2I, and PQBP1). Higher gene expression is depicted in red. b) Cluster dendrogram showing the module assignment for the ten modules. c) Heatmap indicating the positive correlations (red) and negative correlations (blue) for the atherosclerosis trait (“Athero trait”) and the four atherosclerosis RGN driver genes. d‐f) Visual representations of modular networks for the d) Blue, e) Brown, and f) Turquoise modules. The labeled genes within each module are the top‐ranking genes in terms of connectivity.
Figure 2
Figure 2
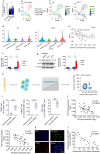
In Silico Analysis on the AIP‐Associated Gene Modules Identifies the ERAD Gene HM13. a) HM13 (log2) expression in the STAGE atherosclerotic plaque cohort (GSE40231). b–e) scRNAseq analysis of human atherosclerotic carotid plaque scRNAseq data (GSE224273). b) Uniform manifold approximation and projection (UMAP) visualization depicting the four plaque myeloid clusters. c) UMAP visualizations and d) violin plots depicting AIP and HM13 expression across the plaque myeloid clusters. e) Spearman correlation plot depicting a significant negative correlation between AIP and HM13 in foamy macrophages. f,g) Murine bone marrow‐derived macrophages (mBMDMs) were analyzed after incubation with DMSO vehicle or oxLDL (25 µg mL−1) for 24 h by f) qPCR and g) Western blotting. H–k) Coronary artery specimens from 20 human donors (n = 40 plaque samples, 20 normal samples) were digested and subjected to FACS. h) Schematic overview. i) Analyses of FACS‐sorted cell subsets. j,k) Pearson correlation analyses of AIP and HM13 gene expression in j) coronary plaque FABP5+CD45+CD68+ foamy macrophages and k) coronary plaque OPN+CD45+CD68+ foamy macrophages. l) Representative immunofluorescent images from human carotid atheromas (n = 2) displaying overlapping FABP5+ (green) and HM13/SPP+ (red) staining. Scale bar, 50 µm. m) Pearson correlation analyses of AIP and HM13/SPP protein expression in ex vivo carotid plaque foamy macrophages. a) n = 40 patients (STAGE cohort; GSE40231); b–e) n = 6 patients (GSE224273); f,g) n = 6 independent biological replicates per cohort; i–k) n = 20 independent coronary specimens, each divided into two plaque samples and one normal sample; and m) n = 8 independent carotid specimens, each divided into three ex vivo cultures. Data expressed as means ± SDs compared using a) paired Student's t‐test and f,g) one‐way ANOVA or medians ± upper/lower quartiles compared using i) Wilcoxon signed‐rank test. * p < 0.05, ** p < 0.01.
Figure 3
Figure 3
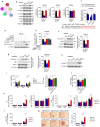
AIP's Interaction with AHR Inhibits p38‐c‐JUN‐Mediated HM13 Transactivation, Suppressing Macrophage Lipid Accumulation. a) Cytoscape schematic of STRING protein‐protein interaction (PPI) analysis (high confidence = 0.700) showing direct PPIs between AIP, AHR, and other chaperone proteins. Pink edges indicate experimental evidence. b) Western blotting analyses of p38 phosphorylation, c‐JUN phosphorylation, and JNK phosphorylation in human monocyte‐derived macrophages (hMDMs) without or with lentiviral overexpression of WT AIP (AIP‐WT) or an AIP carboxy‐terminus deletion mutant (AIPΔCT). c) Dual‐luciferase reporter assay confirming the functionality of the conserved c‐JUN binding site within the human HM13 promoter using the WT or mutant (MUT) c‐JUN binding site sequence (depicted in red). d) Western blotting analyses confirming lentiviral overexpression of constitutively‐active p38αD176A/F327S or constitutively‐active c‐JUNS63/73D and e) qPCR analysis of Hm13 expression in hMDMs. f,g) Western blotting analyses in hMDMs and murine bone marrow‐derived macrophages (mBMDMs) without or with lentiviral overexpression of WT AIP (AIP‐WT) or an AIP carboxy‐terminus deletion mutant (AIPΔCT). h) Western blotting analyses confirming lentiviral overexpression of Hm13 in mBMDMs. i,j) mBMDMs without or with lentiviral overexpression of AIP‐WT, AIPΔCT, and/or Hm13 were analyzed after incubation with DMSO vehicle or oxLDL (25 µg/ml) for 24 h. Intracellular content of i) total cholesterol (TC), unesterified free cholesterol (FC), cholesteryl esters (CE) as well as j) triglycerides. k–m) Hm13 fl/fl, Hm13 mKO, and Hm13 mOE mBMDMs were analyzed after incubation with DMSO vehicle, nLDL (25 µg/ml), or oxLDL (25 µg/ml) for 24 h. Intracellular content of k) total cholesterol (TC), unesterified free cholesterol (FC), cholesteryl esters (CE), and l) triglycerides. m) Representative images and quantitation of Oil Red O‐staining in Hm13 fl/fl, Hm13 mKO, and Hm13 mOE mBMDMs (scale bar, 50 µm). n = 6 independent biological replicates per cohort. Data expressed as means ± SDs compared using b, e–j) one‐way ANOVA and c, k–m) two‐way ANOVA. * p < 0.05, ** p < 0.01.
Figure 4
Figure 4
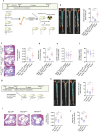
Myeloid HM13/SPP Increases Atherosclerotic Burden in Two Murine Models of Atherosclerosis. a) Schematic of the bone marrow transplant experiments depicted in panels b–f. Bone marrow was extracted from ApoE −/− Hm13 fl/fl, ApoE −/− Hm13 mKO, or ApoE −/− Hm13 mOE mice and then transplanted into ApoE −/− recipients to form chimeras. b) Representative images of Oil Red O‐stained aortas (week 19) from specified chimeras. Lesion area data is expressed as a % of the total surface area of the aorta. c) Representative images and quantified areas of aortic sinus lesions. d) Necrotic core sizes, e) VSMC (α‐SMA+) cell content, and f) collagen content (Martius Scarlet Blue) in aortic sinus samples. g) Schematic of the rAAV8‐Pcsk9 mouse model experiments depicted in panels h–j. h) Representative images of oil‐red O‐stained aortas. Lesion area data is expressed as a % of the total surface area of the aorta. i) Representative images and quantified areas of aortic sinus lesions. j) Necrotic core sizes in aortic sinus samples. n = 12 mice per cohort. Data expressed as medians ± upper/lower quartiles compared using the Kruskal–Wallis test. * p < 0.05, ** p < 0.01.
Figure 5
Figure 5
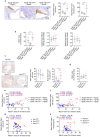
Myeloid HM13/SPP Enhances Foamy Macrophage Accumulation in Atherosclerotic Plaques. a) Representative images of ApoE −/− chimera aortic sinus lesions stained with an anti‐Mac3 antibody (brown). Note the presence of foamy macrophages within the plaque region. Scale bar, 50 µm. Quantification of relative Mac3+ foamy macrophage numbers and sizes in ApoE −/− chimera aortic sinus lesions. b) ApoE −/− chimera aortic sinus lesions were stained with antibodies against Mac3, Nos2 (M1 marker), and Arg1 (M2 marker) for relative quantification. c,d) Representative images of aortic sinus lesions (scale bar, 20 µm) from rAAV8‐Pcsk9 model mice stained with Elastic van Gieson and an anti‐Mac3 antibody (brown). Quantification of c relative Mac3+ foamy macrophage numbers and sizes as well as d Mac3 staining in aortic sinus lesions. e–h) In e, f) ApoE −/− chimera aortic sinus lesions and g,h) rAAV8‐Pcsk9 model aortic sinus lesions, Pearson correlations between Mac3 staining (x‐axis) and e,g) foamy macrophage counts (y‐axis) and f,h) mean foamy macrophage size (y‐axis). Mac3 staining is expressed as a % of the total area of the aortic sinus lesion. n = 12 mice per cohort. Data expressed as medians ± upper/lower quartiles compared using a–d) Kruskal–Wallis test. * p < 0.05, ** p < 0.01.
Figure 6
Figure 6
Macrophage HM13/SPP Cleaves the Metabolic Regulator HO‐1, Thereby Promoting HO‐1 Proteasomal Degradation. a) Cytoscape schematic of STRING protein‐protein interaction (PPI) analysis (high confidence = 0.700) showing direct PPIs between the ERAD complex proteins and HO‐1 (HMOX1). Blue edges indicate database evidence. b) Following 24 h hemin (50 µM) stimulation, membrane fraction inputs from transduced THP‐1 cells were immunoprecipitated with an anti‐HA antibody (IP:HA) and then subjected to immunoblotting analysis. c, d) Western blotting analysis of HO‐1 in c) Hm13 fl/fl, Hm13 mKO, and Hm13 mOE murine bone marrow‐derived macrophages (mBMDMs) and d) HM13/SPP inhibitor‐treated human monocyte‐derived macrophages (hMDMs) following oxLDL (25 µg/ml) or hemin (50 µM) stimulation for 24 h. e) Pulse‐chase analysis of HO‐1 cleavage in transduced THP‐1 cells by HO‐1 immunoprecipitation with an anti‐FLAG antibody (IP:FLAG) at 0 and 2 h followed by SDS‐PAGE autoradiography. f, g) Cycloheximide (CHX, 2 µg/mL) chase studies in f Hm13 fl/fl, Hm13 mKO, and Hm13 mOE mBMDMs and g) HM13/SPP inhibitor‐treated hMDMs following 24 h hemin (50 µM) stimulation. h) Western blotting analysis of HO‐1 in Hm13 fl/fl and Hm13 mOE mBMDMs pretreated with vehicle, epoxomicin (1 µM), or chloroquine (50 µM). n = 6 independent biological replicates per cohort. i) Pulse‐chase analysis of HO‐1 cleavage as performed in panel e without or with epoxomicin (1 µM). At 0 h and 1 h, post‐nuclear lysates were separated into membrane (Mem) fractions and cytosolic (Cyto) fractions prior to FLAG immunoprecipitation and SDS‐PAGE autoradiography. Data expressed as means ± SDs compared using c, d, h) one‐way ANOVA and f, g) two‐way ANOVA. * p < 0.05, ** p < 0.01.
Figure 7
Figure 7
Macrophage HM13/SPP Enhances Foamy Macrophage Formation and Atherosclerosis Through HO‐1 Degradation. a, b) Hm13 fl/fl, Hm13 mKO, Hm13 mOE, and Hm13 mOE; Hmox1 mOE murine bone marrow‐derived macrophages (mBMDMs) were subjected to the following experiments after incubation with oxLDL (25 µg/ml) without or with ZnPP (10 µM) for 24 h. a, b) Western blotting analyses of a) the heme oxygenases HO‐1 and HO‐2 as well as b) the cholesterol transporters ABCA1, ABCG1, and SR‐AI. c) Membrane‐fraction ELISA of ABCA1, ABCG1, SR‐AI, and the membrane control protein Na+/K+‐ATPase α1. d, e) Intracellular content of d) total cholesterol (TC), unesterified free cholesterol (FC), and cholesteryl esters (CE) and e) triglycerides in mBMDMs after incubation with DMSO vehicle or oxLDL (25 µg/ml) for 24 h. f–j) Aortic sinus lesions were isolated from ApoE −/− Hm13 fl/flApoE −/−, ApoE −/− Hm13 mOEApoE −/−, and Hm13 mOE;Hmox1 mOEApoE −/− mice. f) Representative immunofluorescent images of ApoE −/− chimera aortic sinus lesions stained with an anti‐HO‐1 antibody (green) and anti‐Mac3 antibody (red) (scale bar, 25 µm) and quantification of HO‐1+/Mac3+ staining (yellow). g) Representative images of Oil Red O‐stained aortas (week 19) from specified chimeras. Lesion area data is expressed as a % of the total surface area of the aorta. h) Representative images and quantified areas of lesion sizes and i) necrotic core sizes in aortic sinus samples. j) Representative images of ApoE −/− chimera aortic sinus lesions stained with an anti‐Mac3 antibody (brown). Scale bar, 50 µm. Quantification of relative Mac3+ foamy macrophage numbers and sizes in ApoE −/− chimera aortic sinus lesions. k) ELISA and Pearson correlation analyses of AIP and HM13/SPP protein expression in ex vivo carotid plaque foamy macrophages. Data expressed as means ± SDs for a‐e) one‐way ANOVA and medians ± upper/lower quartiles compared using f–j) Kruskal–Wallis test. * p < 0.05, ** p < 0.01.

References

    1. Mensah G. A., Moran A. E., Roth G. A., Narula J., Glob. Heart 2014, 9, 183. - PubMed
    1. Maguire E. M., Pearce S. W., Xiao Q., Vasc. Pharmacol. 2019, 112, 54. - PubMed
    1. Talukdar H. A., Asl H. F., Jain R. K., Ermel R., Ruusalepp A., Franzén O., Kidd B. A., Readhead B., Giannarelli C., Kovacic J. C., Cell systems 2016, 2, 196. - PMC - PubMed
    1. Hägg S., Skogsberg J., Lundström J., Noori P., Nilsson R., Zhong H., Maleki S., Shang M.‐M., Brinne B., Bradshaw M., PLoS Genet. 2009, 5, e1000754. - PMC - PubMed
    1. Chen C. y., Malchus N. S., Hehn B., Stelzer W., Avci D., Langosch D., Lemberg M. K., EMBO J. 2014, 33, 2492. - PMC - PubMed

Substances

LinkOut - more resources