Selection of Plasmodium falciparum kelch13 mutations in Uganda in comparison with southeast Asia: a modelling study
- PMID: 40112841
- PMCID: PMC12128186
- DOI: 10.1016/j.lanmic.2024.101027
Selection of Plasmodium falciparum kelch13 mutations in Uganda in comparison with southeast Asia: a modelling study
Abstract
Background: Artemisinin partial resistance, mediated by mutations in the Plasmodium falciparum kelch13 gene (k13), rapidly spread in southeast Asia, undermining the antimalarial effectiveness of artemisinin-based combination therapies. k13 mutations have also arisen in Africa, but their rates of increase are not well characterised. We aimed to quantify the selection of k13 mutations in Africa and compare the selection with that in southeast Asia.
Methods: In this modelling study, we investigated k13 mutation allele frequency at 16 sites in Uganda (2016-22) and five sites in southeast Asia (in Cambodia, Thailand, and Viet Nam; 2003-14). The Ugandan data were obtained from annual clinical surveillance studies and the southeast Asian data were obtained from the MalariaGEN Pf7 dataset. We investigated five validated and candidate k13 mutations: Pro441Leu, Cys469Phe, Cys469Tyr, Arg561His, and Ala675Val. We calculated annual selection coefficients using Bayesian mixed-effect linear models. We then tested whether the k13 mutation allele frequency in southeast Asia could have been forecast accurately using up to the first 5 years of available data and forecast future k13 mutation allele frequency in Uganda.
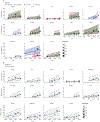
Findings: We used data from 7564 samples from Uganda and 6568 samples from southeast Asia. The annual selection coefficient of evaluable k13 mutations (Pro441Leu, Cys469Phe/Tyr, Arg561His, and Ala675Val) across all sites was estimated at 0·381 (95% credible interval 0·298 to 0·472) per year, a 38% increase in relative allele frequency. Selection coefficients across Uganda were 0·494 (-0·462 to 1·410) for Pro441Leu, 0·324 (-0·629 to 1·150) for Cys469Phe, 0·383 (0·207 to 0·591) for Cys469Tyr, and 0·237 (0·087 to 0·403) for Ala675Val. In southeast Asia, the selection coefficients were 0·627 (-0·088 to 1·312) for Cys580Tyr, 0·224 (-0·903 to 1·397) for Arg539Thr, and 0·330 (-0·075 to 0·683) for all validated k13 mutations. Compared with out-of-sample data, the forecasts for southeast Asia underestimated mutation allele frequency and were of variable accuracy. Overall, forecast allele frequencies for Uganda, assuming constant selection, neared fixation (>0·95 allele frequency) within a decade (between 2031 and 2033) for combined k13 mutations.
Interpretation: k13 mutation selection in Uganda was similar to that observed in southeast Asia, suggesting that frequencies of k13 mutations will continue to increase quickly in Uganda. These commensurate levels of selection indicate a high potential for rapid transmission across other parts of Africa, underscoring the urgent need for treatments and policies to mitigate the spread and impact of k13 mutations.
Funding: US National Institutes of Health.
Copyright © 2024 The Author(s). Published by Elsevier Ltd.. All rights reserved.
Conflict of interest statement
Declaration of interests We declare no competing interests.
Figures


Update of
-
Selection of artemisinin partial resistance Kelch13 mutations in Uganda in 2016-22 was at a rate comparable to that seen previously in South-East Asia.medRxiv [Preprint]. 2024 Feb 4:2024.02.03.24302209. doi: 10.1101/2024.02.03.24302209. medRxiv. 2024. Update in: Lancet Microbe. 2025 May;6(5):101027. doi: 10.1016/j.lanmic.2024.101027. PMID: 38352505 Free PMC article. Updated. Preprint.
References
Publication types
MeSH terms
Substances
Grants and funding
LinkOut - more resources
Full Text Sources
Research Materials

