. 2025 Mar 18;101(4):fiaf028.
doi: 10.1093/femsec/fiaf028.

Assessing the potential for non-digestible carbohydrates toward mitigating adverse effects of antibiotics on microbiota composition and activity in an in vitro colon model of the weaning infant

Affiliations

Assessing the potential for non-digestible carbohydrates toward mitigating adverse effects of antibiotics on microbiota composition and activity in an in vitro colon model of the weaning infant

Martha F Endika et al. FEMS Microbiol Ecol. .

Abstract

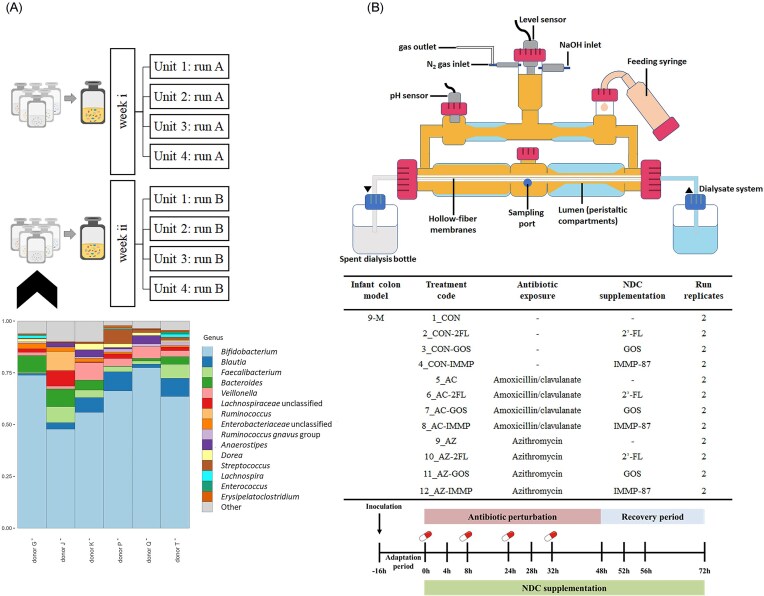
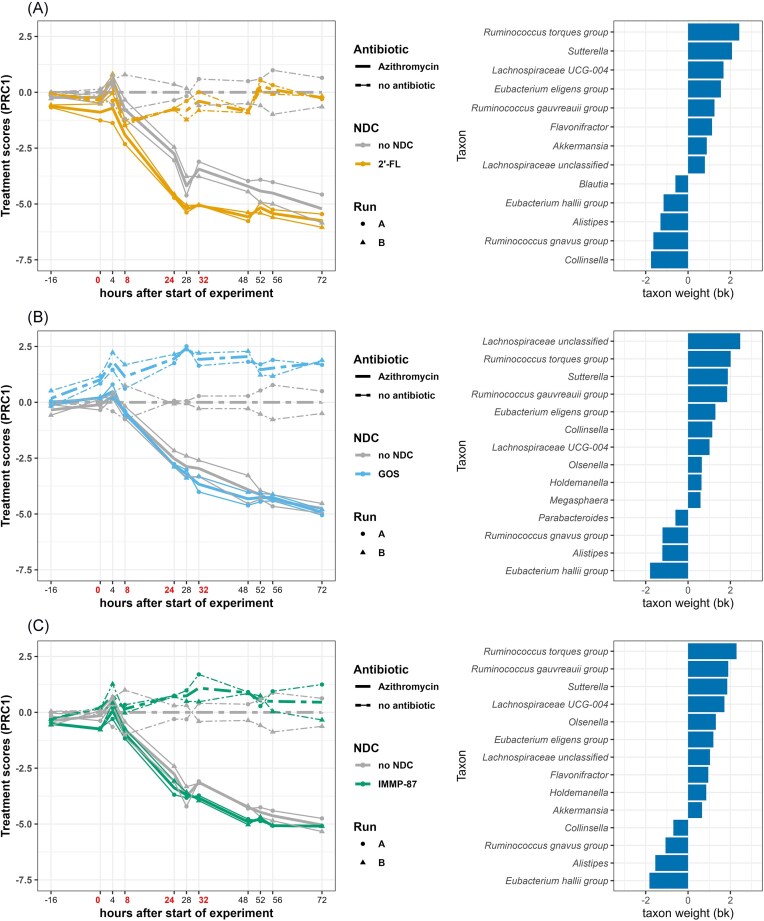
Environmental factors like diet and antibiotics modulate the gut microbiota in early life. During weaning, gut microbiota progressively diversifies through exposure to non-digestible carbohydrates (NDCs) from diet, while antibiotic perturbations might disrupt this process. Supplementing an infant's diet with prebiotic NDCs may mitigate the adverse effects of antibiotics on gut microbiota development. This study evaluated the influence of supplementation with 2-fucosyllactose (2'-FL), galacto-oligosaccharides (GOS), or isomalto/malto-polysaccharides containing 87% of α(1→6) linkages (IMMP-87), on the recovery of antibiotic-perturbed microbiota. The TIM-2 in vitro colon model inoculated with fecal microbiota of 9-month-old infants was used to simulate the colon of weaning infants exposed to the antibiotics amoxicillin/clavulanate or azithromycin. Both antibiotics induced changes in microbiota composition, with no signs of recovery in azithromycin-treated microbiota within 72 h. Moreover, antibiotic exposure affected microbiota activity, indicated by a low valerate production, and azithromycin treatment was associated with increased succinate production. The IMMP-87 supplementation promoted the compositional recovery of amoxicillin/clavulanate-perturbed microbiota, associated with the recovery of Ruminococcus, Ruminococcus gauvreauii group, and Holdemanella. NDC supplementation did not influence compositional recovery of azithromycin-treated microbiota. Irrespective of antibiotic exposure, supplementation with 2'-FL, GOS, or IMMP-87 enhanced microbiota activity by increasing short-chain fatty acids production (acetate, propionate, and butyrate).

Keywords: 2′-FL; GOS; IMMP; amoxicillin/clavulanate; azithromycin; gut bacteria.


Conflict of interest statement

A.N. is employed by FrieslandCampina and H.L. is employed by Avebe. The remaining authors declare no competing interests.

Figures

Figure 1.
Figure 1.
Microbiota composition of individual fecal samples used in pooled inocula (a) and schematic overview of the experimental setup and sampling scheme of the in vitro TIM-2 colon model (b). Top 15 genera are shown and other genera are grouped as “Other”. The different donor codes correspond to the six different infant donors whose fecal samples were used in this study. Lumen compartment samples were taken from the sampling port and the dialysis liquid samples were collected from the spent dialysis bottle. A control run without antibiotic and without NDC supplementation was also included as a reference. Each treatment was run in duplicate (run A and B). Four units of TIM-2 were run in parallel.
Figure 2.
Figure 2.
Microbiota composition of each treatment in TIM-2 showing bacterial abundance of the 30 most abundant genera. Samples were grouped by the antibiotic exposure and NDC supplementation. Each treatment was performed in duplicate (runs A and B). Samples were sorted by time, within each treatment group. Antibiotics were added at time points 0, 8, 24, and 32 h (indicated by red annotations under Pulse), immediately after sampling.
Figure 3.
Figure 3.
Top 30 most abundant genera and their associations with exposure to amoxicillin/clavulanate (a) and azithromycin (b). Results of simple linear regression models of log2-transformed absolute abundances per time point, per taxon, are visualized in the heatmap. Open circles indicate statistically significant associations (P < 0.05). The color of each tile represents the coefficient for the association between each genus and antibiotic.
Figure 4.
Figure 4.
Antibiotic effect on microbial alpha diversity as measured by Faith’s phylogenetic diversity (a) and effective Shannon at genus level (b). Mean values ± SEM are shown. Antibiotics were added at time points 0, 8, 24, and 32 h, immediately after sampling (indicated by red color). Two-sample t-tests were used to compare the alpha diversity metrics with and without antibiotic per time point (*P < 0.05 and **P < 0.01 indicates significant differences).
Figure 5.
Figure 5.
PRC summarizing differences in microbiota composition between antibiotic unexposed and those exposed to amoxicillin/clavulanate, in the colon model supplemented with 2′-FL (a), GOS (b), or IMMP-87 (c). Only the second axis (PRC2) of the PRC models is displayed, accounting for 20% (a), 22% (b), and 22% (c) of the variance in microbiota composition associated with treatment. The analysis was performed on log2-transformed absolute abundances of genera and the PRC scores measure fold-changes. The affinity of a taxon to the PRC2 diagram is shown as taxon weights and taxa with absolute weight above 0.5 are displayed. Antibiotics were added at time points 0, 8, 24, and 32 h, immediately after sampling (indicated by red colored text).
Figure 6.
Figure 6.
PRC summarizing differences in microbiota composition between antibiotic unexposed treatments and those exposed to azithromycin, in the colon model supplemented with 2′-FL (a), GOS (b), or IMMP-87 (c). Only the first axis (PRC1) of PRC model is displayed, accounting for 19% (a), 21% (b), and 24% (c) of the variance in microbiota composition associated with treatment. The analysis was performed on log2-transformed absolute abundances of genera and the PRC scores measure fold-changes. The affinity of a taxon to the PRC1 diagram is shown as taxon weights and taxa with absolute weight above than 0.5 are displayed. Antibiotics were added at time points 0, 8, 24, and 32 h, immediately after sampling (indicated by red colored text).
Figure 7.
Figure 7.
Metabolite production over time in the colon models exposed to amoxicillin/clavulanate and different NDCs. The cumulative production of butyrate, propionate, acetate, and ammonia, along with luminal measurements of succinate, valerate, iso-butyrate, and iso-valerate, are presented. Different scales are used for different metabolites as indicated at the y-axes. Antibiotic pulses are indicated by red colored text at time point 0, 8, 24, 32 h. Two-sample t-tests were used for comparing the means and significant differences are indicated by *P < 0.05 and **P < 0.01.
Figure 8.
Figure 8.
Metabolite production over time in the colon models exposed to azithromycin and different NDCs. The cumulative production of butyrate, propionate, acetate, and ammonia, along with luminal measurements of succinate, valerate, iso-butyrate, and iso-valerate, are presented. Different scales are used for different metabolites as indicated at the y-axes. Antibiotic pulses are indicated by red colored text at time point 0, 8, 24, 32 h. Two-sample t-tests were used for comparing the means and significant differences are indicated by *P < 0.05 and **P < 0.01.

References

    1. An R, Wilms E, Logtenberg MJ et al. In vitro metabolic capacity of carbohydrate degradation by intestinal microbiota of adults and pre-frail elderly. ISME Commun. 2021;1:61. - PMC - PubMed
    1. Apprill A, McNally S, Parsons R et al. Minor revision to V4 region SSU rRNA 806R gene primer greatly increases detection of SAR11 bacterioplankton. Aquat Microb Ecol. 2015;75:129–37.
    1. Barnett DJ, Arts IC, Penders J. microViz: an R package for microbiome data visualization and statistics. J Open Source Softw. 2021;6:3201.
    1. Bottery MJ, Pitchford JW, Friman V-P. Ecology and evolution of antimicrobial resistance in bacterial communities. ISME J. 2021;15:939–48. - PMC - PubMed
    1. Bower CE, Holm-Hansen T. A salicylate–hypochlorite method for determining ammonia in seawater. Can J Fish Aquat. 1980;37:794–8.

MeSH terms