. 2025 Apr 14;35(4):810-823.
doi: 10.1101/gr.279491.124.

Optical genome mapping enables accurate testing of large repeat expansions

Affiliations

Optical genome mapping enables accurate testing of large repeat expansions

Bart van der Sanden et al. Genome Res. .

Abstract

Short tandem repeats (STRs) are common variations in human genomes that frequently expand or contract, causing genetic disorders, mainly when expanded. Traditional diagnostic methods for identifying these expansions, such as repeat-primed PCR and Southern blotting, are often labor-intensive, locus-specific, and are unable to precisely determine long repeat expansions. Sequencing-based methods, although capable of genome-wide detection, are limited by inaccuracy (short-read technologies) and high associated costs (long-read technologies). This study evaluated optical genome mapping (OGM) as an efficient, accurate approach for measuring STR lengths and assessing somatic stability in 85 samples with known pathogenic repeat expansions in DMPK, CNBP, and RFC1, causing myotonic dystrophy types 1 and 2 and cerebellar ataxia, neuropathy, and vestibular areflexia syndrome (CANVAS), respectively. Three workflows-manual de novo assembly, local guided assembly (local-GA), and a molecule distance script-were applied, of which the latter two were developed as part of this study to assess the repeat sizes and somatic repeat stability. OGM successfully identified 84/85 (98.8%) of the pathogenic expansions, distinguishing between wild-type and expanded alleles or between two expanded alleles in recessive cases, with greater accuracy than standard of care (SOC) for long repeats and no apparent upper size limit. Notably, OGM detected somatic instability in a subset of DMPK, CNBP, and RFC1 samples. These findings suggest OGM could advance diagnostic accuracy for large repeat expansions, providing a more comprehensive genome-wide assay for repeat expansion disorders by measuring exact repeat lengths and somatic instability across multiple loci simultaneously.


Figures

Figure 1.
Figure 1.
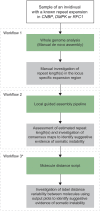
Total overview of the data analysis workflow. For each sample, a de novo assembly was generated and the local-GA pipeline and molecule distance script were run. After each workflow, the maps and/or molecules to calculate workflow-specific repeat lengths were manually assessed. Green boxes denote the data analysis parts and gray boxes denote the data interpretation parts. (*) Workflows 1 and 2 were used to determine repeat lengths, while workflow 3 was used to identify potential somatic instability.
Figure 2.
Figure 2.
Correlation between the manual de novo assembly repeat lengths and the local-GA repeat lengths. For this correlation assessment, we only used the 77/85 (90.6%) samples for which both the manual de novo assembly workflow and the local-GA workflow detected a repeat expansion. The black line represents the trendline showing the correlation between manual de novo assembly and local-GA. The dashed gray line represents the optimal correlation line.
Figure 3.
Figure 3.
Overview of the data analysis outputs of the three OGM repeat expansion workflows for sample DMPK_10.This figure only shows the visual results of the data analysis. The results of the data interpretation are mainly the estimates of the actual repeat sizes resulting from the manual de novo assembly and local-GA workflows, as well as the visualization of the label distances in each molecule covering the locus of interest resulting from the molecule distance script. (A) Representation of the repeat expansion locus in the de novo assembly showing the position of the repeat expansion in the gene (3′ UTR). Labels of interest are indicated by red arrowheads. These labels were used to manually calculate the repeat size by subtracting the reference distance (green bar) from the distances of the respective sample maps (blue bars). (B) Consensus-guided assemblies across the DMPK repeat expansion locus. The DMPK gene is indicated by the red box. Based on the estimated repeat length, each map is assigned to allele 1 or allele 2 in order to separate the two alleles. Final repeat sizes are calculated by combining the repeat sizes of the maps assigned to the same allele (see also Methods). (C) This bar plot shows the distance between the labels of interest in each molecule ordered from smallest to largest. (D) This histogram shows the result of the molecule distance script that automatically assigns molecules to one of the alleles. The blue peak represents allele 1, while the orange peak represents allele 2. Both the bar plot and histogram can then be used to assess whether a sample contains evidence for somatic instability or not.
Figure 4.
Figure 4.
Representative plots of a sample with evidence and without evidence of somatic instability. The left part represents a stable RFC1 repeat expansion and the right part represents an unstable CNBP repeat expansion. (A) The number of assembled maps at the region of interest in the local-GA data might indicate somatic instability. In this case, the stable repeat had two consensus maps while the unstable repeat had six consensus maps. (B) A gradient of label distance in the molecule pile-up might also indicate mosaicism. The stable repeat had no gradient, while the unstable repeat presented a gradient of label distances based on the large variability in the distance between the red label and black label in each molecule. This variability results in the gradient or “stairway” pattern. (C) The molecule distance script output plots show the repeat expansion size that is detected in each molecule by determining the distance between two specific labels of interest. This bar plot represents the distance between the labels of interest in each molecule ordered from smallest to largest. Molecule distance bar plots with a steep gradient or a stairway distribution of label distances would suggest somatic instability. The stable repeat had no stairway pattern, while the unstable repeat showed a stairway pattern for the expanded allele. The plot for the stable repeat visualizes the separation of the smaller allele and the larger allele around the middle of the plot (molecule number 57). The plot for the unstable repeat visualizes the same separation of the smaller allele and the larger allele (around molecule number 75). (D) The histogram plots outputted by the molecule distance script represent the separation of the two alleles based on the label distances in each molecule. The smaller alleles are indicated with blue peaks and the larger alleles are indicated with orange peaks. A “smear” instead of a real peak in the histogram for one of the alleles might indicate somatic instability. For the stable repeat, no smear was detected, while the unstable repeat presented with a “smear” for the expanded allele. This is due to large variability in molecule label distances and therefore repeat expansion size.

References

    1. Alfano M, De Antoni L, Centofanti F, Visconti VV, Maestri S, Degli Esposti C, Massa R, D'Apice MR, Novelli G, Delledonne M, et al. 2022. Characterization of full-length CNBP expanded alleles in myotonic dystrophy type 2 patients by Cas9-mediated enrichment and nanopore sequencing. Elife 11: e80229. 10.7554/eLife.80229 - DOI - PMC - PubMed
    1. Barseghyan H, Pang AWC, Zhang Y, Sahajpal NS, Delpu Y, Lai C-YJ, Lee J, Tessereau C, Oldakowski M, Kolhe RB, et al. 2022. Neurogenetic variant analysis by optical genome mapping for structural variation detection-balanced genomic rearrangements, copy number variants, and repeat expansions/contractions. In Genomic structural variants in nervous system disorders (ed. Proukakis C), pp. 155–172. Springer, New York.
    1. Chiu R, Rajan-Babu IS, Friedman JM, Birol I. 2021. Straglr: discovering and genotyping tandem repeat expansions using whole genome long-read sequences. Genome Biol 22: 224. 10.1186/s13059-021-02447-3 - DOI - PMC - PubMed
    1. Cumming SA, Hamilton MJ, Robb Y, Gregory H, McWilliam C, Cooper A, Adam B, McGhie J, Hamilton G, Herzyk P, et al. 2018. De novo repeat interruptions are associated with reduced somatic instability and mild or absent clinical features in myotonic dystrophy type 1. Eur J Hum Genet 26: 1635–1647. 10.1038/s41431-018-0156-9 - DOI - PMC - PubMed
    1. Currò R, Dominik N, Facchini S, Vegezzi E, Sullivan R, Galassi Deforie V, Fernández-Eulate G, Traschütz A, Rossi S, Garibaldi M, et al. 2024. Role of the repeat expansion size in predicting age of onset and severity in RFC1 disease. Brain 147: 1887–1898. 10.1093/brain/awad436 - DOI - PMC - PubMed

LinkOut - more resources