. 2025 Apr;22(3):e00571.
doi: 10.1016/j.neurot.2025.e00571. Epub 2025 Mar 19.

Modulation of ZnT-1 by Let7a unveils a therapeutic potential in amyotrophic lateral sclerosis

Affiliations

Modulation of ZnT-1 by Let7a unveils a therapeutic potential in amyotrophic lateral sclerosis

Serenella Anzilotti et al. Neurotherapeutics. 2025 Apr.

Abstract

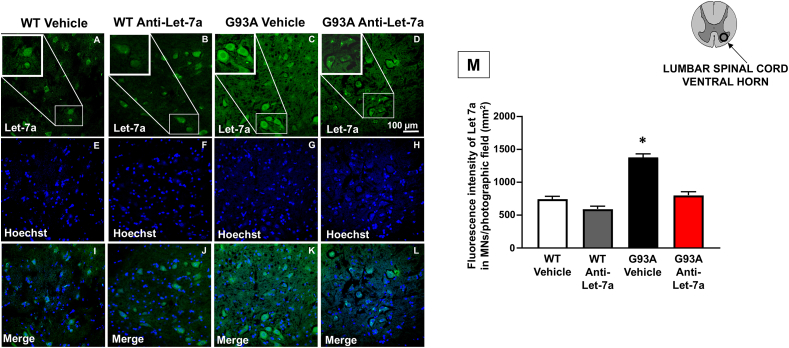
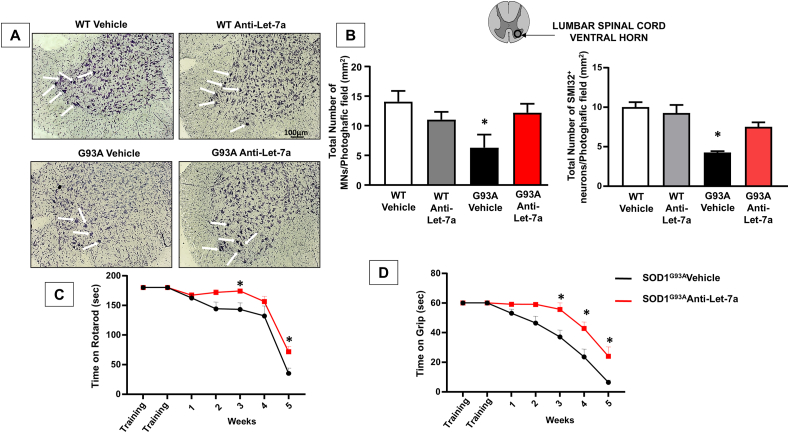
The imbalance in cellular ionic homeostasis represents a hallmark of several neurodegenerative diseases, including Amyotrophic Lateral Sclerosis (ALS). Zinc Transporter 1 (ZnT1), the first described member of the ZnT family, stands out as the sole member of the SLC30 family responsible for exporting cytosolic zinc to the extracellular space. While ZnT1 is expressed across all tissues and cell types studied, it exhibits the highest prominence within the central nervous system. In ALS SOD1G93A mice, a reduction in ZnT1 expression consistent with disease progression has been observed, prompting our investigation into its role in ALS pathophysiology. Remarkably, through the use of a sequence complementary to the microRNA let-7a (anti-Let-7a) able to modulate ZnT1 expression, we demonstrated in ALS mice its capability to: (1) prevent the reduction in ZnT1 levels in the spinal cord; (2) preserve motor neuron survival in the ventral spinal horn; (3) decrease astroglial and microglial activation while sparing resident microglial cells in the spinal cord; and (4) improve the lifespan and alleviate motor symptoms.

Keywords: ALS; G93A; ZnT1; microRNA.


Conflict of interest statement

Declaration of competing interest The authors declare that they have no known competing financial interests or personal relationships that could have appeared to influence the work reported in this paper.

Figures

Fig. 1
Fig. 1
Expression pattern of ZnT1 in the spinal cord of presymptomatic and symptomatic maleSOD1G93A mice and effects of ZnT1 silencing on the viability of motor neurons exposed to the neurotoxin L-BMAA. Representative Western blot (A) and densitometry quantification (B) of ZnT1 protein expression in the spinal cord of WT and SOD1G93A male mice. (C) RT–PCR of ZnT1 mRNA expression in the spinal cord of WT and SOD1G93A male mice. Values are presented as mean ​± ​SEM compared to the WT. Statistical significance was determined by One Way ANOVA followed by Newman-Keuls multiple comparison test with a confidence interval of 99 ​% (∗∗∗p ​< ​0.001 vs Wild-type; ˆ ˆ ˆ p ​< ​0,0001 10 weeks old SOD1G93A vs 20 weeks old SOD1G93A). (D) Bar graph showing the viability of NSC-34 ​cells exposed to L-BMAA for 48 ​h and previously transfected with siControl or siZnT1. (E) Representative Western blot and corresponding densitometry quantification of ZnT1 protein expression in NSC-34 ​cells transfected with siControl or siZnT1 and exposed or not to L-BMAA. Statistical significance was determined by One Way ANOVA followed by Bonferroni multiple comparison test with a confidence interval of 95 ​% (∗∗p ​< ​0.01, ∗∗∗p ​< ​0.001, ∗∗∗∗p ​< ​0.0001 vs siCtl; °°°p ​< ​0.001, °°°° p ​< ​0.0001 vs siZnT1; ˆ ˆ p ​< ​0.01 vs siCtl ​+ ​L-BMAA).
Fig. 2
Fig. 2
Let-7a miRNA can bind ZnT1 mRNA predicted region and down-regulate ZnT1 transcript and protein levels, affecting motor neuron viability. (A) Let-7a miRNA targeting to ZnT1 was predicted by miRNA target prediction databases. The sequences of seeds referring to the nucleotides in miRNA positions are shown. Watson–Crick matches in the seed sequence are highlighted. (B) Luciferase assay was performed in PC12 ​cells transfected with Let-7a and the pmirGLO Luciferase Expression Vector containing the wild type 3′UTR of ZnT1 gene or the 3′UTR-ZnT1 mutated on the Let-7a seed sequence. (C) RT–PCR of Let-7a expression in the spinal cord of WT and SOD1G93A male mice. Values are presented as mean ​± ​SEM compared to the WT. Statistical significance was determined by One Way ANOVA followed by Newman-Keuls multiple comparison test with a confidence interval of 95 ​% (∗∗∗p ​< ​0.001 vs 4.5 months old WT; ˆ ˆ ˆ p ​< ​0.001 vs 2 months old WT). (D) Measurement of cell viability in NSC-34 ​cells prior transfected with Let-7a mimic or the NT-miR or anti-Let-7a and then exposed or not to L-BMAA. (E) Representative Western blot and corresponding densitometry quantification of ZnT1 protein expression in NSC-34 ​cells transfected with Let-7a mimic or the NT-miR or anti-Let-7a and exposed or not to L-BMAA. Statistical significance was determined by One Way ANOVA followed by Bonferroni multiple comparison test with a confidence interval of 95 ​% (∗∗p ​< ​0.01, ∗∗∗∗p ​< ​0.0001 vs NT-miR; ###p ​< ​0.001 vs Let-7a; §§p ​< ​0.01 vs Let-7a ​+ ​L-BMAA).
Fig. 3
Fig. 3
Let-7a immunolocalization and quantification in spinal cord ofSOD1G93Amice treated to Anti-Let-7a. Double labeling of Let-7a(green) and Hoechst (blue) and Merge (yellow) in spinal cord of WT mice ​+ ​vehicle (a,e,i), WT mice ​+ ​anti-Let-7a (b,f,j) G93A mice ​+ ​vehicle (c,g,h) SOD1G93A mice ​+ ​anti-Let-7a (d,h,l) Scale bar 25 ​μm. Q: Fluorescence intensity in WT, SOD1G93A treated with vehicle and WT, SOD1G93A treated with anti-Let-7a. Data are expressed as mean ​± ​SEM (n ​= ​3 for each group). ∗p ​< ​0.05, SOD1G93A anti-Let-7a vs. SOD1G93A Vehicle. P values were obtained one-way ANOVA with Newman Keuls's correction for multiple comparisons.
Fig. 4
Fig. 4
ZnT1 immunolocalization and quantification in the spinal cord ofSOD1G93Amice treated to Anti-Let-7a. Double labeling of ZnT1(red) and SMI32 (green), Hoechst (blue) and Merge (yellow) in spinal cord of WT mice ​+ ​vehicle (a–d), WT mice ​+ ​anti-Let7a (i–l) G93A mice ​+ ​vehicle (e–h) G93A mice ​+ ​anti-Let7a (m–p) Scale bar 25 ​μm. Q: Number of ZnT1 dots in WT, G93A treated with vehicle and WT , G93A treated with anti-Let7a. Data are expressed as mean ​± ​SEM (n ​= ​3 for each group). ∗p ​< ​0.05, G93A anti-Let7a vs. G93A Vehicle. P values were obtained one-way ANOVA with Newman Keuls's correction for multiple comparisons.
Fig. 5
Fig. 5
Effect of Antilet-7a on survival, onset of disease and body weight ofSOD1G93Amice. Kaplan-Meier survival analysis (A), expressed as a percentage and in days (B), n ​= ​9 SOD1G93A mice treated with vehicle (white circle) and n ​= ​9 SOD1G93A mice treated with anti-Let7a (white square). Statistical analysis was performed using a Student's t-Test; significant differences are indicated as: ∗p ​< ​0.05, SOD1G93A mice anti-Let7a vs. SOD1G93A mice Vehicle. (C): Body weight expressed in percentage of SOD1G93A mice treated with vehicle (n ​= ​13) and SOD1G93A mice treated with anti-Let7a (n ​= ​14). P values were obtained using one-way ANOVA with Newman Keuls's correction for multiple comparisons. (D): Paralysis onset analysis expressed in days of G93A mice treated with vehicle (n ​= ​13) and G93A mice treated with anti-Let7a (n ​= ​14). Statistical analysis was performed using a Student's t-Test; significant differences are indicated as: ∗p ​< ​0.05.
Fig. 6
Fig. 6
Effect of Antilet-7a on motor neuron survival and motor functions ofSOD1G93Amice. (A): Representative image of Nissl staining in the spinal cord. Scale bar 100 ​μm. (B): Cell counting analysis of motor neurons expressed as a total number of motor neurons and SMI32 positive cells per photographic field in the spinal cord of SOD1G93A mice treated with vehicle or anti-Let7a compared to wild-type vehicle and anti-Let7a. ∗p ​< ​0.05, SOD1G93A mice vehicle vs SOD1G93A mice anti-Let7a. Data are expressed as mean ​± ​SEM (n ​= ​3/4 for each group). P values were obtained using one-way ANOVA with Newman Keuls's correction for multiple comparisons. (C): Rotarod test expressed in seconds in SOD1G93A mice treated with vehicle (n ​= ​13) or anti-Let7a (n ​= ​14). P values were obtained using one-way ANOVA with Newman Keuls's correction for multiple comparisons. Significant differences are indicated as: ∗p ​< ​0.05. (D) Grip performance expressed in seconds in SOD1G93A mice treated with vehicle (n ​= ​13) or anti-Let7a (n ​= ​14). P values were obtained using one-way ANOVA with Newman Keuls's correction for multiple comparisons. Significant differences are indicated as: ∗p ​< ​0.05.
Fig. 7
Fig. 7
Effect of Antilet-7a on glia activation ofSOD1G93Amice. Immunofluorescence analysis of GFAP (E–H) and Iba1 (A–D) in spinal cord sections from vehicle or anti-Let7a of WTand SOD1G93A mice (I,J) Fluorescence intensity of GFAP and Iba1 cells per photographic field (mm2), arbitrary units (AU). Data are expressed as mean ​± ​SEM (n ​= ​3/4 for each group). ∗p ​< ​0.05. P values were obtained using one-way ANOVA with Newman Keuls's correction for multiple comparisons.

References

    1. Hand C.K., Rouleau G.A. Familial amyotrophic lateral sclerosis. Muscle Nerve. 2002;25(2):135–159. - PubMed
    1. Pasinelli P., Brown R.H. Molecular biology of amyotrophic lateral sclerosis: insights from genetics. Nat Rev Neurosci. 2006;7(9):710–723. - PubMed
    1. Rosen D.R., Siddique T., Patterson D., Figlewicz D.A., Sapp P., Hentati A., et al. Mutations in Cu/Zn superoxide dismutase gene are associated with familial amyotrophic lateral sclerosis. Nature. 1993;362(6415):59–62. - PubMed
    1. Barnham K.J., Bush A.I. Metals in Alzheimer’s and Parkinson’s diseases. Curr Opin Chem Biol. 2008;12(2):222–228. - PubMed
    1. Vonk W.I., Klomp L.W. Role of transition metals in the pathogenesis of amyotrophic lateral sclerosis. Biochem Soc Trans. 2008;36(Pt 6):1322–1328. - PubMed

MeSH terms