Critical assessment of missense variant effect predictors on disease-relevant variant data
- PMID: 40113603
- PMCID: PMC11976771
- DOI: 10.1007/s00439-025-02732-2
Critical assessment of missense variant effect predictors on disease-relevant variant data
Abstract
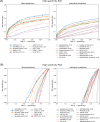
Regular, systematic, and independent assessments of computational tools that are used to predict the pathogenicity of missense variants are necessary to evaluate their clinical and research utility and guide future improvements. The Critical Assessment of Genome Interpretation (CAGI) conducts the ongoing Annotate-All-Missense (Missense Marathon) challenge, in which missense variant effect predictors (also called variant impact predictors) are evaluated on missense variants added to disease-relevant databases following the prediction submission deadline. Here we assess predictors submitted to the CAGI 6 Annotate-All-Missense challenge, predictors commonly used in clinical genetics, and recently developed deep learning methods. We examine performance across a range of settings relevant for clinical and research applications, focusing on different subsets of the evaluation data as well as high-specificity and high-sensitivity regimes. Our evaluations reveal notable advances in current methods relative to older, well-cited tools in the field. While meta-predictors tend to outperform their constituent individual predictors, several newer individual predictors perform comparably to commonly used meta-predictors. Predictor performance varies between high-specificity and high-sensitivity regimes, highlighting that different methods may be optimal for different use cases. We also characterize two potential sources of bias. Predictors that incorporate allele frequency as a predictive feature tend to have reduced performance when distinguishing pathogenic variants from very rare benign variants, and predictors trained on pathogenicity labels from curated variant databases often inherit gene-level label imbalances. Our findings help illuminate the clinical and research utility of modern missense variant effect predictors and identify potential areas for future development.
© 2025. The Author(s).
Conflict of interest statement
Declarations. Conflict of interest: The authors declare no conflicts of interest.
Figures


Update of
-
Critical assessment of missense variant effect predictors on disease-relevant variant data.bioRxiv [Preprint]. 2024 Jun 8:2024.06.06.597828. doi: 10.1101/2024.06.06.597828. bioRxiv. 2024. Update in: Hum Genet. 2025 Mar;144(2-3):281-293. doi: 10.1007/s00439-025-02732-2. PMID: 38895200 Free PMC article. Updated. Preprint.
References
-
- Bergquist T, Stenton SL, Nadeau EA, Byrne AB, Greenblatt MS, Harrison SM, Tavtigian SV, O’Donnell-Luria A, Biesecker LG, Radivojac P, et al. (2025) Calibration of additional computational tools expands ClinGen recommendation options for variant classification with PP3/BP4 criteria. Genetics in Medicine - PubMed
MeSH terms
Grants and funding
LinkOut - more resources
Full Text Sources

