. 2025 Mar 20;16(1):192.
doi: 10.1038/s41419-025-07523-1.

PER2 interaction with HSP70 promotes cuproptosis in oral squamous carcinoma cells by decreasing AKT stability

Affiliations

PER2 interaction with HSP70 promotes cuproptosis in oral squamous carcinoma cells by decreasing AKT stability

Wenguang Yu et al. Cell Death Dis. .

Abstract

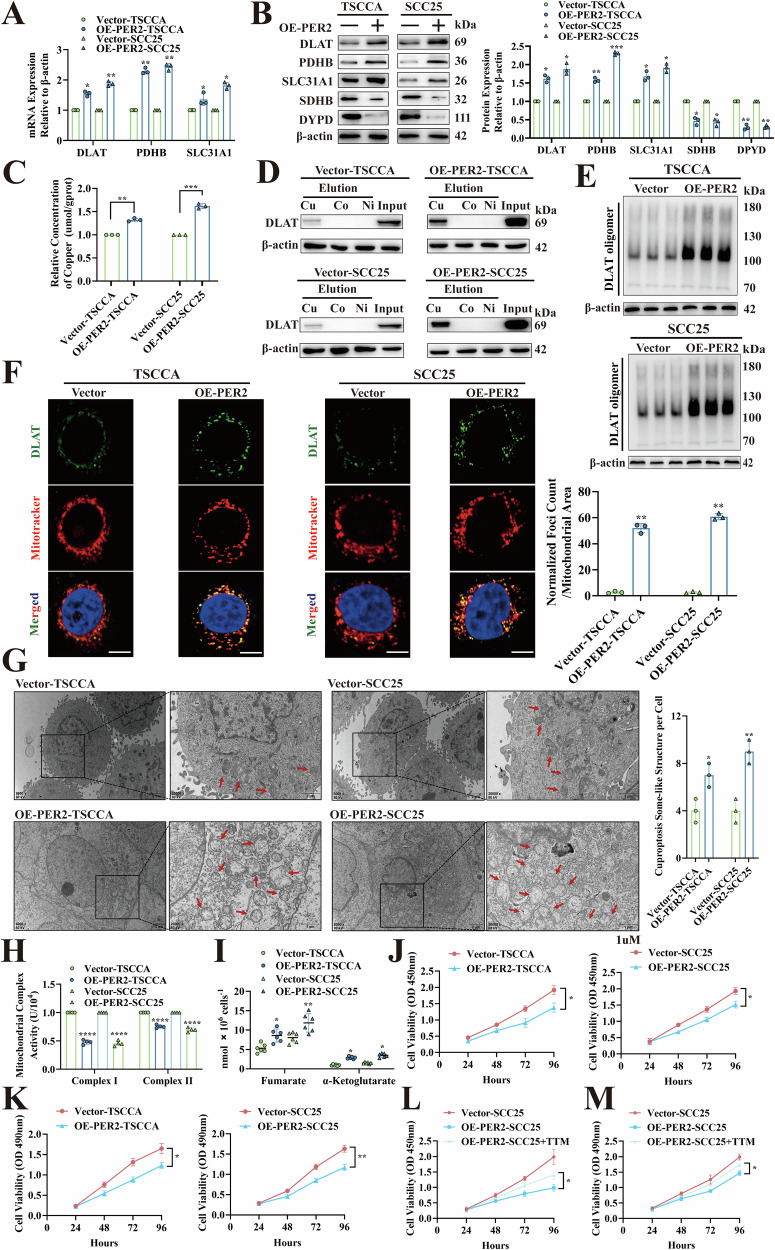
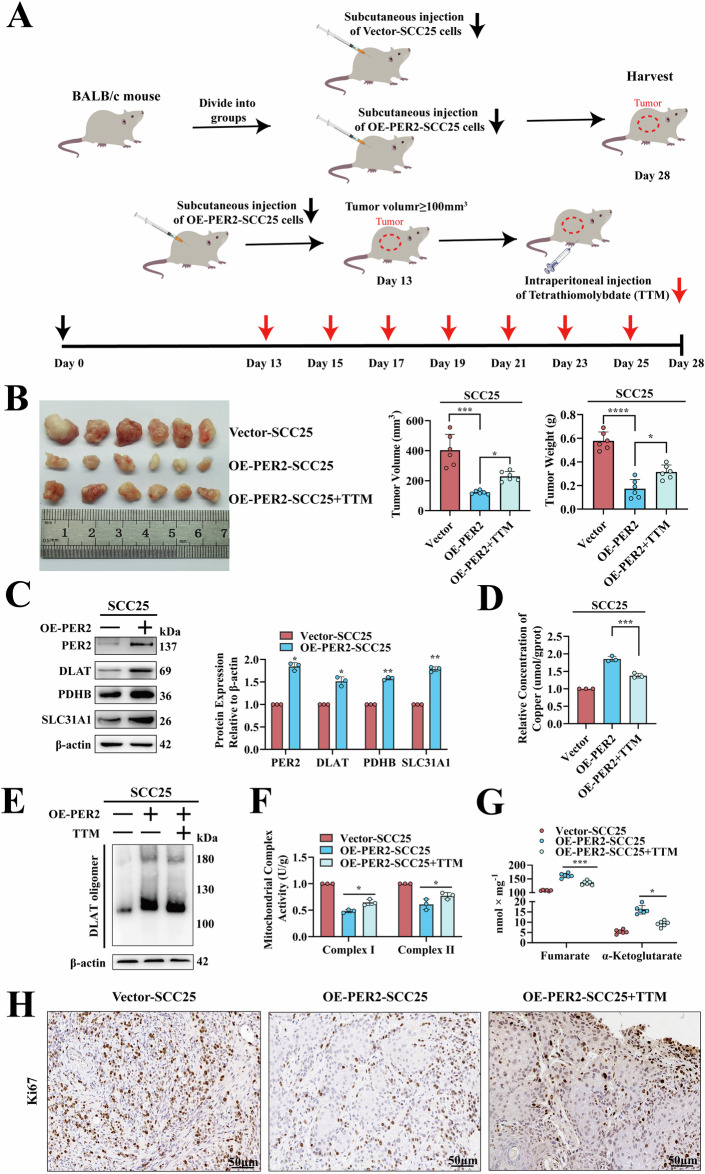
Oral squamous cell carcinoma (OSCC) has a poor prognosis, with unclear mechanisms posing a challenge for the development of effective treatment strategies. Cuproptosis is a novel cell death mode that disrupts mitochondrial metabolism. Clarifying the mechanisms that regulate cuproptosis may provide important new insights to guide OSCC treatment. Here, we found that the biological clock gene Period2 (PER2) was under-expressed in OSCC, with consequent inhibition of cellular cuproptosis, whereas it was overexpression of PER2 in vitro and in vivo and promoted OSCC cellular cuproptosis. Mechanistically, PER2 bound to heat shock protein 70 (HSP70) through its C-terminal domain, subsequently reducing the interaction between HSP70 and AKT and leading to enhanced degradation of AKT ubiquitination, and promoting cuproptosis in OSCC cells by inhibiting the AKT pathway and upregulating DLAT, PDHB, and SLC31A1 expression. Activating transcription factor 3 (ATF3) is an upstream regulator of PER2, that binds to the -807 to -796 bp site of the PER2 promoter. Overexpression of ATF3 in vitro and in vivo is dependent on transcriptional activation of PER2 and promotes cuproptosis in OSCC cells. The anti-tumor effect of ATF3 inducer 1-targeted upregulation of PER2 combined with copper ionophore elesclomol (ES) was found to be significantly enhanced compared with that of monotherapy in an OSCC xenograft model. These findings reveal a critical role of ATF3-dependent regulation of cuproptosis by PER2 in OSCC development, suggesting targeted upregulation of PER2 or ATF3 in combination to induce cuproptosis as a novel strategy to potentially improve the prognosis of OSCC patients.


Conflict of interest statement

Competing interests: The author declares no competing interests. Ethical approval: This study was approved by the Ethics Committee of First Affiliated Hospital of Chongqing Medical University, in accordance with the Declaration of Helsinki. All animal experiments were approved by the Institutional Animal Care and Use committee of Chongqing Medical University.

Figures

Fig. 1
Fig. 1. Low expression of PER2 in OSCC and positive correlation with cuproptosis.
TCGA database and Pearson correlation analysis of the differences (A) and correlation (B) of the expression of PER2 and 13 cuproptosis genes in OSCC compared with normal tissues. RT-qPCR assay and Pearson correlation analysis of 26 pairs of human OSCC and paired adjacent normal tissues for differences in expression (C) and correlation (D) of PER2 and 13 cuproptosis genes. RT-qPCR assay and Pearson correlation analysis of the differences (E) and correlation (F) of the expression of PER2 and 13 cuproptosis genes in SCC25 cells compared with HOK cells. G Venn diagrams take intersection results (correlation factor threshold >0.15). RT-qPCR detection of differential expression of PER2 and 3 cuproptosis genes, DLAT, PDHB, and SLC31A1 mRNA, in CAL27 and TSCCA cells (H) and correlation analysis by Pearson’s method (I). Western blotting to detect the expression of PER2, DLAT, PDHB, and SLC31A1 proteins in CAL27, TSCCA, and SCC25 cells (J) and Pearson correlation analysis (K). IHC assay of PER2, DLAT, PDHB, and SLC31A1 protein expression in OSCC tissues (n = 26, scale bars = 50 μm) (L) and Pearson correlation analysis (M). All data represent three replicate independent experiments. Data are presented as mean ± SD. *p < 0.05; **p < 0.01; ***p < 0.001; ****p < 0.0001. ANT adjacent normal tissue.
Fig. 2
Fig. 2. PER2-dependent promotion of cuproptosis inhibits OSCC cell proliferation in vitro.
A RT-qPCR to determine DLAT, PDHB and SLC31A1 mRNA expression in OSCC cells with overexpression of PER2. B Western blotting to determine DLAT, PDHB, SLC31A1, SDHB and DYPD protein expression in OSCC cells with overexpression of PER2. C Copper Colorimetric Assay Kit to determine the concentration of copper in OSCC cells with overexpression of PER2. D Copper affinity chromatography assay to determine the binding of copper to DLAT protein in OSCC cells with overexpression of PER2. E Non-denaturing gel electrophoresis assay to detect DLAT oligomers in OSCC cells with overexpression of PER2. F Immunofluorescence assay to detect DLAT oligomers in OSCC cells with overexpression of PER2 (yellow, DLAT oligomer; green, DLAT; red, Mitotracker; blue, DAPI; scale bars = 50 μm; three independent experiments). G TEM to observe and quantify the number of vacuolated mitochondria in OSCC cells with overexpression of PER2, as well as the observation that mitochondria appeared to be deformed and swollen (red arrows indicate mitochondria; three independent experiments). H Micro-mitochondrial Complex I and II Activity Assay Kit to detect activity of mitochondrial complexes I and II in OSCC cells with overexpression of PER2. I Fumarate Assay Kit and α-KG Assay Kit to detect the concentration of TCA intermediate metabolites (fumarate and α-ketoglutarate) in OSCC cells with overexpression of PER2. J CCK-8 assay to determine levels of cell proliferation in OSCC cells with overexpression of PER2. K MTT assay to determine levels of cell proliferation in OSCC cells with overexpression of PER2. L CCK-8 assay showed a significant increase in proliferation level of OE-PER2-SCC25 cells after the addition of copper chelator TTM compared with OE-PER2-SCC25 cells. M MTT assay showed a significant increase in proliferation level of OE-PER2-SCC25 cells after the addition of copper chelator TTM compared with OE-PER2-SCC25 cells. All data represent three replicate independent experiments. Data are presented as mean ± SD. *p < 0.05; **p < 0.01; ***p < 0.001; ****p < 0.0001.
Fig. 3
Fig. 3. PER2-dependent promotion of cuproptosis inhibits OSCC development in vivo.
A Schematic diagram of male BALB/c nude mice subcutaneously injected with Vector-SCC25 or OE-PER2-SCC25 cells to establish a model, and treated with TTM in OE-PER2-SCC25 model. B OE-PER2-SCC25 cell subcutaneous tumor formation assay in nude mice, growth of tumors in three groups at day 28. C Western blotting to examine PER2, DLAT, PDHB and SLC31A1 protein expression in tumors of Vector-SCC25 and OE-PER2-SCC25 groups. D Copper Colorimetric Assay Kit to measure intra-tumor copper concentration in Vector-SCC25, OE-PER2-SCC25 and OE-PER2-SCC25 + TTM groups. E Non-denaturing gel electrophoresis assay to detect intra-tumor DLAT oligomers in Vector-SCC25, OE-PER2-SCC25 and OE-PER2-SCC25 + TTM groups. F Micro-mitochondrial Complex I and II Activity Assay Kit to detect mitochondrial complex I and II activity in the tumors of Vector-SCC25, OE-PER2-SCC25 and OE-PER2-SCC25 + TTM groups. G Fumarate Assay Kit and α-KG Assay Kit to detect concentrations of fumarate and α-ketoglutarate in tumors of Vector-SCC25, OE-PER2-SCC25, and OE-PER2-SCC25 + TTM groups. H IHC assay of Ki67 expression in tumors in Vector-SCC25, OE-PER2-SCC25, and OE-PER2-SCC25 + TTM groups (n = 6, scale bars = 50 μm). All data represent three replicate independent experiments. Data are presented as mean ± SD. *p < 0.05; **p < 0.01; ***p < 0.001; ****p < 0.0001.
Fig. 4
Fig. 4. PER2 regulates OSCC cuproptosis through PER2/HSP70/AKT complex formation and AKT pathway.
A Western blotting showed that DLAT, PDHB, and SLC31A1 protein expression was significantly reduced by the addition of SC79 to OE-PER2-SCC25 cells. B Copper Colorimetric Assay Kit assay showed a significant reduction in copper concentration with the addition of SC79 to OE-PER2-SCC25 cells. C Non-denaturing gel electrophoresis assay detected a significant reduction of DLAT oligomers after addition of SC79 to OE-PER2-SCC25 cells. D Immunofluorescence assay detected a significant reduction in DLAT oligomers after addition of SC79 to OE-PER2-SCC25 cells (yellow, DLAT oligomer; green, DLAT; red, Mitotracker; blue, DAPI; scale bars = 50 μm; three independent experiments). E CCK-8 assay showed, cell proliferation levels were significantly increased by the addition of SC79 to OE-PER2-SCC25 cells. F MTT assay showed, cell proliferation levels were significantly increased by the addition of SC79 to OE-PER2-SCC25 cells. G Thomas blue-stained gel showed, Flag antibody fishing for candidate proteins that may bind to PER2 in SCC25 cells transfected with Flag-PER2. Schematic shows that three subunits (HSPA1, HSPA4 and HSPA8) of HSP70 in immunoprecipitation mass spectrometry results are all candidate proteins for binding to PER2 (screening criterion is unique peptide ≥2), suggesting that PER2 may have strong binding to HSP70. H Co-IP assay for PER2, HSP70 and AKT binding in SCC25 and 293 T cells. I GST pull-down assay for detecting direct binding of PER2 to HSP70 and AKT in vitro and direct binding of HSP70 to AKT in vitro. J Schematic showed that the major structural domains in UniProt and InterPro databases where PER2 binds to protein interactions are PAS1, PAS2, and C-terminal structural domain. K Construction of three plasmids with Flag-tagged PER2 deletion mutations in the structural domains of PAS1 (region 181V-248L), PAS2 (region 321Y-387Q) and CT (region 500S-1255T), respectively. L Co-IP assays were performed to detect the binding of HSP70 and AKT after three deletion mutant plasmids transfection into SCC25 cells, respectively. All data represent three replicate independent experiments. Data are presented as mean ± SD. *p < 0.05; **p < 0.01; ***p < 0.001; ****p < 0.0001.
Fig. 5
Fig. 5. PER2 promotes OSCC cuproptosis by downregulating HSP70 binding to AKT.
A Co-IP assay for PER2/HSP70 and HSP70/AKT complexes in Vector-SCC25 and OE-PER2-SCC25 cells. B CHX chase assay for half-life of HSP70 and AKT in Vector-SCC25 and OE-PER2-SCC25 cells. C Western blot and strip assay for levels of AKT ubiquitination in Vector-SCC25 and OE-PER2-SCC25 cells. D Western blotting assays for AKT, p-AKT, DLAT, PDHB and SLC31A1 protein expression in Vector-SCC25 and OE-PER2-SCC25 cells. E Copper Colorimetric Assay Kit for detecting copper concentration in Vector-SCC25, OE-PER2-SCC25 and Mut-PER2ΔCT-SCC25 cells. F Non-denaturing gel electrophoresis assay for detection of DLAT oligomers in Vector-SCC25, OE-PER2-SCC25 and Mut-PER2ΔCT-SCC25 cells. G Immunofluorescence assay for DLAT oligomers in Vector-SCC25, OE-PER2-SCC25 and Mut-PER2ΔCT-SCC25 cells (yellow, DLAT oligomer; green, DLAT; red, Mitotracker; blue, DAPI; scale bars = 50 μm; three independent experiments). H Micro-mitochondrial Complex I and II Activity Assay Kit to measure activity of mitochondrial complexes I and II in Vector-SCC25, OE-PER2-SCC25, and Mut-PER2ΔCT-SCC25 cells. I Fumarate Assay Kit and α-KG Assay Kit to examine fumarate and α-ketoglutarate concentrations in Vector-SCC25, OE-PER2-SCC25, and Mut-PER2ΔCT-SCC25 cells. J CCK-8 assay for proliferation levels of Vector-SCC25, OE-PER2-SCC25 and Mut-PER2ΔCT-SCC25 cells. K MTT assay for proliferation levels of Vector-SCC25, OE-PER2-SCC25 and Mut-PER2ΔCT-SCC25 cells. L Co-IP showed a significant increase in HSP70/AKT complex in Mut-PER2ΔCT-SCC25 cells compared with OE-PER2-SCC25 cells. M Western blotting demonstrated significant increases in AKT and p-AKT and significant decreases in DLAT, PDHB and SLC31A1 protein expression in Mut-PER2ΔCT-SCC25 cells compared with OE-PER2-SCC25 cells. All data represent three replicate independent experiments. Data are presented as mean ± SD. *p < 0.05; **p < 0.01; ***p < 0.001; ****p < 0.0001.
Fig. 6
Fig. 6. PER2 promoter binds to transcription factor ATF3 to activate PER2 transcription.
A Venn diagram showed intersection of transcription factors regulating PER2 from three databases, with binding rankings in order of ATF3, RUNX1, and IRF1. The PER2 promoter starts 2000 bp before the transcription start site. B IHC assay of PER2 and ATF3 expression in OSCC tissues and Pearson correlations between PER2 and ATF3 protein expression (n = 26, scale bars = 50 μm, ANT adjacent normal tissue). C Western blotting of PER2 and ATF3 protein expression in CAL27, TSCCA and SCC25 cells, and Pearson correlations between expression of PER2 and ATF3 proteins. D ChIP assay showed significantly enhanced binding of ATF3 to the PER2 promoter in OE-ATF3-SCC25 cells compared with Vector-SCC25 cells. E Dual-luciferase reporter gene assay to detect regulation of the PER2 promoter by OE-ATF3. F Analysis of hTFtarget database showed that ATF3 has five binding sites (−89 ~ −79, −257 ~ −249, −808 ~ −795, −1050 ~ −1042, and −1100 ~ −1089) with the PER2 promoter, and the TSS in the figure denotes the transcription start site. G Construction of truncated domain#1 (−1300 to 0), domain#2 (−1000 to 0), and domain#3 (−700 to 0) and wild-type (WT) PER2 promoter nucleotide sequences. H Dual-luciferase reporter gene assay to detect regulation by ATF3 binding of the WT PER2 promoter sequence and the three segment truncations. I Prediction based on the JASPAR database of the possible base sequence of ATF3 in the PER2 promoter sequence (GCTGAGGTCAGC), and analysis of the conservation of each base position in this sequence. Each column corresponds to one base position, and each base position consists of a stack of bases at that position, and the greater the total height of the stack of bases (denoted as bits, i.e., the value of vertical coordinates), the greater the conservation of bases at that position. J Schematic representation of the putative ATF3 binding site in the PER2 promoter and point mutation. Arrows indicate the direction of PER2 sequence transcription direction; blue bases show the predicted binding site (i.e., the WT sequence GCTGAGGTCAGC); and red bases indicate the mutated (Mut) binding site (i.e., Mut sequence AAAAAAAAAAAA). K Dual-luciferase reporter gene assay to examine the role of ATF3 in regulating the nucleotide sequence of the PER2 promoter in the WT and Mut groups. All data represent three replicate independent experiments. Data are presented as mean ± SD. *p < 0.05; **p < 0.01; ***p < 0.001; ****p < 0.0001.
Fig. 7
Fig. 7. ATF3 promotes OSCC cuproptosis dependent on PER2.
A RT-qPCR to detect PER2 mRNA expression in Vector-SCC25 and OE-ATF3-SCC25 cells. B Western blotting to detect PER2 protein expression in Vector-SCC25 and OE-ATF3-SCC25 cells. C Copper Colorimetric Assay Kit for measuring copper concentration in Vector-SCC25 and OE-ATF3-SCC25 cells. D Non-denaturing gel electrophoresis assay for analyzing DLAT oligomers in Vector-SCC25 and OE-ATF3-SCC25 cells. E Immunofluorescence assay for DLAT oligomers in Vector-SCC25 and OE-ATF3-SCC25 cells (yellow, DLAT oligomer; green, DLAT; red, Mitotracker; blue, DAPI; scale bars = 50 μm; three independent experiments). F TEM to observe the number of vacuolated mitochondria in Vector-SCC25 and OE-ATF3-SCC25 cells (red arrows indicate mitochondria; three independent experiments). G Fumarate Assay Kit and α-KG Assay Kit to detect fumarate and α-ketoglutarate concentrations in Vector-SCC25 and OE-ATF3-SCC25 cells. H Micro-mitochondrial Complex I and II Activity Assay Kit to detect activity of mitochondrial complexes I and II in Vector-SCC25 and OE-ATF3-SCC25 cells. I CCK-8 assay for proliferation levels of Vector-SCC25 and OE-ATF3-SCC25 cells. J MTT assay for proliferation levels of Vector-SCC25 and OE-ATF3-SCC25 cells. K RT-qPCR assay showed significantly lower mRNA expression of PER2 in OE-ATF3-SCC25+sh-PER2#3 cells compared with OE-ATF3-SCC25 cells. L Western blotting showed a marked reduction in PER2 protein expression in OE-ATF3-SCC25+sh-PER2#3 cells compared with OE-ATF3-SCC25 cells. M Non-denaturing gel electrophoresis assay to examine significant decreases in DLAT oligomers in OE-ATF3-SCC25+sh-PER2#3 cells compared with OE-ATF3-SCC25 cells. N Immunofluorescence assay showed significant decreases of DLAT oligomers in OE-ATF3-SCC25+sh-PER2#3 cells compared with OE-ATF3-SCC25 cells. O TEM observed significant decreases in the number of vacuolated mitochondria, as well as decreases in mitochondrial deformation and swelling in OE-ATF3-SCC25+sh-PER2#3 cells compared with OE-ATF3-SCC25 cells (red arrows denote mitochondria, three independent experiments). All data represent three replicate independent experiments. Data are presented as mean ± SD. *p < 0.05; **p < 0.01; ***p < 0.001; ****p < 0.0001.
Fig. 8
Fig. 8. ATF3-targeted upregulation of PER2 combined with induction of cuproptosis improves efficacy in OSCC treatment.
A Schematic diagram of subcutaneous injection of SCC25 cells to establish an OSCC model in BALB/c nude mice, and anti-tumor treatment with ATF3 inducer 1 and ES. B Nude mice were injected subcutaneously with SCC25 cells, and after tumor formation, saline, ATF3 inducer 1, ES, and a combination of the two were injected according to Blank-SCC25, SCC25 + ATF3 inducer 1, SCC25 + ES, and SCC25 + ATF3 inducer 1 + ES treatment groups, respectively, and the weight and volume were measured after harvesting tumors on day 28. C Western blotting for PER2 protein expression in Blank-SCC25, SCC25 + ATF3 inducer 1, SCC25 + ES and SCC25 + ATF3 inducer 1 + ES groups. D Copper Colorimetric Assay Kit to measure intra-tumor copper concentrations in the Blank-SCC25, SCC25 + ATF3 inducer 1, SCC25 + ES and SCC25 + ATF3 inducer 1 + ES groups. E Non-denaturing gel electrophoresis assay to detect DLAT oligomers in Blank-SCC25, SCC25 + ATF3 inducer 1, SCC25 + ES and SCC25 + ATF3 inducer 1 + ES groups. F Micro-mitochondrial Complex I and II Activity Assay Kit for detecting activity of electron transport chain complexes I and II in Blank-SCC25, SCC25 + ATF3 inducer 1, SCC25 + ES and SCC25 + ATF3 inducer 1 + ES groups. G IHC assay of Ki67 expression in Blank-SCC25, SCC25 + ATF3 inducer 1, SCC25 + ES and SCC25 + ATF3 inducer 1 + ES groups (n = 5, scale bars = 50 μm). All data represent three replicate independent experiments. Data are presented as mean ± SD. *p < 0.05; **p < 0.01; ***p < 0.001; ****p < 0.0001.

References

    1. Siegel RL, Giaquinto AN, Jemal A. Cancer statistics, 2024. CA Cancer J Clin. 2024;74:12–49. - PubMed
    1. Sung H, Ferlay J, Siegel RL, Laversanne M, Soerjomataram I, Jemal A, et al. Global Cancer Statistics 2020: GLOBOCAN estimates of incidence and mortality worldwide for 36 cancers in 185 countries. CA Cancer J Clin. 2021;71:209–49. - PubMed
    1. Bhat GR, Hyole RG, Li J. Head and neck cancer: current challenges and future perspectives. Adv Cancer Res. 2021;152:67–102. - PubMed
    1. He S, Chakraborty R, Ranganathan S. Proliferation and apoptosis pathways and factors in oral squamous cell carcinoma. Int J Mol Sci. 2022;23:1562. - PMC - PubMed
    1. Cramer JD, Burtness B, Le QT, Ferris RL. The changing therapeutic landscape of head and neck cancer. Nat Rev Clin Oncol. 2019;16:669–83. - PubMed

MeSH terms

Substances