. 2025 Mar 20;16(1):2743.
doi: 10.1038/s41467-025-57444-y.

Adipose progenitor cell-derived extracellular vesicles suppress macrophage M1 program to alleviate midlife obesity

Affiliations

Adipose progenitor cell-derived extracellular vesicles suppress macrophage M1 program to alleviate midlife obesity

Qing Zhou et al. Nat Commun. .

Abstract

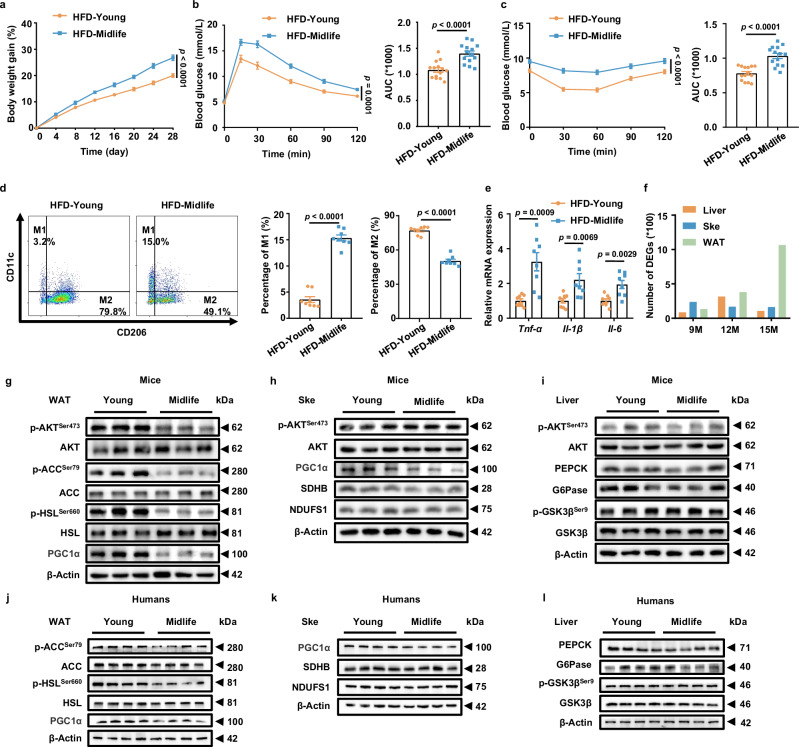
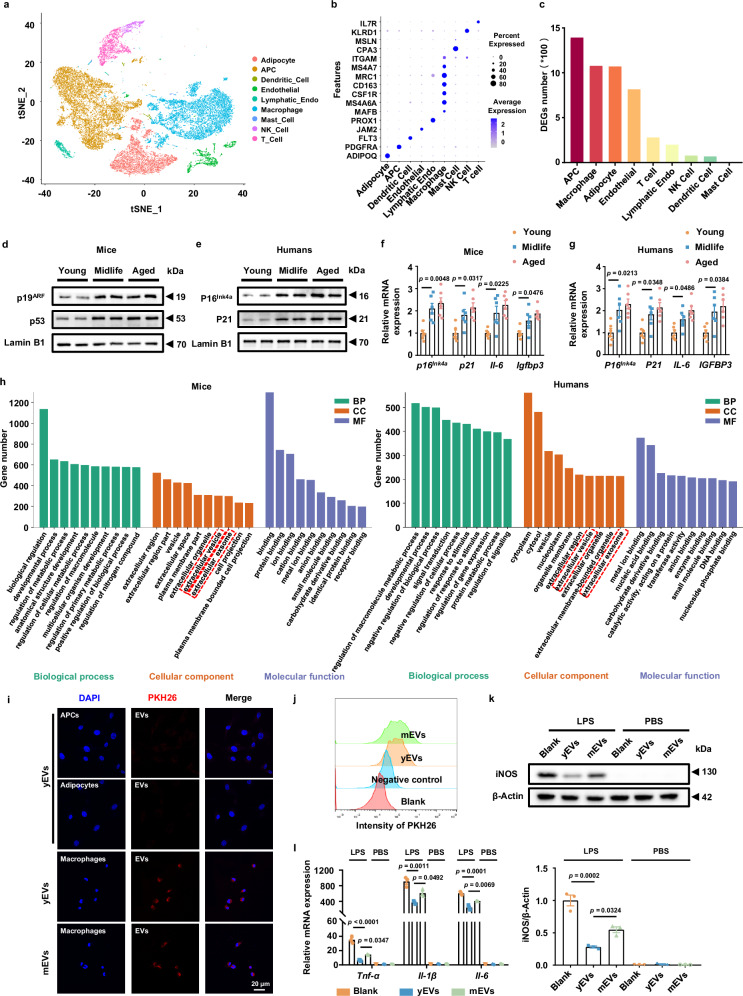
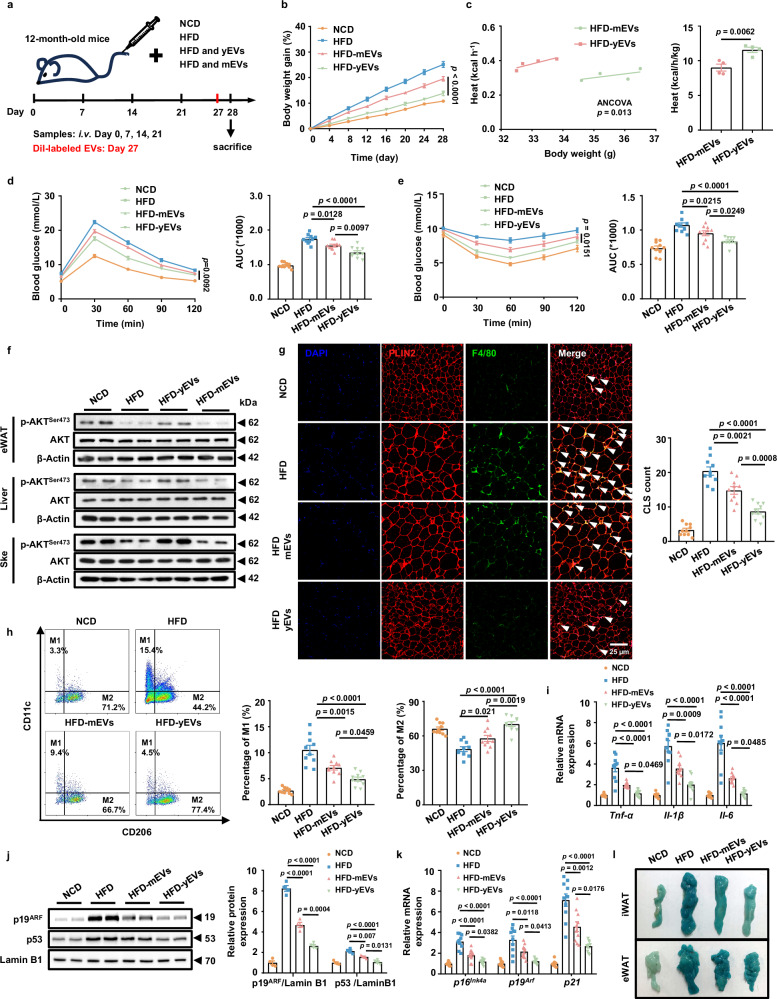
Among different age groups, middle-aged individuals are particularly susceptible to obesity, with a 22% higher risk of all-cause mortality. However, the underlying mechanisms remain unclear. In this study, we identify adipose progenitor cells (APCs) in the white adipose tissue (WAT) of middle-aged subjects as potential causes of midlife obesity. Specifically, the extracellular vesicles (EVs) derived from APCs display an impaired ability to mitigate the inflammaging of adipose tissue macrophages (ATMs) in middle-aged individuals. Mechanistically, these EVs, lacking miR-145-5p, fail to suppress the expression of L-selectin in ATMs, thereby facilitating their M1 program via the NF-κB signaling pathway. In contrast, EVs from young APCs effectively inhibit M1 macrophage polarization. Accordingly, targeted liposomes are designed to deliver miR-145-5p mimics to ATMs, which effectively prevent the obesity in middle-aged mice. Collectively, our findings highlight the role of APC-derived EVs in midlife obesity and propose miR-145-5pas a promising therapeutic target for clinical applications.


Conflict of interest statement

Competing interests: The authors declare no competing interests.

Figures

Fig. 1
Fig. 1. The susceptibility of middle-aged mice to obesity is attributed to altered WAT function.
a Body weight gain of young (3-month-old) and middle-aged (12-month-old) mice fed with a 4-week high-fat diet (HFD) (n = 14 per group). b, c Glucose tolerance test (GTT) (b) and insulin tolerance test (ITT) (c) results of young and middle-aged mice challenged with a 4-week HFD (n = 14 per group). d Flow cytometry analysis of the proportions of M1 (CD11b+/F4/80+/CD11c+/CD206-) and M2 (CD11b+/F4/80+/CD11c-/CD206+) macrophages in the epididymal WAT of young and middle-aged mice (n = 8 biological replicates per group). e RT‒qPCR analysis of the mRNA expression of proinflammatory genes (Tnf-α, Il-1β, and Il-6) in the epididymal WAT of young and middle-aged mice challenged with a 4-week HFD (n = 8 biological replicates per group). f Number of differentially expressed genes (DEGs) in the liver, muscle and WAT of C57BL/6 mice of different ages (9, 12, and 15 months). gi Western blot analysis of p-AKTSer473/AKT, p-ACCSer79/ACC, p-HSLSer660/HSL and PGC1α in WAT (g), p-AKTSer473/AKT, PGC1α, SDHB and NDUFS1 in skeletal muscle (h), p-AKTSer473/AKT, PEPCK, G6Pase and p-GSK3βSer9/GSK3β in liver (i) from young and middle-aged mice (n = 3 biological replicates per group). j-l Western blot analysis of p-ACCSer79/ACC, p-HSLSer660/HSL and PGC1α in subcutaneous WAT (j), PGC1α, SDHB and NDUFS1 in skeletal muscle (k), PEPCK, G6Pase and p-GSK3βSer9/GSK3β in liver (l) from young and middle-aged humans (n = 10 biological replicates per group). The data were presented as mean ± SEM. Statistical significance was assessed by two-way ANOVA and Bonferroni’s multiple comparisons test (a, left panels in b, c) or a two-sided Student’s t test (right panels in b–e). See also Supplementary Fig. 1. Source data are provided as a Source Data file.
Fig. 2
Fig. 2. Midlife APC-derived EVs exhibit a reduced capacity to maintain adipose immune homeostasis.
a A t-SNE plot displaying single-nucleus RNA sequencing data of cells from WAT samples from young and middle-aged humans. b Cell identity annotation in human WAT samples. c Number of DEGs for each identified cell subgroup. d, e Western blot results of p19ARF and p53 in mouse APCs (d), P16Ink4a and P21 in human APCs (e) from the young (mice, 3-month-old; humans, aged 18-29), middle-aged (mice, 12-month-old; humans, aged 30-49) and aged (mice, 24-month-old; humans, aged 50-69) groups (n = 3 independent experiments). f, g Transcriptional levels of senescence-associated genes in the APCs of mice (p16Ink4a, p21, Il-6, and Igfbp3) (f) and humans (P16Ink4a, P21, IL-6, and IGFBP3) (g) from the indicated groups (n = 6 per group). h Number of DEGs annotated through gene ontology (GO) enrichment-based clustering based on bulk RNA-seq analysis of young and middle-aged APCs from mice or humans. i The engulfment of PKH26-labeled EVs (red) by APCs, adipocytes and macrophages was detected by confocal microscopy. The experiments were repeated independently three times. Scale bar, 20 µm. j The engulfment of yEVs and mEVs by macrophages was detected by flow cytometry. k Western blot analysis of iNOS expression from BMDMs of blank, yEVs and mEVs groups in the presence of PBS or LPS (n = 3 per group). l RT‒qPCR results of inflammation-associated genes (Tnf-α, Il-1β, and Il-6) in BMDMs of blank, yEVs and mEVs groups in the presence of PBS or LPS (n = 3 biological replicates per group). The data were presented as mean ± SEM. Statistical significance was assessed by one-way ANOVA (f, g, bottom row in k, l). See also Supplementary Fig. 2 and Supplementary Fig. 3. Source data are provided as a Source Data file.
Fig. 3
Fig. 3. APC-derived EVs suppress WAT inflammaging to prevent obesity.
a A schematic diagram of the mouse treatments. b Body weight gain of 12-month-old male mice fed a NCD or HFD and treated with PBS, yEVs or mEVs (n = 10 per group). c Energy expenditure of 12-month-old male mice treated with mEVs or yEVs (n = 4 per group). GTT (d) and ITT (e) of 12-month-old male mice fed a NCD or HFD and treated with PBS, yEVs or mEVs (n = 10 per group). f Western blot of p-AKTSer473/AKT in the eWAT, liver and skeletal muscle of 12-month-old male mice fed a NCD or HFD and treated with PBS, yEVs or mEVs. g Confocal images and quantitative analysis of crown-like structures (CLSs, arrows) in eWAT from 12-month-old male mice fed a NCD or HFD and treated with PBS, yEVs or mEVs (n = 10 biological replicates per group). Scale bar, 25 µm. h Flow cytometry analysis of M1 (CD11b+/F4/80+/CD11c+/CD206-) and M2 (CD11b+/F4/80+/CD11c-/CD206+) macrophage subsets in the eWAT of 12-month-old male mice fed a NCD or HFD and treated with PBS, yEVs or mEVs (n = 10 per group). i RT‒qPCR analysis of Tnf-α, Il-1β, and Il-6 in eWAT from 12-month-old male mice fed a NCD or HFD and treated with PBS, yEVs or mEVs (n = 10 biological replicates per group). j Western blot analysis of p19ARF, p53 in eWAT from 12-month-old male mice fed a NCD or HFD and treated with PBS, yEVs or mEVs (n = 4 biological replicates per group). k RT‒qPCR analysis of p16Ink4a, p19Arf, and p21 in eWAT from 12-month-old male mice fed a NCD or HFD and treated with PBS, yEVs or mEVs (n = 10 biological replicates per group). l Representative SA-β-Gal staining of the iWAT and eWAT of 12-month-old male mice fed a NCD or HFD and treated with PBS, yEVs or mEVs. The data were presented as mean ± SEM. Statistical significance was assessed by two-way ANOVA and Bonferroni’s multiple comparisons test (b, left panels in d and e), two-sided ANCOVA with body weight as co-variate (left panel in c), two-sided Student’s t-test (right panel in c), or one-way ANOVA (i, k and right panels in d, e, g, h and j). See also Supplementary Fig. 4 and Supplementary Fig. 5. Source data are provided as a Source Data file.
Fig. 4
Fig. 4. EV-derived miR-145 serves as a critical factor in suppressing the ATM M1 program.
a Heatmap of miRNA expression profiles in yEVs and mEVs (n = 3 per group). b RT‒qPCR analysis of the candidate miRNAs in yEVs and mEVs (n = 3 biological replicates per group). c Correlation analysis between age and relative miR-145 expression in EVs derived from APCs humans of different ages. d Relative miR-145 expression in APCs from mice of different aged mice (3, 6, 9, and 12 months old) (n = 3 biological replicates per group). Flow cytometry analysis of CD11c (e), Western blotting results for iNOS (f) and RT‒qPCR results for the proinflammatory genes Tnf-α, Il-1β, and Il-6 (g) in BMDMs treated with PBS, PBS + miR-145 mimics, LPS, LPS + scramble, LPS + miR-145 mimics, LPS + miR-145 mimics + miR-145 inhibitor (n = 3 biological replicates per group). Flow cytometry results of CD11c (h), Western blotting results for iNOS (i) and relative mRNA expression of Tnf-α, Il-1β, and Il-6 (j) in BMDMs treated with PBS, LPS, LPS + yEVs, LPS + miR-145 inhibitor + yEVs (n = 3 biological replicates per group). The data were presented as mean ± SEM. Statistical significance was assessed by two-sided Student’s t-test (b), two-sided Spearman’s correlation (c), or one-way ANOVA (dj). See also Supplementary Fig. 6. Source data are provided as a Source Data file.
Fig. 5
Fig. 5. miR-145 attenuates the macrophage M1 program by inhibiting SELL expression.
a Average FPKM values of the PBS-treated group and the miR-145 mimics-treated group (n = 3 per group). Box plots present the means (lines inside the boxes), the 1st and 3rd quartiles (bottom and top bounds of the boxes). b Volcano plot of DEGs (fold change >2, p value ≤ 0.05) between the PBS-treated group and the miR-145 mimics-treated group. c Potential target genes of miR-145 predicted by TargetScan. d Heatmap of potential differentially expressed target genes in the PBS- and miR-145 mimics-treated groups. e Correlation analysis between age and the relative mRNA expression of Sell in the WAT ATMs of humans of different ages. f Protein expression levels of iNOS in BMDMs treated with either scrambled or Sell siRNA (n = 3 independent experiments). g Protein expression levels of iNOS in BMDMs subjected to specific treatments (n = 3 independent experiments). h KEGG analysis of all genes in M1 macrophages treated with scrambled or Sell siRNA, with a focus on the top 20 categories that exhibited the most significant changes. i, j Western blot results for iNOS, p-NF-κB p65, NF-κB p65, p-IκBα, and IκBα in BMDMs subjected to certain treatments (n = 3 independent experiments). The data were presented as mean ± SEM. Statistical significance was assessed by two-sided Student’s t-test followed by Benjamini-Hochberg false discovery rate (FDR) test (b), two-sided Spearman’s correlation (e), two-sided Hypergeometric test with Fisher’s exact test (h). Scr (scrambled siRNA), Si-Sell (Sell siRNA), Sell-Ctrl (rAd-ZsGreen), Sell-OE (rAd-ZsGreen-mSell-3Flag), CU-T12-9 (an NF-κB agonist). See also Supplementary Fig. 7. Source data are provided as a Source Data file.
Fig. 6
Fig. 6. Construction of cationic liposomes for targeted delivery of miR-145.
a Schematic illustration of miR-145@tar-lip via the binding of a peptide (CKGGRAKDC) to the surface of liposomes (miR-145@lip). b Hydrodynamic diameter, polydispersity index (PDI), zeta potential, and entrapment efficiency of the prepared liposomes. c Representative transmission electron microscopy (TEM) image of the liposomes. The experiments were repeated independently three times. Scale bar, 500 nm. d Hydrodynamic diameter distribution of the liposomes. e Colloidal stability of the liposomes within 24 h (n = 3 per group). f Biodistribution of liposomes at 0 h, 0.5 h, 2 h, 8 h, and 24 h tracked by an in vivo imaging system (IVIS) after intravenous injection of miR-145@lip or miR-145@tar-lip. g Accumulation of miR-145@lip and miR-145@tar-lip in iWATs and eWATs. h Flow cytometry analysis of miR-145@lip and miR-145@tar-lip uptake by SVF cells and ATMs. The data were presented as mean ± SEM (e). See also Supplementary Fig. 8. Source data are provided as a Source Data file.
Fig. 7
Fig. 7. miR-145@tar-lip efficiently attenuates HFD-induced obesity in middle-aged mice.
a Schematic diagram of the mouse treatments. b Body weight gain of middle-aged mice treated with PBS, NC miR@tar-lip, miR-145@lip or miR-145@tar-lip (n = 7 per group). c Energy expenditure of mice treated with miR-145@lip or miR-145@tar-lip (n = 4 per group). GTT (d) and ITT (e) of results for middle-aged mice treated with PBS, NC miR@tar-lip, miR-145@lip or miR-145@tar-lip (n = 7 per group). f Western blot results of p-AKTSer473/AKT in eWAT, liver and skeletal muscle from the indicated groups (n = 3 independent experiments). g Macrophage infiltration (green color) and crown-like structures (CLSs, arrows) in eWAT of mice treated with PBS, NC miR@tar-lip, miR-145@lip or miR-145@tar-lip and the statistics for the CLSs (n = 7 biological replicates per group). Scale bar, 25 µm. h Flow cytometry analysis of M1 (CD11b+/F4/80+/CD11c+/CD206-) and M2 (CD11b+/F4/80+/CD11c-/CD206+) macrophage subsets in eWAT of mice treated with PBS, NC miR@tar-lip, miR-145@lip or miR-145@tar-lip (n = 7 biological replicates per group). i RT‒qPCR results for the proinflammatory genes Tnf-α, Il-1β, and Il-6 in eWAT of mice treated with PBS, NC miR@tar-lip, miR-145@lip or miR-145@tar-lip (n = 7 biological replicates per group). j, k Protein expression of p19ARF and p53 (n = 4 biological replicates per group) (j) and the mRNA levels of p16Ink4a, p19Arf, and p21 (k) in eWAT of mice treated with PBS, NC miR@tar-lip, miR-145@lip or miR-145@tar-lip (n = 7 biological replicates per group). l Representative β-gal staining of iWAT and eWAT from the indicated groups. The data were presented as mean ± SEM. Statistical significance was assessed by two-way ANOVA and Bonferroni’s multiple comparisons test (b, left panels in d and e), two-sided ANCOVA with body weight as co-variate (left panel in c), two-sided Student’s t test (right panel in c), or one-way ANOVA (i, k, right panels in d, e, g, h, j), and p values indicate statistical significance. See also Supplementary Fig. 9 and Supplementary Fig. 10. Source data are provided as a Source Data file.
Fig. 8
Fig. 8. Scheme of miR-145 in APC-derived EVs modulating midlife obesity.
Senescent adipose progenitor cells (APCs) in middle-aged individuals are the cause of midlife obesity. miR-145 in APC-derived extracellular vesicles improves inflammaging and insulin resistance in middle-aged subjects. miR-145 inhibits the M1 polarization of adipose tissue macrophages by suppressing the SELL‒NF‒κB axis. miR-145 is a proof-of-concept effective target for the intervention of midlife obesity (Created in BioRender. Wang, W. (2025) https://BioRender.com/k41c453).

References

    1. Wang, L. et al. Body-mass index and obesity in urban and rural China: findings from consecutive nationally representative surveys during 2004-18. Lancet (Lond., Engl.)398, 53–63 (2021). - PMC - PubMed
    1. Hales, C. M., Fryar, C. D., Carroll, M. D., Freedman, D. S. & Ogden, C. L. Trends in Obesity and Severe Obesity Prevalence in US Youth and Adults by Sex and Age, 2007-2008 to 2015-2016. Jama319, 1723–1725 (2018). - PMC - PubMed
    1. Chen, C., Ye, Y., Zhang, Y., Pan, X. F. & Pan, A. Weight change across adulthood in relation to all cause and cause specific mortality: prospective cohort study. BMJ (Clin. Res. ed.)367, l5584 (2019). - PMC - PubMed
    1. Sakers, A., De Siqueira, M. K., Seale, P. & Villanueva, C. J. Adipose-tissue plasticity in health and disease. Cell185, 419–446 (2022). - PMC - PubMed
    1. Huang, T. et al. Adipocyte-derived kynurenine promotes obesity and insulin resistance by activating the AhR/STAT3/IL-6 signaling. Nat. Commun.13, 3489 (2022). - PMC - PubMed

MeSH terms