. 2025 Mar 20;16(1):2744.
doi: 10.1038/s41467-025-57918-z.

Regulatory T cells in the mouse hypothalamus control immune activation and ameliorate metabolic impairments in high-calorie environments

Affiliations

Regulatory T cells in the mouse hypothalamus control immune activation and ameliorate metabolic impairments in high-calorie environments

Maike Becker et al. Nat Commun. .

Abstract

The hypothalamus in the central nervous system (CNS) has important functions in controlling systemic metabolism. A calorie-rich diet triggers CNS immune activation, impairing metabolic control and promoting obesity and Type 2 Diabetes (T2D), but the mechanisms driving hypothalamic immune activation remain unclear. Here we identify regulatory T cells (Tregs) as key modulators of hypothalamic immune responses. In mice, calorie-rich environments activate hypothalamic CD4+ T cells, infiltrating macrophages and microglia while reducing hypothalamic Tregs. mRNA profiling of hypothalamic CD4+ T cells reveals a Th1-like activation state, with increased Tbx21, Cxcr3 and Cd226 but decreased Ccr7 and S1pr1. Importantly, results from Treg loss-of function and gain-of-function experiments show that Tregs limit hypothalamic immune activation and reverse metabolic impairments induced by hyper-caloric feeding. Our findings thus help refine the current model of Treg-centered immune-metabolic crosstalk in the brain and may contribute to the development of precision immune modulation for obesity and diabetes.


Conflict of interest statement

Competing interests: As a scientist, M.H.T. participated in a scientific advisory board meeting of ERX Pharmaceuticals, Inc., Cambridge, MA, in 2019. He was a member of the Research Cluster Advisory Panel (ReCAP) of the Novo Nordisk Foundation between 2017 and 2019. He received funding for his research projects by Novo Nordisk (2016–2020) and Sanofi-Aventis (2012–2019). He consulted twice for Böhringer Ingelheim Pharma GmbH & Co. KG (2020 & 2021) and delivered a scientific lecture for Sanofi-Aventis Deutschland GmbH (2020) and for AstraZeneca GmbH (2024). As CEO and CSO of Helmholtz Munich, he is co-responsible for countless collaborations of the employees with a multitude of companies and institutions, worldwide. In this capacity, he discusses potential projects with and has signed/signs contracts for the centers institute(s) related to research collaborations worldwide, including but not limited to pharmaceutical corporations like Boehringer Ingelheim, Novo Nordisk, Roche Diagnostics, Arbormed, Eli Lilly, SCG Cell Therapy and others. As the CEO of Helmholtz Munich, he was/is further overall responsible for commercial technology transfer activities. M.H.T. confirms that to the best of his knowledge, none of the above funding sources or collaborations were involved in or had an influence on the preparation of this manuscript. The remaining authors declare no competing interests.

Figures

Fig. 1
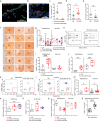
Fig. 1. Identification of CD4+T cells and CD4+CD25+Foxp3GFP+Tregs in brains of healthy lean mice.
a, b Representative immune fluorescence staining of brain cryosections (12 µm) of Balb/c mice (a) stained for glial fibrillary acidic protein (GFAP, astrocyte marker, green), CD4 (T-cell marker, red) and DAPI (nuclei, blue) and b stained for CD3 (T-cell marker, green), Foxp3 (Treg marker, red) and DAPI (nuclei, blue). Stainings were obtained from >3 independent experiments. The scale bar is 20 µm. c Anti-GFP DAB staining of 30 µm vibratome sections of brains from Foxp3GFP Balb/c reporter mice to detect Tregs in the brain. The scale bar is 50 µm or 25 µm as indicated. Stainings were obtained from >3 independent experiments. d, e Representative immune fluorescence staining of brain cryosections (12 µm) stained for lectin (vessel, green), CD4 (CD4 T-cell marker, red) and DAPI (nuclei, blue) for the quantification of vessel-associated (d) vs. vessel distinct (e). The scale bar is 50 µm or 20 µm as indicated in the figure. f Summary graph for the quantification of vessel-associated (depicted as circles) vs. distinct from vessel (depicted as squares) CD4+T cells. Dots represent counts per high power field (HPF) as in (d, e), obtained from multiple sections. Mean ± SEM. Two-tailed unpaired Student’s t test, P < 0.0001. g, h Flow cytometric analysis of g CD4+T cells from mouse brain without hypothalamus (referred to as rest brain) and hypothalamus. CD4+T cells are analyzed as being positive for CD4 and negative for a panel of exclusion markers (live dead stain, B220, CD8a, CD11b, CD11c, CD14, F4/80). h Flow cytometric analysis of CD25+Foxp3GFP+ Tregs (% of live CD4+) from mouse rest brain and hypothalamus. Tregs were pre-gated on CD4+ and negative for exclusion markers as in (g). Source data are provided as a Source Data file. ****P < 0.0001.
Fig. 2
Fig. 2. A high-calorie diet promotes hypothalamic immune activation in local CD4+T cells.
a, b Representative immune fluorescence staining of Balb/c brain cryosections (12 µm) stained for lectin (vessel, green), CD4 (CD4 T-cell marker, red) and DAPI (nuclei, blue) for the quantification of vessel-associated (a) vs. vessel distinct (b) after 16 weeks HFHS diet. The scale bar is 50 µm or 20 µm as indicated. c Summary graph for the quantification of vessel-associated vs. not vessel-associated CD4+T cells upon exposure to high-fat high-sugar (HFHS) diet for 16 weeks. Vessel-associated CD4+ T cells are depicted as circles, T cells distinct from vessels as triangles and were quantified as counts per high power field (HPF) across multiple sections. Mean ± SEM. Two-tailed Mann–Whitney U test, P < 0.0001. d, e Summary graph for the quantification of d vessel-associated CD4+T cells and e T cells distinct from vessels per high power field (HPF) upon exposure to a standard diet (SD) or high-fat high-sugar (HFHS) diet for 16 weeks. Mean ± SEM. Two-tailed Mann–Whitney U test d P = 0.1531; e P = 0.2198. (f) Representative anti-GFP DAB immunostainings in brains of CD4GFP mice fed a standard diet or HFHS diet for 6 months. Vibratome sections were cut with 30 µm and the scale bar is 20 µm. Stainings were obtained from >3 experiments. g Quantification of CD25hiFoxp3+Treg frequencies (% of CD4+) in rest brain vs. hypothalamus of Foxp3GFP Balb/c mice exposed to HFHS diet for 8–48 weeks. n = 4–16 biological replicates from ≥4 independent experiments. Depicted are box-and-whisker plots (min to max with all data points). One-way ANOVA with Šidák post hoc test, multiple comparisons vs. lean values. Adjusted P values for hypothalamus: P(8 weeks) = 0.0660; P(16 weeks) <0.0001; P(21 weeks) <0.0001; P(48 weeks) <0.0001. Adjusted P values for rest brain: P(8 weeks) > 0.9999; P(16 weeks) = 0.9882; P(21 weeks) = 0.6420; P(48 weeks) = 0.9131. h Representative FACS plots for the analysis of activated CD62Llow CD4+ T cells in mouse Foxp3GFP Balb/c brains with or without exposure to HFHS diet (SD gray, 16 weeks HFHSD red). i Quantification of (H) in % of CD4+ T cells. Depicted are box-and-whisker plots (min-to-max values with all data points); n = 8 or n = 15 biological replicates from >4 independent experiments. One-way ANOVA with Šidák post hoc test. Adjusted P values: P(hypothalamus) <0.0001; P(rest brain) = 0.6028). j Box-and-whisker plots (min-to-max values with all data points) for activated CD44hiCD4+ T cells from mouse Foxp3GFP Balb/c brains exposed to SD or HFHS diet; n = 8 biological replicates from four independent experiments. One-way ANOVA with Šidák post hoc test, adjusted P values: p(hypothalamus) = 0.0011; P(rest brain) = 0.0004). km Representative FACS plots for hypothalamic CD44hiCD62Llow effector memory T cells (as % of CD4+) from the hypothalamus (k) or rest brain (l) of Foxp3GFP Balb/c mice. m summary plot depicted as box-and-whisker plots (min to max with all data points). N = 5–19 biological replicates. One-way ANOVA with Šidák post hoc test, adjusted P values: p(hypothalamus) = 0.0323; P(rest brain) = 0.0381). n, o Lymph node-residing CD4+Foxp3GFP+Tregs and CD4+CD62Llow T cells of Foxp3GFP Balb/c mice fed the standard or the HFHS diet. n = 8 biological replicates from 2 to 4 independent experiments. Data are depicted as box and whisker plot (min-to-max values with all data points). n One-way ANOVA with Šidák post hoc test, adjusted P values: P(SD vs. 16 weeks) = 0.0699; P(SD vs. 48 weeks) = 0.0056; P(16 weeks vs. 48 weeks) = 0.6880). o One-way ANOVA with Šidák post hoc test, adjusted P values: P(SD vs. 16 weeks) = 0.1038; P(SD vs. 48 weeks) = 0.5281; P(16 weeks vs. 48 weeks) = 0.8587). p Quantification of Treg frequencies from rest brain vs. hypothalamus of Foxp3GFP C57Bl/6J mice exposed to standard diet or HFHS diet for 8 or 16 weeks. Depicted are box-and-whisker plots (min to max with all data points). n = 4−8 biological replicates from 2 to 4 independent experiments. One-way ANOVA with Šidák post hoc test, adjusted P values: hypothalamus: P(SD vs. 8 weeks) <0.0001; P(SD vs 16 weeks) <0.0001; P(8 vs. 16 weeks) >0.9999; rest brain: P(SD vs. 8 weeks) = 0.2470; P(SD vs. 16 weeks) = 0.6984; P(8 vs. 16 weeks) = 0.9663). q Treg frequencies in the hypothalamus and rest brain of genetically obese ob/ob mice on SD. Depicted are box-and-whisker plots (min to max with all data points). n = 8 biological replicates from two independent experiments. Two-tailed unpaired t test, P < 0.0001. Source data are provided as a Source Data file. *P < 0.05; **P < 0.01; ***P < 0.001; ****P < 0.0001.
Fig. 3
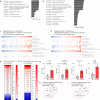
Fig. 3. Transcriptome of hypothalamus-residing CD4+T cells reflects diet-induced immune activation.
ad DESeq2-normalized read counts regulated more than 2.5-fold (HFHS diet vs. SD) were functionally annotated to Gene Ontology Biological Processes (GOBP) level 5 using DAVID Bioinformatics Resources 6.7. Terms are depicted as percentage GO-term gene coverage for a hypothalamic CD4+CD25CD44low+int T cells and b hypothalamic CD4+CD25highFoxp3GFP+T cells from Foxp3GFP Balb/c mice exposed to 16 weeks SD or HFHS diet (pooled from n = 9 animals). Regulated genes were annotated to selected immunological GOBP terms and color-coded by log10-fold change; c hypothalamic CD4+CD25CD44low+int T cells and d CD4+CD25highFoxp3GFP+T cells from Foxp3GFP Balb/c mice exposed to HFHS diet. e, f Heatmap of the fold change of selected differentially regulated genes in response to HFHS diet vs. SD in hypothalamic CD4+CD25CD44low+int T cells (e) or CD4+CD25highFoxp3GFP+T cells (f) of Foxp3GFP Balb/c mice. g Gene expression analysis of FACS-sorted CD4+CD25CD44low+int T cells from Foxp3GFP Balb/c mice exposed to 16 weeks SD or HFHS diet by qPCR. n = 4 biological replicates per group from two independent experiments. Mean ± SEM. Unpaired two-tailed t test, P(Ccr7) = 0.0801; P(Cd226) = 0.0670; P(Cxcr3) = 0.0188; P(Ifng) = 0.0169. h, i VENN diagram of regulated genes within selected immunological GO terms of hypothalamic (h) CD4+CD25 T cells and i CD4+CD25high T cells from ob/ob mice or C57Bl/6J wild-type mice fed the HFHS diet. Source data are provided as a Source Data file. *P < 0.05.
Fig. 4
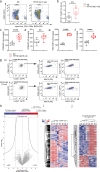
Fig. 4. A high-calorie diet promotes immune activation of microglia and infiltrating macrophages.
a Representative FACS plots for CD45intCD11b+ microglia and CD45hiCD11b+ infiltrating macrophages in brains from Foxp3GFP Balb/c reporter mice fed the standard or the HFHS diet. b Frequencies of CD45hiCD11b+ macrophages after 1 week of HFHS diet. Depicted are Box-and-whisker plots (min-to-max values with single data points), n = 8 from two independent experiments. Two-tailed unpaired t test; P = 0.0064. cf Analyses of MHCII expression and costimulatory markers (CD80, CD86 and CD40) on CD45intCD11b+ microglia of Foxp3GFP Balb/c mice fed a standard or HFHS diet for 16 weeks. Depicted are Box-and-whisker plots (min-to- max values with single data points), n = 8 biological replicates from two independent experiments. Two-tailed unpaired t test; P(CD80) < 0.0001; P(CD86) = 0.0028; P(MHCII) < 0.0001; P(CD45) < 0.0001. g Representative FACS plots for MHCII expression on hypothalamic microglia of Cx3cr1GFP reporter mice exposed to standard or HFHS diet for 12 weeks. hj Volcano plot (h) of the pairwise comparison between proteomes of CD45intCD11b+Cx3cr1GFP+ microglia fed a standard diet or exposed to the HFHS diet for 36 weeks. Expression fold changes (t-test difference, log2) were calculated and plotted against the t test P value (–log10). 1D annotation enrichment for the most enriched or depleted annotation term (Corum, GOBP, GOCC, GOMF, KEGG, Pfam) is depicted on top of the volcano plot including the Benjamini–Hochberg-corrected false-discovery rate. i All proteins quantified in the total proteome analysis were grouped using unsupervised hierarchical clustering of the z-scored MaxLFQ-intensities across the indicated experimental groups. j Most significantly regulated proteins of i were grouped using unsupervised hierarchical clustering of the z-scored MaxLFQ-intensities across the indicated experimental groups. Source data are provided as a Source Data file. **P < 0.01; ****P < 0.0001.
Fig. 5
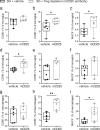
Fig. 5. Treg loss-of-function experiments reflect their impact in lowering diet-induced hypothalamic immune activation.
af Analyses of frequencies of CD80+, CD86+, and MHCII+ cells in CD45intCD11b+ microglia of ac C57Bl/6J or df Balb/c mice on standard diet examined 2 weeks after Treg depletion using mCD25 antibodies. Depicted are Box-and-whisker plots (min-to-max values with single data points). n = 6 biological replicates from two independent experiments. Two-tailed unpaired t test, P(a) = 0.1054; P(b) = 0.0499; P(c) = 0.0491; P(d) = 0.0292; P(e) = 0.3581; P(f)= 0.3513. gi Identification of frequencies of CD80+, CD86+, and MHCII+ cells in CD45hiCD11b+ macrophages of C57Bl/6J mice on standard diet examined 2 weeks after Treg depletion using mCD25 antibodies. Depicted are Box-and-whisker plots (min-to-max values with single data points). Two-tailed unpaired t test, P(g) = 0.4956; P(h) = 0.0013; P(i) = 0.0326. Source data are provided as a Source Data file. *P < 0.05. **P < 0.01.
Fig. 6
Fig. 6. Loss of Foxp3+Tregs enhances diet-induced hypothalamic immune activation.
Tregs were depleted using i.p. administration of diphtheria toxin (DTX) in Foxp3 DTR mice. a Representative FACS plots for macrophages and microglia after maintenance on the HFHS diet for 1 week with or without Treg depletion using Foxp3 DTR mice and ablation with DTX. b Quantification of CD45hiCD11b+ infiltrating macrophages. Data are depicted as box-and-whisker plots (min-to-max values with single data points). N = 6 biological replicates. Two-tailed unpaired Student’s t test with P = 0.0040. ce Immune activation of CD45intCD11b+ microglia as seen from CD80+, CD86+ and MHCII+ expressing cells. Data are depicted as box-and-whisker plots (min-to-max values with single data points). N = 6−8 biological replicates. fj Representative FACS plots and quantification of immune activation in infiltrating macrophages as seen from CD80+, CD86+ and MHCII+ expressing cells. Data are depicted as box-and-whisker plots (min-to-max values with single data points). N = 6 biological replicates. k Volcano plot of proteome analysis of FACS-sorted CD45intCD11b+ microglia from Foxp3 DTR mice without (n = 4) or with (n = 6) DTX-mediated Treg depletion exposed to 2 weeks HFHS diet. l, m Activation status and proliferative capacity of brain-residing CD4+T cells (1 week HFHS diet) with or without DTX-mediated Treg depletion. n = 4–6 biological replicates per group from two independent experiments. Depicted are Box-and-whisker plots (min-to-max values with single data points). Two-tailed unpaired t test, P(b) = 0.0040; P(c) = 0.0014; P(d) = 0.0440; P(e) = 0.3135; P(h) = 0.0124; P(i) = 0.065; P(j) = 0.0272; P(l, hypothalamus) = 0.0008; P(l, rest brain) = 0.0001; P(m, hypothalamus) = 0.0346; P(m, rest brain) <0.0001; Source data are provided as a Source Data file. *P < 0.05; **P < 0.01; ****P < 0.0001.
Fig. 7
Fig. 7. In vivo Treg expansion by anti-IL2/IL2 antibody complexes improves metabolic indices in mice fed a HFHS diet.
a, b Treg frequencies (a) and activation of non-Tregs (b) analyzed by flow cytometry in peripheral blood upon Treg expansion using anti-IL2/IL2 antibody complexes. N = 9 biological replicates per group. Mean ± SD. Two-way RM ANOVA with Šidák post hoc test, exact P values are provided in the Source Data file. c Corresponding body weight curves from (a). n = 9 per group. Mean ± SD. Two-way RM ANOVA with Šidák post hoc test. Exact P values are provided in the Source Data file. d Ccl5 gene expression analysis of hypothalami from (a). Mean ± SEM. Two-tailed unpaired t test, P = 0.0193. e Subcutaneous adipose tissue (SAT) and visceral adipose tissue (VAT) weights at the end of the study represented in grams and % of body weight. Each dot represents a biological replication. Mean ± SEM. Two-tailed unpaired t test, P(SAT, mg) = 0.0053; P(SAT, %BW) = 0.0064; P(VAT, mg) = 0.0027; P(VAT, %BW) = 0.0026. f, g ipGTT after 4 weeks (f) and 8 weeks (g) of Treg expansion. Each dot represents a biological replication. Mean ± SD. Two-tailed unpaired t test, P(4 weeks) <0.0001; P(8 weeks) <0.0001. Source data are provided as a Source Data file. *P < 0.05; **P < 0.01; ***P < 0.001; ****P < 0.0001.
Fig. 8
Fig. 8. Transferred Foxp3+Tregs reduce hypothalamic immune activation induced by the HFHS diet and improve metabolic indices.
a Representative FACS plots for CD45intCD11b+ microglia and CD45hiCD11b+ infiltrating macrophages in brains from C57Bl/6J mice fed the HFHS diet for 2 weeks with or without peripheral Foxp3GFP+Treg transfer (i.v.). b Box-and-whisker plots (min-to-max values with single data points), for the frequencies of infiltrating macrophages of mice. n = 8 biological replicates from two independent experiments. Two-tailed unpaired t test, P = 0.0053. ce Identification of frequencies of CD80+ (P = 0.0256), CD86+ (P = 0.1207) and MHCII+ (P = 0.8314) cells in CD45intCD11b+ microglia. Box-and-whisker plots (min-to-max values with single data points). n = 6 biological replicates from two independent experiments. Two-tailed unpaired t test. f Frequencies of brain-residing CD4+CD62LlowT cells. n = 6 biological replicates per group from two independent experiments. Box-and-whisker plots (min-to-max values with single data points). Two-tailed unpaired t test, p(hypothalamus) = 0.0004; P(rest brain) <0.0001. g, h Representative FACS plots (g) for the identification of activated CD4+CD44hiT cells in mice with or without i.v. Treg transfer. h Quantification of (g). n = 6 biological replicates per group from two independent experiments. Box-and-whisker plots (min-to-max values with single data points). Two-tailed unpaired t test, P(hypothalamus) = 0.0024; P(rest brain) <0.0001. i, j ipGTT of mice fed a HFHSD for 4 weeks (wild-type C57Bl6J, i) or 8 weeks (wild-type Balb/c, j) that received vehicle or i.v. Treg transfers every 2 weeks. N = 4–6 biological replicates per group. Mean ± SD. Two-tailed unpaired t test, P(4 weeks) = 0.0531; P(8 weeks) <0.0001. Source data are provided as a Source Data file. *P < 0.05; **P < 0.01; ***P < 0.001; ****P < 0.0001.
Fig. 9
Fig. 9. Transferred Foxp3+Tregs reduce hypothalamic immune activation induced by the HFHS diet and improve metabolic indices.
a Localization of transferred CD4+CD25highFoxp3GFP+ Tregs after i.c. injection analyzed by fluorescence microscopy. Cryosections were stained for astrocytes (GFAP, red), nuclei (DAPI, blue) and GFP (transferred GFP+ Tregs, green). Localization of the i.c. transfer was shown in three independent experiments. Scale bar is 50 µm or 20 µm as indicated. b Representative FACS plots for CD45intCD11b+ microglia and CD45hiCD11b+ macrophages in brains from Balb/c mice fed the HFHS diet for 2 weeks. Prior to exposure to the HFHS diet, animals received i.c. Treg or cellular control transfers. cf Frequencies of CD45hiCD11b+ macrophages (c, P = 0.0307) and expression CD80+ (P = 0.0037), CD86+ (P < 0.0001), MHCII+ (P = 0.0040) cells in CD45intCD11b+ microglia (df). n = 6 biological replicates from two independent experiments. Box-and-whisker plots (min-to-max values with single data points). Two-tailed unpaired t test. g ipGTT of mice that received either i.c. control T cells or Tregs and were fed a HFHS diet for 2 weeks. Mean ± SD. n = 3 biological replicates per group. Two-tailed unpaired t test. Source data are provided as a Source Data file. P < 0.05; **P < 0.01; ***P < 0.001; ****P < 0.0001.

References

    1. Williams, K. W. & Elmquist, J. K. From neuroanatomy to behavior: central integration of peripheral signals regulating feeding behavior. Nat. Neurosci.15, 1350–1355 (2012). - PMC - PubMed
    1. Begg, D. P. & Woods, S. C. The endocrinology of food intake. Nat. Rev. Endocrinol.9, 584–597 (2013). - PubMed
    1. Clemmensen, C. et al. Gut-brain cross-talk in metabolic control. Cell168, 758–774 (2017). - PMC - PubMed
    1. Yi, C. X. & Tschop, M. H. Brain-gut-adipose-tissue communication pathways at a glance. Dis. Model Mech.5, 583–587 (2012). - PMC - PubMed
    1. Kalin, S. et al. Hypothalamic innate immune reaction in obesity. Nat. Rev. Endocrinol.11, 339–351 (2015). - PubMed

MeSH terms

LinkOut - more resources