. 2025 Mar 21;10(1):92.
doi: 10.1038/s41392-025-02180-4.

Targeting PI3K inhibitor resistance in breast cancer with metabolic drugs

Affiliations

Targeting PI3K inhibitor resistance in breast cancer with metabolic drugs

Niklas Gremke et al. Signal Transduct Target Ther. .

Abstract

Activating PIK3CA mutations, present in up to 40% of hormone receptor-positive (HR+), human epidermal growth factor receptor 2-negative (Her2-) breast cancer (BC) patients, can be effectively targeted with the alpha isoform-specific PI3K inhibitor Alpelisib. This treatment significantly improves outcomes for HR+, Her2-, and PIK3CA-mutated metastatic BC patients. However, acquired resistance, often due to aberrant activation of the mTOR complex 1 (mTORC1) pathway, remains a significant clinical challenge. Our study, using in vitro and orthotopic xenograft mouse models, demonstrates that constitutively active mTORC1 signaling renders PI3K inhibitor-resistant BC exquisitely sensitive to various drugs targeting cancer metabolism. Mechanistically, mTORC1 suppresses the induction of autophagy during metabolic perturbation, leading to energy stress, a critical depletion of aspartate, and ultimately cell death. Supporting this mechanism, BC cells with CRISPR/Cas9-engineered knockouts of canonical autophagy genes showed similar vulnerability to metabolically active drugs. In BC patients, high mTORC1 activity, indicated by 4E-BP1T37/46 phosphorylation, correlated with p62 accumulation, a sign of impaired autophagy. Together, these markers predicted poor overall survival in multiple BC subgroups. Our findings reveal that aberrant mTORC1 signaling, a common cause of PI3K inhibitor resistance in BC, creates a druggable metabolic vulnerability by suppressing autophagy. Additionally, the combination of 4E-BP1T37/46 phosphorylation and p62 accumulation serves as a biomarker for poor overall survival, suggesting their potential utility in identifying BC patients who may benefit from metabolic therapies.


Conflict of interest statement

Competing interests: C.D. received personal fees from Novartis, Roche, MSD Oncology, Daiichi-Sankyo, AstraZeneca, Molecular Health, and Merck, all outside the submitted work. C.D. is cofounder of Sividon Diagnostics. In addition, C.D. has a patent on VMScope digital pathology software with royalties paid; a patent WO2020109570A1—cancer immunotherapy pending; and patents WO2015114146A1 and WO2010076322A1—therapy response issued. P.J. reports research grants and travel expenses from GILEAD Sciences GmbH outside the submitted work. N.H. declares to be a GBG Forschungs GmbH employee. GBG Forschungs GmbH reports financial funding from AstraZeneca and Myriad during the conduct of the study; received funding for research grants from Abbvie, Amgen, AstraZeneca, BMS, Daiichi-Sankyo, Gilead, Molecular Health, Stemline Menarini, Celgene/BMS, Novartis, Pfizer and Roche (paid to the institution); GBG Forschungs GmbH has licensing fees from VMscope GmbH. In addition, GBG Forschungs GmbH has a patent EP21152186.9 pending, a patent EP19808852.8 pending, and a patent EP14153692.0 pending. S.L. declares to be the CEO of the GBG Forschungs GmbH. GBG Forschungs GmbH receives grants and other from Abbvie, grants from AstraZeneca, grant from Amgen, grants from DSI, grants from Gilead, Grants from Molecular Health, grants from Celgene/BMS, grants from Novartis, grants from Pfizer, grants from Roche, grant from Stemline/Menarini, financial support from Astra Zeneca, Gilead, Myriad, Novartis, Pfizer, BMS, Sanofi, Lilly, MSD; Consulting fees from following: AstraZeneca, Abbvie, Amgen, Cellcuity, DSI, Gilead, Novartis, Incyte, Pfizer, BMC, Sanofi, Lilly, MSD, Esai, Exact Science, Relay, Stemline, GSK, BioNtech, Olema, Roche; Payment Honoria: AZ, Amgen, Agendia, DSI, Gilead, Novartis, Pfizer, BMS, Stemline/Menarini, Lilly, MSD, Seagen, Medscape, Pierre Fabre, Roche; Travel support from: DSI, ESMO, SCGCC. S.L. reports leadership in: ESMO, SBGCC, SABCS, and AGO Kommission Mamma, S.L. reports receipt of drug equipment in trials from: Gilead, AZ, Celgene/BMS, Novartis, Pfizer, and Roche. GBG Forschungs GmbH has licensing fees from VMscope GmbH. In addition, GBG Forschungs GmbH has a patent EP21152186.9 pending, a patent EP19808852.8 pending, and a patent EP14153692.0 pending. The other authors declare no conflicts of interest. Ethics approval and consent to participate: Immunohistochemical staining and evaluation of breast cancer patient samples was approved by the Ethics Committee of the University of Marburg (Ethics Opinion No 38/20). All xenograft experiments were performed according to the German animal welfare law and the European legislation for the protection of animals used for scientific purposes (2010/63/EU) and were approved by the regional board (RP Giessen).

Figures

Fig. 1
Fig. 1
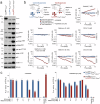
Metabolic vulnerability of Alpelisib-resistant breast cancer. a Schematic overview: Generation of Alpelisib-resistant breast cancer cells by dose escalation. Parental breast cancer cells (T47DPar) were treated with increasing doses of Alpelisib (5 nM to 2.5 µM) to obtain Alpelisib-resistant subclones (T47DAR1, T47DAR2). b Cell viability of parental and two Alpelisib-resistant subclones after 5-day treatment with Alpelisib. Shown are mean ± SD, n = 3, IC50 (95% CI). c Clonogenic growth of parental and Alpelisib-resistant cells treated with indicated drugs for 10 days. d Flow cytometry analysis for apoptosis (sub-G1). Indicated cells were treated with DCA or Metformin for 5 days. Shown are mean ± SD, n = 3, two-way ANOVA with Tukey’s multiple comparisons test. e Real-time live-cell imaging of parental (T47DPar) and Alpelisib-resistant cells (T47DAR1, T47DAR2) treated with DCA or Metformin. Shown is the mean confluence in % over time (n = 3) with FDR q values and the area under the proliferation curve (AUC) relative to untreated, one-way ANOVA with Dunnet’s multiple comparisons test, *p < 0.05; ****p < 0.0001
Fig. 2
Fig. 2
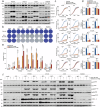
Metabolic vulnerability of Alpelisib-resistant breast cancer cells is mediated by mTOR. T47DPar cells were labeled with either CLuc (T47DPar CLuc+) or FLuc-GLuc (T47DPar FLuc+-GLuc+) and T47DAR1 cells with FLuc-GLuc (T47DPar FLuc+-GLuc+). a Western blot of luciferase-labeled T47DPar and T47DAR1 cells. b, c Proliferation competition assay. For Control-Suspension T47DPar CLuc+ and T47DPar FLuc+-GLuc+ cells and for Test-Suspension T47DPar CLuc+ and T47DAR1 FLuc+-GLuc+ cells were mixed in a 1:1 ratio, cultured 15 days in the presence or absence of AZD8055 (0.5 µM) in co-treatment with the indicated drugs and monitored daily for GLuc/CLuc activity (G/C activity) in the culture supernatant. b Shown is the G/C ratio normalized to day 1 ± SD, n = 3. FDR q values, one-way ANOVA with Tukey’s multiple comparisons test. c Endpoint measurement of intracellular FLuc activity within the Control- and Test-Suspension after 15-day treatment with indicated drugs in the presence or absence of AZD8055 (0.5 µM). Shown are mean ± SD, n = 3
Fig. 3
Fig. 3
mTOR-mediated autophagy deficiency in Alpelisib-resistant breast cancer cells induces energy stress and apoptosis upon metabolic drug treatment. a Western blot of parental (T47DPar) and Alpelisib-resistant cells (T47DAR1, T47DAR2) treated with 40 mM DCA or 4 mM Metformin for 48 h as indicated. p62 and LC3B I - II levels were quantified by ImageJ and normalized to β-actin serving as loading control. The LC3B-I/-II ratio was calculated by dividing the values of LC3B-I and LC3B-II. b Autophagic flux analysis. LC3-HiBiT-expressing T47DPar, T47DAR1, and T47DAR2 cells were pre-treated as indicated with chloroquine (50 µM) or AZD8055 (0,5 µM) for 48 h and then treated with increasing doses of Metformin or DCA for 6 h. Shown is LC3 HiBiT reporter activity measured as luminescence normalized to untreated. Mean ± SD, n = 3. c Representative immunofluorescence images of DsRed-LC3-GFP-expressing T47DPar and T47DAR1 cells following 48 h treatment with 40 mM DCA or 4 mM Metformin. Scale bars, 10 μM
Fig. 4
Fig. 4
CRISPR/Cas9-engineered autophagy-deficiency in breast cancer cells induces metabolic vulnerability. af T47DPar cells were infected with plentiCRISPRv2 vectors targeting FIP200, ATG14, ATG7, and RUBCN (sg-1 and sg-2, two independent sgRNAs per gene). After lentiviral transduction and puromycin selection, cells were single-cell cloned and examined for target gene knockout by Western blot (a). Mock: non-infected cells; EV: empty vector control. b Clonogenic growth of control (mock and EV) and knockout cells treated with DCA or Metformin. Shown are representative images. c, d Real-time live-cell imaging of control (mock and EV) and knockout cells treated with DCA or Metformin. c Mean confluence in % over time ± SD (n = 3). FDR q values. d AUC of proliferation curves relative to untreated. Shown is the mean ± SD (n = 3), one-way ANOVA with Dunnett’s multiple comparisons test, *p < 0.05; ****p < 0.0001. e Flow cytometry analysis for apoptosis (sub-G1). Indicated knockout cells were treated with DCA or Metformin for 5 days. Shown are mean ± SD, n = 3, two-way ANOVA with Tukey’s multiple comparisons test. f Western blot of control (mock and EV) and knockout cells treated with 40 mM DCA or 4 mM Metformin for 72 h
Fig. 5
Fig. 5
Autophagy-deficiency exacerbates metabolic stress induced by metabolic drugs. a Change in oxygen consumption rate (OCR, top) and extracellular acidification rate (ECAR, bottom) in response to treatment with Metformin and/or the combination of Oligomycin, Rotenone, Antimycin A (ORA). Data are presented as mean ± SD (n = 6). b Metabolomic profiles of untreated and Metformin-treated cells at 2 and 5 days post-treatment were compared in a pairwise correlation analysis. Shown is a heatmap of the Pearson correlation matrix, illustrating the similarity of metabolic profiles across conditions. Hierarchical clustering reveals distinct patterns of metabolic shifts over time and across different cell lines. c Hierarchically clustered heatmap of Metformin-induced metabolite changes (log2-fold) in the indicated cell lines 2 and 5 days post-treatment. d Pathway enrichment analysis (MetaboAnalyst 6.0) of metabolites altered by Metformin in T47DAR1 and T47DATG7 cells after 5 days, compared to all other samples. e Cellular abundance of the purine salvage pathway components aspartate, hypoxanthine, and fumarate in the indicated untreated and Metformin-treated cells. Untargeted LC/MS metabolomics data are presented as mean ± SD (n = 3). Statistical significance was determined by two-way ANOVA with Tukey’s multiple comparisons test. PRPP phosphoribosyl pyrophosphate, HPRT hypoxanthine-guanine phosphoribosyltransferase, IMP inosine monophosphate, ADSS adenylosuccinate synthase, AMPS adenylosuccinate, ADSL adenylosuccinate lyase, AMP adenosine monophosphate. f Clonogenic growth assay demonstrating rescue of Metformin vulnerability by supplementation with 10 mM L-aspartate
Fig. 6
Fig. 6
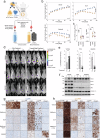
Metabolic drugs selectively target Alpelisib-resistant breast cancer cells in vivo. ah Mice were orthotopically injected in the mammary fat pad with a 1:1 ratio of T47DPar CLuc+ and T47DAR1 GLuc+-FLuc+ cells labeled with the secreted luciferases CLuc and GLuc, respectively, and treated as indicated. FLuc remains intracellular and was used for BLI. Tumor burden was quantified separately for each cell type by longitudinal CLuc and GLuc activity measurement in blood samples. b Tumor growth curves show the tumor burden (RLU, relative light units) over time as mean ± SD of n = 6 mice in the vehicle cohort and n = 5 mice in each treatment cohort, FDR q values. c FLuc activity and G/C Ratio of tumor lysates in (a). FLuc activity and G/C Ratio in tumor lysates were tested for statistical significance by two-way ANOVA with Dunnett’s multiple comparisons test. p-values denote pairwise comparisons of treatment cohorts with vehicle *p < 0.05; **p < 0.01; ****p < 0.0001. d Exemplary bioluminescence imaging (BLI) pictures of representative mice from each cohort in (a) before and after three weeks of treatment. e Luminescence quantification using Bruker Multiplex Software in a defined region of interest (ROI) of all mice in (a). Shown is the mean luminescence intensity ± SD. Statistical significance was tested using unpaired Mann–Whitney U test: *p < 0.05; **p < 0.01; ***p < 0.001. f Western blot of 3 tumors from each mouse cohort in (a). g, h T47DPar and T47DAR1 cells were injected into the mammary fat pad of immunodeficient mice. Developing tumors were treated with the indicated drugs for 3 days. Tissue sections were immunostained for the indicated proteins. Shown are representative images of tumors from each treatment cohort. Scale bars, 45 μM
Fig. 7
Fig. 7
Metabolic drugs selectively target autophagy-deficient breast cancer cells in vivo. ah Mice were orthotopically injected in the mammary fat pad with a 1:1 ratio of T47DPar CLuc+ and T47DATG7 GLuc+-FLuc+ cells labeled with the secreted luciferases CLuc and GLuc, respectively, and treated as indicated. FLuc remains intracellular and was used for BLI. Tumor burden was quantified separately for each cell type by longitudinal CLuc and GLuc activity measurement in blood samples. b Tumor growth curves show the tumor burden over time as mean ± SD of n = 5 mice in each cohort, FDR q values. c FLuc activity and G/C Ratio of tumor lysates in (a). FLuc activity and G/C Ratio in tumor lysates were tested for statistical significance by two-way ANOVA with Dunnett’s multiple comparisons test. p-values denote pairwise comparisons of treatment cohorts with vehicle ***p < 0.001. d Exemplary bioluminescence imaging (BLI) pictures of representative mice from each cohort in (a) before and after three weeks of treatment. e Luminescence quantification using Bruker Multiplex Software in a defined region of interest (ROI) of all mice in (a). Shown is the mean luminescence intensity ± SD. Statistical significance was tested using unpaired Mann–Whitney U test: **p < 0.01. f Western blot of 3 tumors from each mouse cohort in (a). g, h T47DPar and T47DATG7 cells were injected into the mammary fat pad of immunodeficient mice. Developing tumors were treated with the indicated drugs for 3 days. Tissue sections were immunostained for the indicated proteins. Shown are representative images of tumors from each treatment cohort. Scale bars, 45 μM
Fig. 8
Fig. 8
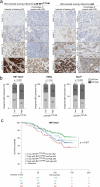
4E-BP1T37/46 phosphorylation and p62 accumulation correlate and together predict the overall survival of breast cancer patients. a p4E-BP1T37/46 and p62 tissue microarray (TMA) evaluation using IRS scoring. TMAs of paraffin-embedded breast cancer patient samples (n = 1120) were immunostained for p4E-BP1T37/46 and p62. Shown are representative immunostaining patterns indicating the intensity of staining (IS) and the percentage of positive cells (PS), graded from 0 (none) to 3 (strong) for IS and from <10% (1) to >80% (4) for PS. The IRS-oriented score for p4E-BP1T37/46 and p62 was determined by multiplying IS and PS. Scale bars: 200 μM. b p4E-BP1T37/46 and cytoplasmic p62 levels were evaluated using IRS scoring, calculated with VM Slide Explorer 2.2. Cutoff values (IRS Score 5) for classifying low (IRS < 5) and high (IRS > 5) 4E-BP1T37/46 and p62 expression were determined via Cutoff Finder. The correlation between p4E-BP1T37/46 and p62 is illustrated across indicated breast cancer subtypes (HR+/Her2 (n = 688), TNBC (n = 178) and Her2+ (n = 254)). P-values were determined using a two-sided Fisher’s exact test, with significance defined as <0.05. c Kaplan–Meier survival analysis for indicated levels of p4E-BP1T37/46 and p62 (low: IRS < 5 or high: IRS > 5). Shown is the OS of HR+/Her2 breast cancer patients (n = 687) according to p4E-BP1T37/46 and p62 levels. Significance was determined using a log-rank test: p = 0.050 (across all 4 arms), p = 0.007 (pairwise comparison of double-low (green) versus double-high (red) arms)

References

    1. Bray, F. et al. Global cancer statistics 2022: GLOBOCAN estimates of incidence and mortality worldwide for 36 cancers in 185 countries. CA Cancer J. Clin.74, 229–263 (2024). - PubMed
    1. Perou, C. M. et al. Molecular portraits of human breast tumours. Nature406, 747–752 (2000). - PubMed
    1. Harbeck, N. et al. Breast cancer. Nat. Rev. Dis. Prim.5, 66 (2019). - PubMed
    1. Varkaris, A. et al. Allosteric PI3Kα inhibition overcomes on-target resistance to orthosteric inhibitors mediated by secondary PIK3CA mutations. Cancer Discov.14, 227–239 (2024). - PMC - PubMed
    1. Gremke, N. et al. NGS-guided precision oncology in breast cancer and gynecological tumors-a retrospective molecular tumor board analysis. Cancers16, 1561 (2024). - PMC - PubMed

MeSH terms

Substances