. 2025 Mar 20;16(1):2755.
doi: 10.1038/s41467-025-57733-6.

Structural recognition and stabilization of tyrosine hydroxylase by the J-domain protein DNAJC12

Affiliations

Structural recognition and stabilization of tyrosine hydroxylase by the J-domain protein DNAJC12

Mary Dayne S Tai et al. Nat Commun. .

Abstract

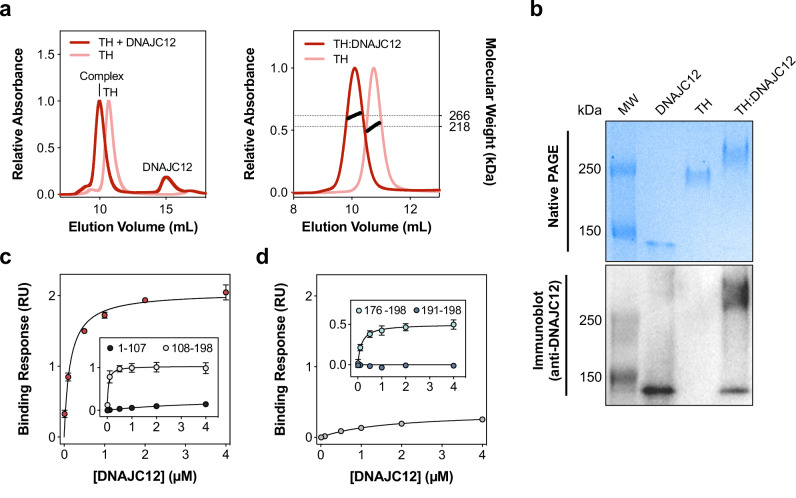
Pathogenic variants of the J-domain protein DNAJC12 cause parkinsonism, which is associated with a defective interaction of DNAJC12 with tyrosine hydroxylase (TH), the rate-limiting enzyme in dopamine biosynthesis. In this work, we characterize the formation of the TH:DNAJC12 complex, showing that DNAJC12 binding stabilizes both TH and the variant TH-p.R202H, associated with TH deficiency. This binding delays their time-dependent aggregation in an Hsp70-independent manner, while preserving TH activity and feedback regulatory inhibition by dopamine. DNAJC12 alone barely activates Hsc70 but synergistically stimulates Hsc70 ATPase activity when complexed with TH. Cryo-electron microscopy supported by crosslinking-mass spectroscopy reveals two DNAJC12 monomers bound per TH tetramer, each embracing one of the two regulatory domain dimers, leaving the active sites available for substrate, cofactor and inhibitory dopamine interaction. Our results also reveal the key role of the C-terminal region of DNAJC12 in TH binding, explaining the pathogenic mechanism of the DNAJC12 disease variant p.W175Ter.


Conflict of interest statement

Competing interests: The authors declare no competing interests.

Figures

Fig. 1
Fig. 1. Conformational characterization of purified DNAJC12 reveals regions with intrinsic disorder.
a Amino acid sequence of human DNAJC12, highlighting the J-domain (JD; dark blue), conserved HPD motif (asterisks), predicted disordered region (light red; see (b and c), and C-terminal conserved heptapeptide (light blue). b AlphaFold (AF) structural model of DNAJC12 (AF-Q9UKB3-F1), showing the JD with the highest prediction confidence. Excerpt: the first 100 residues, including the JD, are labeled with helices and the HPD motif in red. c Disorder prediction by IUPred2A mapped on the AF model. The JD and C-terminal end are predicted to be structured, while residues 104-171 (in the linker) are disordered. d Hydropathicity index by ProtScale (Kyte-Doolittle scale) mapped on the AlphaFold model, indicating hydrophobicity and hydrophilicity. e SEC-MALS analysis of DNAJC12. Elution profile of calibration proteins ferritin, 440 kDa; conalbumin, 75 kDa; carbonic anhydrase, 29 kDa; and RNAse A, 13.7 kDa (gray line) provide an apparent molecular mass for DNAJC12 (blue line) of ∼49 kDa. Coupling the column to a MALS detector provides the actual mass (22.7 ± 0.14 kDa), confirming that DNAJC12 is monomeric. f Far-UV SRCD spectra at increasing temperatures, showing the thermal unfolding of DNAJC12 (14 µM) (representative curves for n = 3 independent samples). Inset, mean ± SD of normalized CD signal at 222 nm; fitting to the Boltzmann equation provides the melting temperature (Tm) = 52.2 ± 6.0 °C. Source data are provided as a Source Data file.
Fig. 2
Fig. 2. Two DNAJC12 monomers bind via their C-terminal region to one TH tetramer.
a Left, SEC chromatograms show that excess DNAJC12 (20 µM) shifts the elution of TH (5 µM), indicating complex formation. Right, SEC-MALS analysis estimates the size of the TH:DNAJC12 complex as 266.1 ± 2.4 kDa, consistent with two DNAJC12 monomers binding to each TH tetramer. b Native PAGE (top) and immunoblot (bottom) analyses (2 µg protein in each sample) reveal that the TH:DNAJC12 complex migrates slower than TH alone through the native gel, and DNAJC12 is immunodetected in the complex. The results shown here are representative of at least three protein preparations tested in independent experiments. c BLI binding analyses of DNAJC12 and its truncated forms to TH, measured at varying concentrations (0.01-4 μM) of full-length DNAJC12 (red symbols), DNAJC12(1-107) (black symbols; inset) or DNAJC12(108-198) (white symbols; inset). d Binding analyses of C-terminal-truncated DNAJC12(1-190) (gray symbols) and peptides DNAJC12(191-198) (dark blue symbols; inset) and DNAJC12(176-198) (light blue symbols; inset) to TH. Removal of the C-terminal octapeptide reduces binding affinity of DNAJC12(1-190) >10-fold compared with full-length DNAJC12 (red symbols in c). The 23-residue C-terminal peptide DNAJC12(176-198) binds with high affinity, while the 8-residue DNAJC12(191-198) does not bind. Binding responses in (c and d) are presented as mean ± 95% CI for n = 3 independent samples, and KD values estimated by non-linear regression (see Supplementary Fig. 7 and Table 1). Source data are provided as a Source Data file.
Fig. 3
Fig. 3. DNAJC12 stabilizes and protects TH from aggregation without affecting its activity or DA feedback inhibition.
a CD-monitored (at 222 nm) thermal unfolding of TH (0.42 μM tetramer; gray symbols) and TH:DNAJC12 (0.42 μM complex; red symbols). Melting temperatures (Tm, mean ± SD): 51.21 ± 0.23 °C (TH) and 53.58 ± 0.47 °C (TH:DNAJC12), obtained from independent samples (n = 3) and triplicate measurements for each sample, and fitting to the Boltzmann equation. b DSF-monitored unfolding. Representative thermograms for TH (0.23 μM) and TH:DNAJC12 (0.23 μM) with/without 9 μM DA. Tm values are presented as mean ± SD (n = 3 independent experiments) and analyzed by one-way ANOVA and Tukey’s post-hoc HSD test (**p = 0.0034; ****p < 0.0001). c DLS-monitored aggregation. Z-average hydrodynamic diameter (d.nm; mean ± SD; n = 3 independent samples) of initially tetrameric TH (2.5 μM tetramer), for 100 min at 37 oC without (gray symbols) and with DNAJC12 (10 μM) (red symbols). d Visualization of aggregates by negative staining electron microscopy. Micrographs of samples initially containing tetrameric TH or TH(DA) (2.5 µM TH tetramer; 10 µM DA) after 100 min incubation at 37 oC without (left panels) and with DNAJC12 (5 μM) (right panels). Black arrows point to TH aggregates. Aggregate diameter, measured with ImageJ, decreased from 30 ± 3 nm for TH alone to 21 ± 3 nm for TH(DA) (n = 20 aggregates for each sample). DNAJC12 completely prevents TH aggregation over time. Scale bar: 50 nm. e Effect of DNAJC12 on TH activity (0.4 nM tetramer, concentration in the assay). The bars represent the mean ± SD (n = 3 independent samples, each with technical triplicates). Statistical significance was assessed by one-way ANOVA and pair-wise multiple comparisons by Tukey’s post-hoc test: *p = 0.0274. f DA concentration-dependent inhibition of activity of TH (0.4 nM tetramer; gray dots) and of TH:DNAJC12 (0.4 nM complex; red dots), presented as mean ± SD (n = 3 independent samples, each with technical triplicates). Fitting to a four-parameter logistic nonlinear regression provides similar half maximal inhibitory concentrations (IC50) for TH (363 ± 82 nM) and TH:DNAJC12 (356 ± 103 nM). Source data are provided as a Source Data file.
Fig. 4
Fig. 4. 3D reconstruction by cryo-EM of the TH:DNAJC12, TH:DNAJC12(108-198) and TH(DA):DNAJC12 complexes.
a, c, and e display two views of the TH:DNAJC12, TH:DNAJC12(108-198) and TH(DA):DNAJC12 complexes, respectively. In (a), red and orange asterisks indicate extra masses compared to apo-TH (PDB 7A2G). Red circles mark two of the four TH active sites. In (e), red asterisks show the N-terminal regulatory α-helix (residues 39-58) of TH in TH(DA) (PDB 6ZVP) entering the TH active sites. b, d, and f show the same views with apo-TH (in b, d) and TH(DA) (in f), and the AlphaFold model of DNAJC12 docked into the cryo-EM volume. In all panels, the TH domains are colored in dark blue (RD), cyan (CD), and green (OD), and the regulatory domain α-helix (39-58) in TH(DA) is colored in magenta (f). The AlphaFold model of DNAJC12 has the JD in orange and the CTD in red. For simplicity, note that the models only show DNAJC12 bound to one of the dimeric TH-RDs. Schematic diagrams of the relevant DNAJC12 variants used are represented below the figures.
Fig. 5
Fig. 5. Crosslinks obtained for the different TH:DNAJC12 complexes using XL-MS.
a, b and c show the same two views as in Fig. 4 for the TH:DNAJC12, TH:DNAJC12(108-198), and TH(DA):DNAJC12 complexes, respectively. The maps, structures and the color code used in all panels are identical to those in Fig. 4. The displayed crosslinks (highlighted in gray in Supplementary Table 2) are shown (in green) only for one side of the different TH complexes. Note that the distances of all crosslinks are also depicted.
Fig. 6
Fig. 6. Binding analyses and docking of the DNAJC12(176-198) peptide to the regulatory domains of TH.
a BLI binding analyses of DNAJC12(176-198) to purified dimeric TH-RDs (residues 1-158; dark blue) and tetrameric TH(CD+OD) (residues 155-497; light blue). Fitting to non-linear regression curves of the binding responses (mean ± 95% CI; n = 3 independent samples) provided similar affinity to TH-RDs and full-length TH (see KD-values in Table 1). b Assembly of the TH:DNAJC12 complex. Tetrameric TH (PDB 6ZVP) assembles as a dimer of dimers (one dimer shown in light blue and purple and the other in green and dark blue), with the ODs facing the center (light blue rectangle). Complex formation with DNAJC12 (JD in orange, CTD in red) further stabilizes the tetramer by embracing the RD-dimer, composed by monomers from opposite dimers (yellow rectangle). c Structural details of TH:DNAJC12 complex; I) DNAJC12-CTD (red ribbon and residues L189-I198 as balls) interact with Helix 2 of TH-RDs (cyan ribbon and residues R138-Q150 as balls); II) Helix III of DNAJC12-JD (yellow ribbon and residues Q57-E70 as balls) interact with Helix 2 of TH-RDs (light blue ribbon and residues V136-V151 as balls); III and IV) Regions 82LNLLFSP88 (pink) and 129EYFVRLE135 (orange), shown in both TH-RDs as ball and sticks in β-strands of the RDs. Both regions are predicted to bind to the Hsp70 family by Limbo and ChaperISM, and residues 82-88 are also predicted to have high propensity for aggregating intermolecular cross-β interactions by TANGO,. Source data are provided as a Source Data file.
Fig. 7
Fig. 7. DNAJC12 is unable to assist Hsc70 in remodeling aggregated and chaperone-bound unfolded luciferase, does not delay Tau aggregation, and only activates Hsc70 ATPase when complexed with TH.
a Reactivation of aggregated luciferase (20 nM) by Hsc70 and JDPs (DNAJB1, DNAJA2, DNAJC12) after 120 min without (light gray) and with (dark gray) nucleotide exchange factor (NEF) Apg2. DNAJB1 is most effective, and DNAJA2 also has good disaggregating/refolding activity, but DNAJC12 shows negligible activity ( < 0.05%; inset) and did not increase upon doubling the amount of DNAJC12 in the assay (data not shown). The reactivation efficiencies (mean ± SD; n = 3 independent experiments) were analyzed by one-way ANOVA and Tukey’s post-hoc HSD test (****p < 0.0001). b Refolding of Hsc70-bound luciferase by JDPs alone (light gray) or with Apg2 (dark gray). Luciferase (0.1 μM) was denatured at 42 °C with 2 μM Hsc70, then 1 μM JDPs added without or with 0.4 μM Apg2. The percentage of refolded luciferase by the different JDPs, compared to their respective controls without or with Apg2, that only have Hsc70 and do not contain any JDP are presented as mean ± SD (n = 3 independent samples), and analyzed by one-way ANOVA and Tukey’s post-hoc HSD test (****p < 0.0001). c Delay of heparin-induced Tau K18 P301L aggregation at 37 °C by JDPs, assessed by light-scattering. The data show representative time courses for Tau aggregation over time (n = 3, independent experiments) without (white) and with DNAJA2 (light gray) or DNAJC12 (dark gray). Only DNAJA2 successfully delays the aggregation, as seen by an extended lag phase in the aggregation onset. d Hsc70 ATPase activity stimulation by JDPs with and without TH. The ATPase activity of Hsc70 in the presence of DNAJC12, DNAJA2 and DNAJB1 in absence (gray) or presence (red) of TH were compared to the control with Hsc70 and Apg2 but without JDP. Data presented as mean ± SD (n = 3 independent experiments) by one-way ANOVA and Tukey’s post-hoc HSD test (*p = 0.0288; ****p < 0.0001). Source data are provided as a Source Data file.
Fig. 8
Fig. 8. DNAJC12 binds and stabilizes the disease-associated TH-R202H variant.
a Model of the TH:DNAJC12 complex showing the position of the variant TH-R202H. DNAJC12 is represented as a gray surface, while TH is shown as a cartoon. The catalytic and oligomerization domains of TH are colored in cyan and green, respectively, the two dimeric RDs in dark blue, the N-terminal regulatory α-helix in magenta and R202H as red spheres. b Determination of TH-R202H:DNAJC12 binding stoichiometry by SEC-MALS. Excess DNAJC12 shifts TH-R202H elution, indicating the formation of the TH-R202H:DNAJC12 complex (273.7 ± 0.95 kDa size), consistent with two DNAJC12 monomers per tetrameric TH-R202H (227.0 ± 4.5 kDa). c DSF-monitored unfolding. Upper panel, for TH-R202H (0.23 μM tetramer; light blue) and TH-R202H:DNAJC12 (0.23 μM complex; dark blue). Lower panel, the first derivative of the thermograms providing the melting temperatures (Tm; mean ± SD) for TH-R202H alone (48.38 ± 0 oC) and with DNAJC12 (49.81 ± 0.18 oC). d DLS-monitored aggregation. Z-average hydrodynamic diameter (d.nm) of initially tetrameric TH-R202H (2.5 μM tetramer) monitored for 100 min at 37 oC, without (light blue symbols) and with DNAJC12 (10 μM; dark blue symbols), represented as mean ± SD (n = 3 independent samples). e Stimulation of Hsc70 ATPase activity by DNAJC12 with either TH-WT or TH-R202H. Data represent the mean ± SD for n = 3 independent experiments. The ATPase activity was compared to the control containing only Hsc70 and Apg2 by one-way ANOVA and Tukey’s post-hoc HSD test (****p < 0.0001). Source data are provided as a Source Data file.

References

    1. Balchin, D., Hayer-Hartl, M. & Hartl, F. U. In vivo aspects of protein folding and quality control. Science353, aac4354 (2016). - PubMed
    1. Kampinga, H. H. & Craig, E. A. The HSP70 chaperone machinery: J proteins as drivers of functional specificity. Nat. Rev. Mol. Cell Biol.11, 579–592 (2010). - PMC - PubMed
    1. Hageman, J. & Kampinga, H. H. Computational analysis of the human HSPH/HSPA/DNAJ family and cloning of a human HSPH/HSPA/DNAJ expression library. Cell Stress Chaperones14, 1–21 (2009). - PMC - PubMed
    1. Greene, M. K., Maskos, K. & Landry, S. J. Role of the J-domain in the cooperation of Hsp40 with Hsp70. Proc. Natl Acad. Sci. USA95, 6108–6113 (1998). - PMC - PubMed
    1. Wittung-Stafshede, P., Guidry, J., Horne, B. E. & Landry, S. J. The J-domain of Hsp40 couples ATP hydrolysis to substrate capture in Hsp70. Biochemistry42, 4937–4944 (2003). - PubMed

MeSH terms

LinkOut - more resources