. 2025 Mar 20;15(1):9583.
doi: 10.1038/s41598-025-90004-4.

Paracancerous binuclear hepatocytes assessed by computer program is a novel biomarker for short term recurrence of hepatocellular carcinoma after surgery

Affiliations

Paracancerous binuclear hepatocytes assessed by computer program is a novel biomarker for short term recurrence of hepatocellular carcinoma after surgery

Yifan Zhang et al. Sci Rep. .

Abstract

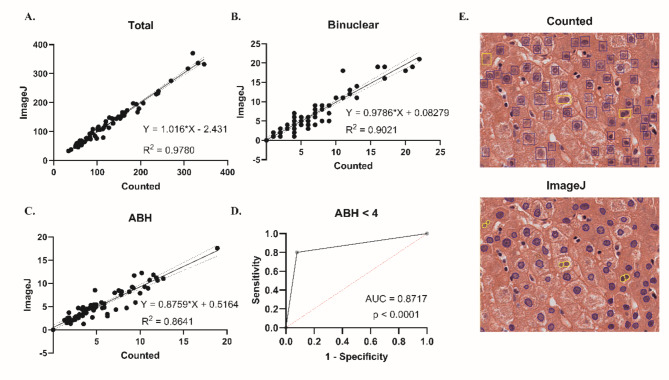
Hepatocellular carcinoma (HCC) is notorious for its high likelihood of recurrence even after radical surgery, which calls for effective adjuvant therapy based on more precise patient selection. The decline of the abundance of binuclear hepatocytes (ABH) in paracancerous liver tissues has been reported to indicate pathological changes in liver cells, leading to short-term recurrence within 2 years. In this research, we analyzed 34 HCC patients and 22 patients underwent liver surgery for non-HCC diseases. An ImageJ script was used to assess binuclear hepatocytes in the HE-staining specimens of paracancerous liver tissues. ABH significantly decreased in HCC patients and indicated poorer outcomes. Immunohistochemistry (IHC) assays suggested ploidy-related regulation of arginase 1 (ARG1) expression. Our findings suggested computer-assisted assessment of ABH as a possible biomarker for short-term HCC recurrence.


Conflict of interest statement

Declarations. Competing interests: The authors declare no competing interests.

Figures

Fig. 1
Fig. 1
Procedure of computer-assisted identification of binuclear hepatocytes. (A) An example of the original footage before ImageJ processing. The white balance was deliberately tweaked for better contrast between nuclear and cytoplasm. (B) The original picture was gray-scaled and Gaussian smoothed to select the nuclear. (C) The binarized figure shows nuclear, with overlapping nuclear divided. (D) The final result after ImageJ processing of the example figure. Blue circles represent hepatocyte nuclear, and pairs of yellow circles represent binuclear hepatocytes.
Fig. 2
Fig. 2
Comparison of pathologist and computer-assisted counting of hepatocytes. (AC) The linear regression of the pathologists counted number and the ImageJ-generated number of total hepatocytes, binuclear hepatocytes, and ABH. The residual plot shows the distribution of each model’s residual. (D) The ROC curve of using cABH<4% to predict pABH<4%. (E) Typical images showing side-by-side comparison of pathologist-counted hepatocytes (normal: blue square, binuclear: yellow square) and ImageJ labeled hepatocytes (normal: blue circle, binuclear: yellow circle).
Fig. 3
Fig. 3
ABH is related to various clinicopathological features. (A, G) The comparison of average ABH among patients with benign disease, non-HCC malignancy and HCC, using pABH or cABH individually. pABH: Benign ABH = 11.49 ± 4.504%, non-HCC malignancy ABH = 6.793 ± 3.403%, HCC ABH = 4.348 ± 2.736%. Benign vs. HCC p<0.0001, Benign vs. Non-HCC malignancy p = 0.0097, HCC vs. non-HCC malignancy p = 0.0188. cABH: Benign ABH = 11.5 ± 3.777%, non-HCC malignancy ABH = 6.513 ± 3.488%, HCC ABH = 4.224 ± 2.409%. Benign vs. HCC p<0.0001, Benign vs. Non-HCC malignancy p = 0.0022, HCC vs. non-HCC malignancy p = 0.0158. (B–F, H–L) The comparison of ABH in HCC patients with different clinicopathological characters. cABH and pABH were compared individually. (B, H) Patients who relapsed within 2 years or not. pABH: recurrence- ABH = 5.427 ± 3.127%, recurrence + ABH = 3.313 ± 2.207%, p = 0.0232. cABH: recurrence- ABH = 5.269 ± 2.614%, recurrence + ABH = 3.258 ± 1.891%, p = 0.0109. (C, I) Patients within groups of BCLC 0-A, or BCLC B. pABH: BCLC 0-A ABH = 4.887 ± 3.198%, BCLC B ABH = 3.65 ± 1.721%, p = 0.2734. cABH: BCLC 0-A ABH = 4.673 ± 2.733%, BCLC B ABH = 3.878 ± 1.622%, p = 0.4118. (D, J) Patients with or without liver cirrhosis. pABH: cirrhosis- ABH = 6.548 ± 4.027%, cirrhosis + ABH = 4.482 ± 2.985%, p = 0.0163. cABH: cirrhosis- ABH = 6.418 ± 3.863%, cirrhosis + ABH = 4.281 ± 2.681%, p = 0.008. (E, K) Patients who have or haven’t received neoadjuvant therapy. pABH: neotherapy- ABH = 4.592 ± 2.906%, neotherapy + ABH = 3.156 ± 1.163%, p = 0.1534. cABH: neotherapy- ABH = 4.433 ± 2.528%, neotherapy + ABH = 3.202 ± 1.399%, p = 0.1646. (F, L) Comparison of ABH between ARG1 low, medium and high positive groups. pABH: low positive ABH = 4.109 ± 3.610, medium positive ABH = 4.207 ± 2.097, high positive ABH = 11.34 ± 1.9, p = 0.0023. cABH: low positive ABH = 4.106 ± 2.882, medium positive ABH = 4.313 ± 1.94, high positive ABH = 9.465 ± 2.22, p = 0.011. (M) Example of ABH (labeled with yellow square) in ARG1 high positive (left) and low positive tissues (right).
Fig. 4
Fig. 4
Prognostic values of ABH for the short-term recurrence of HCC after radical surgery. (A) The univariable logistic regression of pABH, cABH, and BCLC on 2-year recurrence. (B) The forest plot of univariable logistic regression shows each variable’s OR under logarithmic scale. (C, D) The multivariable logistic regressions and the paired forest plots of pABH and cABH with the history of neotherapy, BCLC, tumor number and AFP. E. The Kaplan–Meier survival plot of HCC patients of ABH ≥ 4% group or ABH<4% group. pABH and cABH were plotted individually. (F, G) The heat map and volcano plot shows DEGs in HCC tissues and normal liver tissues. ARG1 is highly expressed in both types of tissues while being slightly down-regulated in HCC tissues. (H) The survival plot of HCC patients with high or low ARG1 expression. No significant difference was achieved. (I) The survival plot of late-stage (BCLC C) HCC patients with high or low ARG1 expression. The medium survival period of the ARG1-low group is 21.6 months, comparing with 40.3 months in the ARG1-high group (p = 0.05).
Fig. 5
Fig. 5
Reduction of ABH predicts short-term recurrence after surgery in patients haven’t been recommended adjuvant therapy by current standards. (A, B) The percentage of pABH < 4% patients in short-term recurrence group and no recurrence group, with or without adjuvant therapy. (C, D) The percentage of cABH < 4% patients in short-term recurrence group and no recurrence group, with or without adjuvant therapy.

Similar articles

References

    1. Sung, H. et al. Global Cancer statistics 2020: GLOBOCAN estimates of incidence and mortality worldwide for 36 cancers in 185 countries. CA Cancer J. Clin.71(3), 209–249. 10.3322/caac.21660 (2021). - PubMed
    1. Wang, Y. et al. Overview and countermeasures of cancer burden in China. Sci. China Life Sci.66(11), 2515–2526. 10.1007/s11427-022-2240-6 (2023). - PMC - PubMed
    1. Tabrizian, P., Jibara, G., Shrager, B., Schwartz, M. & Roayaie, S. Recurrence of hepatocellular cancer after resection: Patterns, treatments, and prognosis. Ann. Surg.261(5), 947–955. 10.1097/sla.0000000000000710 (2015). - PubMed
    1. Vasuri, F. et al. Beyond histology: A tissue algorithm predictive of post-surgical recurrence in hepatocellular carcinomas, including TERT promoter mutation. Virchows Arch.18. 10.1007/s00428-024-03791-y (2024). - PMC - PubMed
    1. Suzuki, H., Mishra, S., Paul, S. & Hoshida, Y. Molecular and immune landscape of hepatocellular carcinoma for therapeutic development. J. Liver Cancer6. 10.17998/jlc.2024.12.02 (2024). - PMC - PubMed