. 2025 May;39(5):1157-1168.
doi: 10.1038/s41375-025-02557-y. Epub 2025 Mar 20.

Bcor loss promotes Richter transformation of chronic lymphocytic leukemia associated with Notch1 activation in mice

Affiliations

Bcor loss promotes Richter transformation of chronic lymphocytic leukemia associated with Notch1 activation in mice

Chiara Rompietti et al. Leukemia. 2025 May.

Abstract

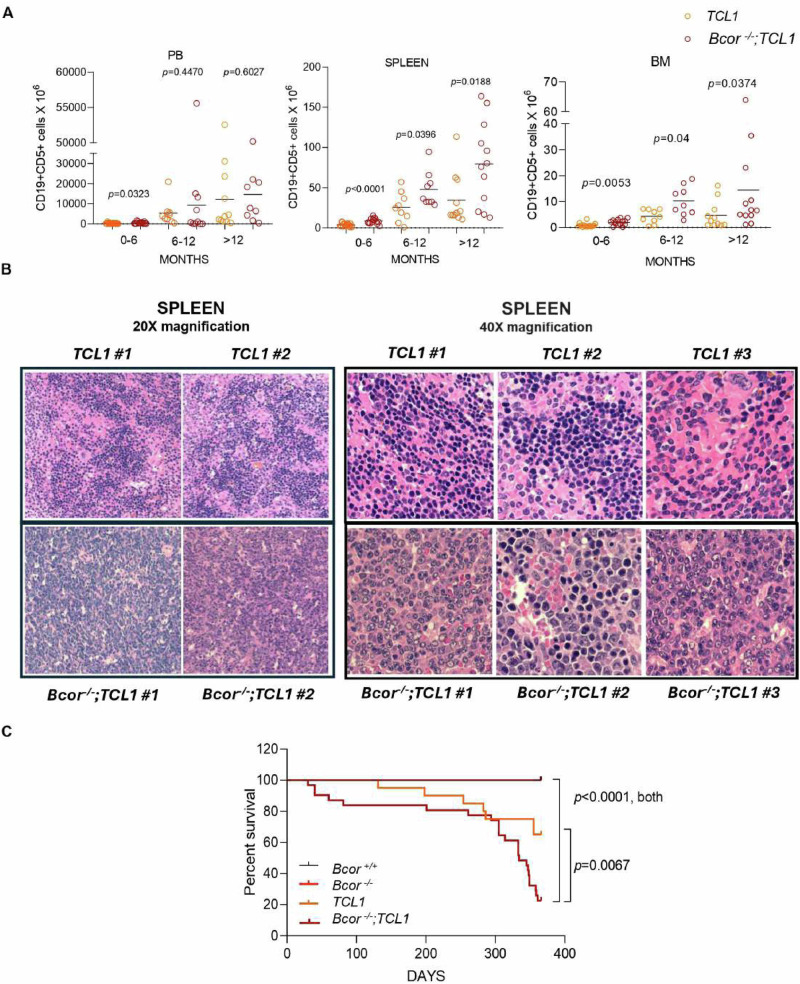
Richter's transformation (RT) is an aggressive lymphoma occurring upon progression from chronic lymphocytic leukemia (CLL). Despite advances in deciphering the RT genetic architecture, the mechanisms driving this disease remain unknown. BCOR disruptive mutations were found in CLL and frequently associated with NOTCH1 aberrations, a common feature in CLL and RT. We engineered mice to knock-out Bcor in B and CLL cells of Eμ-TCL1 mice. Bcor loss resulted in alterations of the B cell compartment and favored CLL transformation into an aggressive lymphoma with reduced survival in Eμ-TCL1 mice. RNA-sequencing demonstrated a molecular signature reminiscent of human RT and implied the involvement of the T cell tumour microenvironment in the disease onset. Bcor deficiency was associated with Notch1 activation in splenic CD19 + CD5+ cells to accelerate Eμ-TCL1 mice lymphoproliferation. Notch1 inhibition progressively reduced circulating CD19+ CD5+ and RT cells infiltrating the spleen of diseased mice with concomitant reduction of PD-1 expressing T cells and improved survival. Our data demonstrated an interplay between the tumour suppressor activity of Bcor and Notch1 in RT pathogenesis with potential for tumour targeting. This model represented a new platform to uncover promising alternatives for this incurable tumour.


Conflict of interest statement

Competing interests: The authors declare no competing interests. Ethics approval and consent to participate: All methods were performed in accordance with the relevant guidelines and regulations. The Institutional Animal Care and Use Committee approved all the procedures. Experiments were performed with the approval of the Italian Ministry of Health (authorization n°971/2020-PR and n°253/2024-PR).

Figures

Fig. 1
Fig. 1. Bcor loss in TCL1 leukemic mice triggers CLL toward a high-grade lymphoid malignancy.
A FC1 analysis of CD19+ CD5+ cells in TCL1 vs Bcor−/−;TCL1 mice at different time-points in (i) PB2 at 0–-6 months (N = 17, 14), 6–12 months (N = 10, 10) and >12 months (N = 11, 9); (ii) spleen at 0-6 months (N = 17, 14), 6–12 months (N = 9, 9) and >12 months (N = 11, 12); (iii) BM3 at 0-6 months (N = 17, 14), 6–12 months (N = 9, 9) and >12 months (N = 11, 12); Mean ± SD4. P values are indicated above each graph according to Mann-Whitney U test. (B) Representative images of H&E5 staining of spleen magnification 20× (N = 2 for each genotype; left panels) and 40× (N = 3 for each genotype; right panels): sections from TCL1 (upper panels) and Bcor−/−;TCL1 (bottom panels) mice. UPlanApo 40×/0.85 NA objective, Olympus BX-51 microscope. (C) OS6 curve of Bcor−/−;TCL1 (N = 25) compared to Bcor+/+ (N = 19), Bcor−/−(N = 25) and TCL1 (N = 20) controls. Survival curves are compared using a Long-rank (Mantel-Cox) test. 1Flow cytometry; 2Peripheral Blood; 3Bone Marrow; 4Standard Deviation; 5Hematoxylin and Eosin; 6Overall survival.
Fig. 2
Fig. 2. Bcor−/−; TCL1 transplanted mice closely mimic RT found in humans phenotypically.
(A) Representative images of spleen (left) and scatter dot plot graph showing spleen/body weight ratios (right) of Bcor−/−; TCL1 (N = 10) compared to TCL1 (N = 8) transplanted mice. P value is indicated above the graph according to Mann-Whitney U test. (B) Representative images of H&E1 staining of spleen (left; magnification 40×) and liver (right; magnification 20×) sections from TCL1 (upper panels) and Bcor−/−;TCL1 (bottom panels) transplanted mice (N = 3, respectively). UPlanApo 40×/0.85 NA objective, Olympus B×-51 microscope. (C) OS2 curves of Bcor−/−;TCL1 (N = 18) compared to TCL1 (N = 9) transplanted mice showing a median survival of 36 (range 30–69; 5.56% of survival at day 75) vs 74 (range 67–74; 20% of survival at day 75) days, respectively. Survival curves were compared using a Long-rank (Mantel-Cox) test. 1Hematoxylin and Eosin; 2Overall survival.
Fig. 3
Fig. 3. Transcriptomic profile of Bcor−/−; TCL1 mice mimic human RT.
A Heatmap of selected DEGs1 (FDR2 q < 0.05) showing upregulation of Ccnd2 (log2FoldChange = 1.887; padj < 0.0001), Ccnb1 (log2FC = 1.505; padj < 0.0001), Ccnd3 (log2FC = 1.546; padj < 0.0029), Cdk1 (log2FC = 1.328; padj = 0.0001), Cdk6 (log2FC = 2.324; padj < 0.0001), and downregulation of Cdkn1a (log2FC = −1.885; padj = 0.0003), Cdkn2b (log2FC = −1.621; padj < 0.0001) in splenic B cells sorted from Bcor−/−;TCL1 compared to TCL1 mice (N = 3, both). B Bar graph showing NES3 of deregulated pathways (“Oxidative Phosphorylation” NES = 1.19; “Glycolysis” NES = 1.06; “Generation of precursor metabolites and energy” NES = 1.15; “DNA Damage Repair” NES = 1.13; “mTORC1 Signalling” NES = 1.26; “Aerobic Respiration” NES = 1.41; “G2M_Checkpoint” NES = 1.66; “E2F Targets” NES = 1.92; “MYC_Targets” NES = 2.07; “Plasma Membrane Organization” NES = −1.64; “BCR Signaling Pathway” NES = −1.63; “Antigen Activates BCR Signaling” NES = −1.73; “Adaptive_Immune_System” NES = −1.89 “Mitochondrial_Translation” NES = 1.42) resulted from pathway enrichment analysis in splenic sorted B cells from Bcor−/−;TCL1 compared to TCL1 mice (N = 3, both) after RNA-seq analysis. 1Differential Expressed Genes; 2False Discovery Rate; 3Normalized Enriched Score.
Fig. 4
Fig. 4. In vivo effects of Bcor deletion and TCL1 overexpression in neoplastic B cells and T cells from TME.
A Heatmap of selected DEGs1 (FDR2 < 0.05, p adj3 < 0.05 and log Fold Change threshold of 1) showing upregulation of Ccl17 (log2FC = 5.71; padj < 0.0001), Ccl22 (log2FC = 7.73; padj < 0.0001), Il6ra (log2FC = 1.36; padj = 0.001), Cx3cl1 (log2FC = 6.86; padj < 0.0001), Tgfbr1 (log2FC = 1.04; padj = 0.003) and dowregulation of H2-Q2 (log2FC = −3.50; padj < 0.0001) and Lair1 (log2FC = −5.26; padj < 0.0001) in splenic-sorted B cells from Bcor−/−;TCL1 compared to TCL1 mice (N = 3, both). B FC4 analysis of the BM5 T-cell compartment of TCL1 vs Bcor−/−; TCL1 mice showing altered (i) CD4+ (N = 5), (ii) CD4 + CD25+ (N = 5) and (iii) CD8+ (N = 5) cells frequencies and relative CD4+ (N = 5), CD4 + CD25+ (N = 5) and CD8+ (N = 5) cell number. Mean ± SD6. P values are indicated above each graph according to Mann-Whitney U test. C FC4 analysis of TCL1 vs Bcor−/−; TCL1 mice BM5 samples showing the frequencies of the PD-1 marker gated on CD4+ (N = 5), CD4 + CD25 + (N = 5), and CD8+ (N = 5) cell populations. Mean ± SD6. P values are indicated above each graph according to Mann-Whitney U test. 1Differential Expressed Genes; 2False Discovery Rate; 3Adjusted p-value; 4Flow Cytometry; 5Bone Marrow; 6Standard Deviation.
Fig. 5
Fig. 5. Bcor−/−; TCL1 mice exhibit Notch1 signalling activation.
A Real-time qPCR analysis of Notch1, Hes1 and Myc mRNA levels in splenic flow sorted B cells from TCL1 and Bcor−/−; TCL1 transplanted mice (N = 5, both). Mean ± SD1. P values are indicated above each graph according to Mann-Whitney U test. B Representative WB2 (left) analysis and relative densitometry graphs (right) of NICD3 in splenic flow sorted B cells from TCL1 and Bcor−/−; TCL1 transplanted mice. Densitometry analyses are normalized to β-Actin and performed using Image Lab software. C Representative IHC4 staining showing NICD3- positive cells on splenic sections from TCL1 and Bcor−/−; TCL1 transplanted mice (N = 3, both). Magnification 40× (UPlanApo 40×/0.85 NA objective, Olympus BX-51 microscope). 1Standard Deviation; 2Western Blot; 3Notch1 Intracellular Domain: 4Immunohystochemestry.
Fig. 6
Fig. 6. Cellular and molecular effects of bepridil treatment on Bcor−/−; TCL1 mice outcome.
A Curve graph showing the time course differences between vehicle (N = 3) vs bepridil-treated (N = 3) groups of Bcor−/−; TCL1 transplanted mice in number of PB1 CD19+ CD5+ : day 0, 91.98 cells/mL ± 87.68 vs 163.3 cells/mL ± 172, respectively, p = 0.645; day 14, 772.5 cells/mL ± 625 vs 466.9 cells/mL ± 322.7, respectively, p = 0.629; day 21, 2,220 cells/mL ± 1021 vs 211.7 cells/mL ± 148.6, respectively, p = 0.008; day 28, 3195 cells/mL  ± 282 vs 1023 cells/mL ± 440, respectively, p = 0.002. Mean ± SD2. P values are calculated for each time-point according to U t-test and indicated above the graph in case of statistical significance. (B) Scatter dot plot graph showing the spleen/body weight ratios of transplanted Bcor−/−; TCL1 mice after treatment with vehicle vs bepridil (0.0065 ± 0.0003 vs 0.0045 ± 0.0007; p = 0.0107; N = 3, both). Mean ± SD2. P value is indicated above the graph according to U t-test. (C) Representative images of H&E3 staining ( ~ 2x digital magnification of the 40X magnification acquisitions) of splenic sections from Bcor−/−; TCL1 transplanted mice treated with vehicle (upper panel, N = 3) or bepridil (bottom panel, N = 3). Images evidence a change in cell-morphology with a prevalence of small monomorphic CLL4 cells after bepridil treatment (bottom panel), reminding the leukemic cells of TCL1 mice (shown in Fig. 1), in place of the large sized cells characterizing the RT5 phenotype of Bcor−/−; TCL1, which are present in the spleen of vehicle mice instead (upper panel). Magnification 40X (UPlanApo 40×/0.85 NA objective, Olympus BX-51 microscope). (D) Representative IHC6 staining on splenic sections from Bcor−/−; TCL1 mice showing the variation in number of NICD7-positive cells between vehicle (upper panel; N = 3) and bepridil-treated (bottom panel; N = 3) groups. Magnification 40X (UPlanApo 40×/0.85 NA objective, Olympus BX-51 microscope). (E) Representative WB8 analysis (top position) and relative densitometry graphs (bottom position) showing the differences in NICD7, MYC and HES1 protein levels in splenic-sorted B cells from a Bcor−/−; TCL1 transplanted mouse after vehicle (N = 3) vs bepridil (N = 3) treatment. Densitometry analyses are normalized to β-Actin and performed using Image Lab software. (F) FC9 analysis of the PD-1 marker in BM10 samples of Bcor−/−;TCL1 transplanted mice treated with bepridil (N = 3) compared to the vehicle (N = 3), gated on CD4+ (46.77% ± 2.67 vs 35.37% ± 0.49, respectively, and absolute number 0.33 × 106 ± 0.06 vs 0.21 × 106 ± 0.01 cells, respectively; left) and CD4 + CD25+ (0.1% ± 0.013 vs 0.05% ± 0.012, respectively, and absolute number 0.07 × 106 ± 0.007 vs 0.04 × 106 ± 0.01 cells, respectively; right) T-cell populations. Mean ± SEM11. P values are indicated above the relative graphs according to U t-test. 1Peripheral Blood; 2Standard Deviation; 3Hematoxylin and Eosin; 4Chronic Lymphocytic Leukemia; 5Richter Transformation; 6Immunohystochemestry; 7Notch1 Intracellular Domain; 8Western Blot; 9Flow Cytometry; 10Bone Marrow; 11Standard Error of the Mean.

References

    1. Nadeu F, Royo R, Massoni-Badosa R, Playa-Albinyana H, Garcia-Torre B, Duran-Ferrer M, et al. Detection of early seeding of Richter transformation in chronic lymphocytic leukemia. Nat Med. 2022;28:1662–71. - PMC - PubMed
    1. Puente XS, Pinyol M, Quesada V, Conde L, Ordóñez GR, Villamor N, et al. Whole-genome sequencing identifies recurrent mutations in chronic lymphocytic leukaemia. Nature. 2011;475:101–5. - PMC - PubMed
    1. Sportoletti P, Baldoni S, Del Papa B, Aureli P, Dorillo E, Ruggeri L, et al. A revised NOTCH1 mutation frequency still impacts survival while the allele burden predicts early progression in chronic lymphocytic leukemia. Leukemia. 2014;28:436–9. - PubMed
    1. Landau DA, Carter SL, Stojanov P, McKenna A, Stevenson K, Lawrence MS, et al. Evolution and impact of subclonal mutations in chronic lymphocytic leukemia. Cell. 2013;152:714–26. - PMC - PubMed
    1. Rosati E, Baldoni S, De Falco F, Del Papa B, Dorillo E, Rompietti C, et al. NOTCH1 aberrations in chronic lymphocytic leukemia. Front Oncol. 2018;8:229. - PMC - PubMed

MeSH terms

LinkOut - more resources